The letters displayed start with expiration and work backwards to the start of the expiration cycle.
Agora Outlook
Publisher Ken
Davidson
Fax 250-860-2051
e-maildavidson@silk.net
www.agoraoutlook.com
The question is, which way is the market about to head then? With 30% of all NYSE stocks below their 10-week moving average it would normally be a buy signal for the market. If these stocks now begin to rally while the big caps are correcting, we should expect the market to stay neutral. But, we could see the movement in the smaller stocks get the big caps going once again resulting in new highs. It will be important to see if the advance/decline moves to a new low. That would likely bring the whole market lower. We should know by next week as the a/d line is already so close to its October’ 98 low.
With the market still undecided about economic conditions, interest rates and earnings slowdowns, we’ll likely continue to see daily volatility. We have been relatively flat for two months so a break to the upside or downside is likely to transpire this coming expiration cycle. If we don’t move sharply lower in the next couple of weeks, we’re even more likely to break out to the upside. However, even if we do move higher I still don’t think that it would be as sharp as other breakouts have been because traders are starting to realize that there is a high probability of an interest rate increase in the spring. Overall, it looks like another grinding month with an upward tilt after we finish forming the base. Technicals, (see below) are pointing to being oversold which means we’re more likely to move higher than lower although we probably will continue to be flat until after Mr. Greenspan, the Federal Reserves Chief, is finished giving his testimony to congress next week.
TechnicallyStochastics and momentum indicators are still giving a neutral reading on a daily basis and almost overbought short term but most indicators are giving mixed readings for the coming week.
The Mclellan Oscillator is still oversold and the summation index is deeply oversold. The summation index collapsed this week and is approaching the Oct’. 98 lows, which indicates that a bounce, may be near. This indicator follows both the 5 and 10 day Arms indexes, both being deeply oversold. The Arms indicators have been good predictors of the market so we should take note of their readings.
One indicator that is remaining high is the volatility index. It is sitting over 30, indicating that the market may still see some downward pressure before it starts to move higher yet. It also looks like the bulls are starting to pull back now that the market has been flat for a while now but the indicator is still giving a bearish reading. Overall, indicators are very mixed and the market is confirming that as it will continue in its sideways action at least for the coming week.
Mclellan Oscillator: -58 -100 oversold +100 overboughtFive day arms: 1.19 and below, overbought 1.00 and
above, oversold
Ten day arms: 1.10 .80 and below, overbought 1.00 and above, oversold
Bulls: 55.7 previous week 60.7 50%
plus overbought/bearish
Bears: 28.7 previous week 28.2 50% plus oversold /bullish
Correction: 15.6 previous week 11.1`
Five day Qvix: 31.85
Economic Effects
It was also well above the 0.1% rise forecast by economists in a Reuter’s survey. There was very little reaction in financial markets as traders saw the gain in producer prices outweighed by a fall in the core rate. The core PPI, which strips out volatile food and energy costs, eased by 0.1% in January after a 1% rise in December. Economists had expected the core index to increase by 0.1%.
Food and energy prices have been extremely soft over the past year because economic problems in Asia, Russia and Latin America have depressed global demand for farm products, oil and an array of other commodities.
Prices of food products, which make up nearly one-fourth of the PPI, surged 1.6% in January, their biggest gain since a matching rise in April, 1993. Prices of energy goods rebounded from two straight months of steep declines, climbing 1.8% last month. Soaring gasoline and heating oil costs helped drive the gain, but costs for residential electric power and natural gas also grew. Helping to offset those strong price gains was a 1.2% drop in the cost of passenger cars. While stressing that the latest PPI data did not set off any inflation alarm bells, some economists said it might be an indication the best news on prices is in the past.
The Labor Department said the number of people filing
first-time claims for unemployment benefits rose slightly last week, but remained at
levels suggesting a strong labor market. Initial jobless claims rose by 4,000 to
288,000 in the week ended Feb. 13 from 284,000 in the prior week. The four-week average of
initial claims, viewed as a more accurate barometer of the job market, fell to 292,000,
the lowest since 1989.
The CPI, the government's main inflation gauge, had risen by 0.1% in December with a 0.3% gain in the core that month. In the 12 months ended in January, the CPI was up 1.7%. The CPI numbers look good. There are no danger signs of inflation. The mild CPI rise in January came despite a 0.5% jump in food costs, which make up a sizable 15% of the total CPI Index.
Many other major categories of goods and services showed little or no inflation in the month. Energy costs eased 0.2%, with fuel oil, electricity and natural gas costs down but gasoline prices up slightly. Housing prices dipped 0.1% in January, showing their first monthly decline since February 1986. Apparel prices slid 1.1%, the steepest drop in a decade. But medical care costs firmed 0.3% and the volatile airline-fare category surged 1.8%.
The meagerness of the January CPI gain should relax any worries raised by the report released Thursday showing an unexpectedly high increase in the Producer Price Index for January. The PPI, which measures wholesale inflation as opposed to the retail prices tracked by the CPI, rose 0.5%, driven up by higher food and energy costs. The CPI and the PPI often differ, especially on a month-to-month basis, because they are computed differently. While the PPI is based on a survey of businesses, the CPI is calculated from prices observed in stores and other retail outlets.
January marked the first month the department began calculating the CPI based on a new method called ``geometric mean.'' The change aims to take into account ways that consumers insulate themselves from inflation by substituting among similar items. For example, they could switch to Granny Smith apples if the price of Red Delicious apples goes up. The change is expected to reduce the CPI's annual growth rate by two-tenths of a percentage point, but officials said the impact for a one-month time frame would be so small, it probably wouldn't be noticeable in the January figures.
The U.S. trade deficit jumped to a record $168.59 billion last year as the robust domestic economy sucked in imports from countries trying to export their way out of economic turmoil. The gap narrowed unexpectedly in December to $13.79 billion from $15.26 billion in November. Analysts had been expecting a $15.8 billion trade gap in December.The record deficit for 1998, up 53% from $110.21 billion in 1997, had been predicted for the last several months by U.S. trade officials as economic turmoil gripped Asia, Russia and Brazil. Financial markets greeted the lower-than-expected December trade gap as a positive sign for the U.S. economy, and it helped trigger a rise in the value of the dollar.
There was a fairly sharp drop in imports but exports, in general, remain weak as the dollar remains relatively strong and many economies are experiencing softness. Economists said the surprise December data could prompt them to revise upwards their estimates for economic growth in the last quarter of 1998. Some said it could mean the economy grew by about 6% instead of the government's 5.6% advance estimate.
The 1998 record trade gap reflected the overall strength of the U.S. economy and weakness among its many trading partners including Japan. The deficit with Japan rose to $5.88 billion in December from $5.78 billion in November and totaled $64.1 billion in 1998, the highest since 1994 when the deficit was $65.7 billion, the department said. The deficit totaled $56.1 billion in 1997. The U.S. deficit with China fell in December to $3.98 billion from $5.03 billion in November. The 1998 deficit of $56.9 billion was a record, widening from $49.7 billion in 1997. In December, the U.S. trade gap with Canada rose to $2.18 billion from $1.75 billion in November. The deficit with Mexico rose to $1.26 billion in December from $1.25 billion in November.
MARKET CLOSES
Index |
Last Week |
This Week |
Change |
Percent |
Dow Jones |
9274.89 |
9339.95 |
+65.06 |
0.7 |
S & P 500 |
1230.14 |
1239.16 |
+9.02 |
0.7 |
S & P 500 Futures Dec. |
1238.50 |
1243.00 |
+4.50 |
0.3 |
S & P 100 |
615.33 |
620.25 |
+4.92 |
0.8 |
Nasdaq |
2321.94 |
2283.44 |
-38.50 |
1.7 |
Russell 2000 |
398.24 |
392.30 |
-5.94 |
1.5 |
30 Year bond |
5.42% |
5.38% |
This month we had 10 cash trades on and 6 futures options trades, all of which turned out good profits this month. This was the highest number of trades we have ever placed in an expiration cycle. It was a difficult month to get into Long Cash Call Trades on the S&P 500 but we did get a few on the S&P 100.
The coming month should be interesting as March has always been a mixed month, but we’re confident that our Program Numbers will steer us in the right direction for our 3rd profitable month of 1999!
Short Sells |
Outright Sells |
Long Trades |
Ultra Conservative Trades |
| 1200/1190 SPX Puts $1.00 credit, $100.00 per contract 10% profit | Sold 1200 SPX Puts $7.75 credit, $775.00 per contract 10% profit |
1185/1180 SPX Puts $1.00 credit, $100.00 per contract 20% profit |
1100/1075 SPX Puts $2.75 credit, $275.00 per contract 11% profit |
| 1220/1215 SPX Puts $2.00 credit, $200.00 per contract 40% profit | Sold 1100 SPX Puts $8.50 credit $850.00 per contract 11% profit |
585/580 OEX Puts $1.38 credit, $138.00 per contract 28% profit |
670/ 680 OEX Calls $1.25 credit, $125.00 per contract 25% profit |
650/655 OEX Calls $1.63 credit $163.00 per contract profit 33% |
560/555 OEX Puts $.63 credit, $63.00 per contract 13% profit |
||
| Total 50%. Short trades are calculated separately because they can be placed at anytime. | Total 21%. Outright Sells are calculated separately because they can be placed at anytime. | Total 81%. Long trades are averaged for the record sheet as we normally place both up and down trades. Average 28% | Total 49%. Ultra trades are averaged for the record sheet as we normally place both up and down trades. Average 18% |
Cash option outright sells margin is calculated with an average margin of $7500.00 per contract and spreads with a $500.00 per contract basis. We do not include interest profits on credit taken. (Margin estimates are based on the average subscribers account requirements.)
Futures Option Profits for February
Short Trades |
Outright Sells |
Long Trades |
Ultra Conservative Trades |
| 1200/1190 S&P 500 Puts $1.00 credit, $250.00, 10% profit | Sold 1200 S&P500 Puts $7.75 credit, $1937.50 13% profit |
1185/1180 S&P 500 Puts $1.00 credit, $250.00 profit 20% |
1350/1360 S&P 500 Calls $1.00 credit, $250.00 10% profit |
Sold 1100 SPX Puts $8.50 credit, $2125.00 profit 11%. |
1100/1090 S&P 500 Puts $1.50 credit, $375.00 15% profit |
||
| Total 10%. Short trades are calculated separately because they can be placed at anytime. | Total 23%. Outright Sells are calculated separately because they can be placed at anytime. | Total 20%. Long trades are averaged for the record sheet as we normally place both up and down trades. Average 20% | Total 25%. Ultra trades are averaged for the record sheet as we normally place both up and down trades. Average 13% |
Futures Outright Sells are calculated with an average margin requirement of $15,000. Credit Spreads for 5 points = $1250.00, 10 points = $2500.00. We do not include interest profits on credit taken in. (Margin estimates are based on the average subscribers account requirements.)
Average Entry price |
Bid |
ask |
last |
|
S&P 500 Cash Trades: |
||||
Sold 1200 Put $7.75 |
Outright Sell $11.25 |
0 |
0 |
0 |
Bought back $3.50 giving a 10% profit |
||||
1200 sold SPX Put $8.25 |
Short trade |
0 |
0 |
0 |
1190 bought SPX Put $7.25 |
$1.00 credit spread |
0 |
0 |
0 |
1100 sold SPX Put $8.50 |
Outright sell $8.50 |
0 |
0 |
0 |
Stop at $15.00 |
||||
1185 sold SPX Put $20.00 |
Long Put Trade |
0 |
0 |
0 |
1180 bought SPX Put $19.00 |
$1.00 credit spread |
0 |
0 |
0 |
1100 sold SPX Put $9.75 |
Ultra Put Trade |
0 |
0 |
0 |
1075 bought SPX Put $7.00 |
$2.75 credit spread |
0 |
0 |
0 |
1220 sold SPX Put $25.50 |
Short trade |
0 |
0 |
0 |
1215 bought SPX Put $23.50 |
$2.00 credit spread |
0 |
0 |
0 |
S&P 100 Trades: |
||||
585 sold OEX Put $8.50 |
Long trade |
0 |
0 |
0 |
580 bought OEX Put $7.13 |
$1.38 credit spread |
0 |
0 |
0 |
560 sold OEX Put $5.25 |
Ultra trade |
0 |
0 |
0 |
555 bought OEX Put $4.63 |
credit spread $.63 |
0 |
0 |
0 |
650 sold OEX Call $7.00 |
Long trade |
0 |
0 |
0 |
655 bought OEX Call $5.38 |
credit spread $1.63. |
0 |
0 |
0 |
670 sold OEX Call $2.50 |
Ultra trade |
0 |
0 |
0 |
680 bought OEX Put $1.25 |
credit spread $1.25 |
0 |
0 |
0 |
S&P 500 Options Feb. Futures Trades |
Low |
High |
Close |
|
Sold 1200 Put $10.75 |
Outright Sell $10.75 |
0 |
0 |
0 |
Bought back $3.00 giving a 13% profit |
||||
1200 sold Put $8.00 |
Short trade |
0 |
0 |
0 |
1190 bought Put $7.00 |
$1.00 credit spread |
0 |
0 |
0 |
Sold 1100 Put $8.50 |
Outright Sell $8.50 |
0 |
0 |
0 |
Stop at $15.00 |
||||
Sold 1350 Calls $2.00 |
Ultra Trade |
0 |
0 |
0 |
Bought 1360 Calls $1.00 |
$1.00 Credit |
0 |
0 |
0 |
Sold 1185 Puts $13.50 |
Long Trade |
0 |
0 |
0 |
Bought 1180 Calls $12.00 |
$1.50 Credit |
0 |
0 |
0 |
Sold 1100 Puts $8.00 |
Ultra Trade |
0 |
0 |
0 |
Bought 1090 Puts $6.50 |
$1.50 |
0 |
0 |
0 |
Copyright © 1998. All rights reserved. The information contained in the AGORA OUTLOOK NEWSLETTER is based upon data that is believed to be accurate, but is not guaranteed, and subject to change without notice. All projections, forecasts, opinions, and track records cannot be guaranteed to equal our past performance. Persons reading this newsletter are responsible for their actions. Officers and employees of this publication may at times have a position in the securities mentioned, or related services.
Short Trades |
Long Trades |
Ultra Trades |
Outright Short Sales |
|||||
| 1999 Current | 67% |
1999 Current | 68% |
1999 Current | 39% |
1999 Current | 22% |
|
| 1998 | 66% |
1998 | 43% |
1998 | 79% |
1998 | 71% |
|
| 1997 | 108% |
1997 | 188% |
1997 | 82% |
|||
| 1996 | 163% |
1996 | 169% |
1996 | 99% |
|||
| 1995 | 93% |
1995 | 76% |
|||||
| 1994 | 79% |
1994 | 89% |
|||||
| 1993 | 177% |
1993 | long |
|||||
| 1992 | 112% |
1992 | long |
|||||
| 1991 | 162% |
1991 | long |
|||||
| 1990 | 166% |
1990 | long |
|||||
Futures Trades
Outright Sells & Strangles |
Long Trades |
Ultra Trades |
| 1999 Current 37% | 1999 Current 53% | 1999 Current 33% |
| 1998 130% | 1998 93% | 1998 16% |
Agora Outlook
Publisher Ken Davidson
Fax 250-860-2051
e-mail davidson@silk.net
www.agoraoutlook.com
Davidson’s View
Thursday and Friday’s performance was a very positive indicator for me. I believe this is going to be a great year for trading. In the past whenever the market has seen such a run up as it did on Thursday it usually had a follow through rally. A day trader would have gotten killed in this kind of trading but if you were a seller as we always are, it was a good thing.
This type of volatility is great for placing Credit Spreads or Outright Sells and it looks like this will continue all year or at least until the market has a huge correction.
On Friday when the 30-year bond collapsed and blew out long term support, the stock market almost gave up all of its Thursday gains. For months, stocks and bonds have been diverging but with the 30-year closing at 5.42%, stock valuations are probably looking pretty high to traders. For the near term, stocks will have a hard time making any progress as long as bonds remain around these levels.
Another difficulty the broader market has to deal with are the new problems the technology sector is experiencing. Thursday's record point move in the Nasdaq Composite and particularly the technology sectors made the headlines. Technology has been the leader of the big explosive moves in the Nasdaq and the S&P 500 during the last six months.
This seemed to change on Friday with the big sell off in Dell taking the entire tech sector lower. The Nasdaq Composite fell –83.61 points or 3.5%. Dell fell $12.00 alone on the day. This was due to some vague comments made by a couple of analysts implying that Dell might have competition. Isn’t that surprising! It appears that there is now vulnerability in the tech sector as a whole.
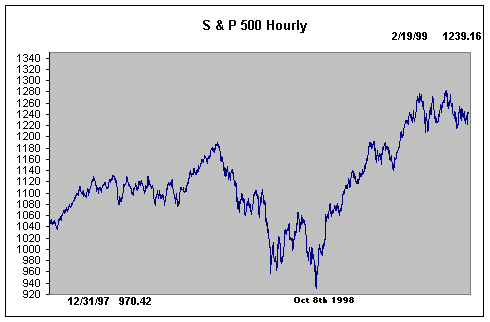
I wouldn’t expect the big tech stocks to drop like a stone however. As Thursday's big advance revealed, weakness still draws buyers. And the bigger the drop, the more aggressive the buyers. If this goes on too long, though, we’ll see a definite top in place and possibly a bigger decline. Since it was the strength in technology stocks that carried the market up from the lows on October 8th 1998, it will probably be those stocks that bring it lower. If those stocks are now faltering, the implications for the overall market, to state the obvious, are less than great.
The coming week will probably be just as volatile as this last one but I don’t expect the market to go down very much or move much higher. The reason being that it’s an expiration week. If a big decline does start it will probably be in the following week but we’ll wait until we get to that juncture!
Technically
The bull/bear indicator is now at its highest level since January of 1987 and continues to go up. It was surprising to see bulls increase this week considering the spill that the Nasdaq took the prior week. It is important to note how many bears there are, as they will give the final outright sell signal. In 1987 there was also low 20’s levels from the bears.
Both the Mclellan Oscillator and the summation index have moved into an oversold condition although the summation index could move increasingly into negative territory before the S&P 500 begins to move higher.
The 5 and 10 day Arms indexes are remaining in oversold territory even with the sharp move higher on Thursday. The sell off on Friday also helped. The position of the Arms indexs will help to hold the market steady for the short term. If the 10-day arms indicator continues to move lower we may get a buy signal.
Volatility is still indicating that the market’s recent sell off will not be that strong. We are hovering around the 30.00 level which indicates a mixed feeling on the market although if it continues to hold around this level or move even lower, the market could be setting up for a sharp sell off.
On Thursday, the S&P 500 closed just under the 61.8% retracement level at 1256, but with the way the futures closed, it could gap above this level. In fact, looking at history, the day following an initial surge has opened up but closed down or flat. This is what happened today. With Monday being a holiday next week there are only 4 days until expiration. The market is likely to bounce around during expiration week with a slight upward tilt. Although the sell off on Friday was mostly due to the sell off in bonds they are now oversold so we should see any bond rally help the market to move higher.
Mclellan Oscillator: -130 -100 oversold +100 overboughtFive day arms: 1.02 and below, overbought 1.00 and
above, oversold
Ten day arms: .96 .80 and below, overbought 1.00 and above, oversold
Bulls: 61.2 previous week 60.0 50%
plus overbought/bearish
Bears: 25.9 previous week 26.7 50% plus oversold /bullish
Five day Qvix: 30.78
Economic Effects
Tuesday
The productivity of U.S. workers grew at the fastest rate in nearly three years in the final quarter of last year, showing the U.S. economy is in great shape as it heads toward its ninth year of expansion. According to the Labor Department, productivity, a measure of output per worker hour, climbed an annualized 3.7% for workers outside the farm sector, the biggest gain since a 4.2% increase in the first quarter of 1996. Productivity grew 2.5% in the third quarter, a downward revision from the previously reported gain of 3.0%. The fourth-quarter performance helped make 1998 one of the best years of the decade for productivity growth.
This shows that there's good reason for inflation to be well contained and that the Federal Reserve doesn't have to worry about inflation right now. Productivity is crucial to sustained, non-inflationary economic growth. When workers can produce more goods and services per hour, companies can grant them pay increases without incurring higher costs, or cutting into their profit margins. The efficiency of the work force has become a particularly important issue over the past few years, as unemployment has steadily fallen and companies have had to scramble to find new workers. Some economists have worried about the possibility of wage inflation that could increase price pressures in other areas of the economy.
However, productivity rises, fueled by investment in computers and other laborsaving technology, have kept labor costs in check. This has contributed to the staying power of the current economic growth period, which is already the longest peacetime expansion on record and will enter its ninth year in April.
The report on fourth-quarter productivity was close to
expectations. Economists had expected a 3.9% increase. Unit-labor costs, a closely watched
gauge of wage inflation, fell 0.2%. Overall, productivity in 1998 recorded a 2.2% rise,
almost double the 1.2% increase of 1997, and close to the 2.4% gain of 1996.
Fourth-quarter productivity surged as the gross domestic product of the overall economy
boomed at a rate of 5.6%. Productivity wasn't a surprise given the recent strong GDP
report. Productivity is typically strong when the economy is robust.
The pace of spending at retail stores slowed modestly in January, growing just 0.2% to a seasonally adjusted $202.7 billion. It was the smallest gain in retail sales since August's 0.1% gain. The increase matched the expectations.
Excluding the sometimes-volatile auto sector, sales rose 0.2%, a bit below the 0.5% expected. December's increase in sales was revised to a 1% gain from the 0.9% previously reported. November's sales were also revised up 0.1% points. The slowdown in sales could just be a pause in the relentless consumer spending that has been the main engine of global economic growth in the past 18 months. Or it could signal that consumers are finally cutting back on their purchases, especially of the big-ticket items that have become so affordable.
January's sales gains were led by nondurable goods which rose 0.3% to $119.4 billion compared to the 0.2% gain in durable goods to $82.3 billion. In nondurables, sales at general merchandise stores rose 1.5% (the biggest gain since February 1998) and sales at apparel stores rose 1%, a confirmation of the stellar results reported by most chain stores.
A drop in initial jobless claims to an 18-month low in the latest week shows that the economy is still moving along at a robust pace with a very tight labor market. The Labor Department said initial state jobless claims benefits fell to 281,000 in the week ended February 6, down from a revised 294,000 in the prior week. Jobless claims were at their lowest level since hitting 276,000 in the July 26, 1997 week, and came well below the 302,000 forecast. Claims are strong evidence that the economy continues to move along strongly. The data came just after the release of a much larger than expected 245,000 gain in nonfarm payrolls and a very low 4.3% unemployment rate in January.
Total inventories held by retailers, wholesalers and manufacturers were unchanged in December as business sales shot up at the fastest rate in more than a year. Business inventories held steady at a seasonally adjusted $1.088 trillion in December after rising by 0.4% in November. Sales by all levels of business jumped 1% to $793.55 billion, the strongest rise since 1.1% in September 1997 after a 0.6% November jump.
The figures showed a healthy balance between sales and stocks of goods on hand. This implies room for higher production rates in coming months to build up stocks of goods to meet booming consumer demand. The monthly inventory-to-sales ratio, which gauges how long it would take to deplete existing inventories at the current sales pace, dipped to 1.37 months' worth in December from 1.38 months' in November. This was the lowest ratio since a matching 1.37 months' worth in September, 1997. Economists had anticipated that December inventories would decline by 0.1% instead of remaining unchanged.
The University of Michigan's preliminary consumer sentiment index for February rose to 107.4 from a final reading of 103.9 in January, according to sources. The current conditions component fell to 115.2 from a final reading of 116.8 in January. The consumer expectations index jumped to 102.4 versus 95.7 in January. These numbers were not surprising considering the recent strong reports.
Next Week’s Economic Statistics
President’s day gives us a holiday on Monday, ironically good timing since President Clinton's impeachment case is now finished. On Wednesday we get Housing Starts, Industrial production and Import Export Prices. The only number of any significance for the market will probably be the industrial production number and even that won’t be significant unless there is a surprise in the number. On Thursday there is Jobless Claims, Producer Price Index. Last month these numbers came in surprisingly higher. Many analysts believe that commodity prices have bottomed so this number could move the market if it is strong. On Friday we get International Trade numbers and the Consumer Price Index. Once again, the CPI number could move the market. Inflation has been very quiet for the past few years so it would be surprising to see any strength in the CPI. If we do, it could shake the market.
MARKET CLOSES
Index |
Last Week |
This Week |
Change |
Percent |
Dow Jones |
9304.24 |
9274.89 |
-29.35 |
0.3 |
S & P 500 |
1239.40 |
1230.14 |
-9.26 |
0.7 |
S & P 500 Futures Dec. |
1243.00 |
1238.50 |
-4.50 |
0.3 |
S & P 100 |
617.67 |
615.33 |
-2.34 |
0.4 |
Nasdaq |
2373.64 |
2321.94 |
-51.70 |
2.2 |
Russell 2000 |
412.72 |
398.24 |
-14.48 |
3.5 |
30 Year bond |
5.34% |
5.42% |
Program Trades
As we move into expiration this week, all trades are still looking very good. Our Long and Ultra trades remain at a high 95% probability of successfully seeing all of the options expire worthless. The only trade under any pressure is the Short 1220/1215 S&P 500 put trade. We are only seeing a 76% probability rating but that may change after Tuesday’s close.
It was a great week for placing another Short trade for Outright Sells on the February 1200 cash and futures puts. The market moved perfectly for us to fill these trades and then get out of them on Friday. We still have the spreads on them and they are looking good for expiration next Friday. We sold the Futures Outright sell on the 1200 Feb. Puts for an average price of $10.75 and the Cash Outright Sell saw an average price of $11.25. After the big run up on Thursday we said to lower stops to $5.00 or get out and everyone decided to get out with average buybacks of $3.00 for futures and $3.50 for the cash trade giving us a great profit in only a couple of days.
For spreads we saw the Futures average price for the 1200 Feb. S&P 500 option sold at $8.00 and the 1190 Feb. S&P 500 option bought at $7.00 for an average credit of $1.00. The cash 1200 S&P 500 Feb. option saw an average sold price of $8.25 and the 1190 S&P 500 February bought option for $7.25 giving the average credit a $1.00 value.
Current Trades Cash
Average Entry price |
Bid |
ask |
last |
|
S&P 500 Cash Trades: |
||||
Sold 1200 Put $8.50 |
Outright Sell $11.25 |
4.50 |
5.25 |
5.75 |
Bought back $3.50 giving a 4% profit |
||||
1200 sold SPX Put $8.25 |
Short trade |
4.50 |
5.25 |
5.75 |
1190 bought SPX Put $7.25 |
$1.00 credit spread |
3.63 |
4.38 |
4.38 |
1100 sold SPX Put $8.50 |
Outright sell $8.50 |
.38 |
.50 |
.38 |
Stop at $15.00 |
||||
1185 sold SPX Put $20.00 |
Long Put Trade |
3.00 |
3.75 |
1.50 |
1180 bought SPX Put $19.00 |
$1.00 credit spread |
2.50 |
3.00 |
3.00 |
1100 sold SPX Put $9.75 |
Ultra Put Trade |
.38 |
.50 |
.38 |
1075 bought SPX Put $7.00 |
$2.75 credit spread |
.18 |
.38 |
.18 |
1220 sold SPX Put $25.50 |
Short trade |
8.63 |
9.63 |
9.50 |
1215 bought SPX Put $23.50 |
$2.00 credit spread |
7.25 |
8.25 |
9.25 |
S&P 100 Trades: |
||||
585 sold OEX Put $8.50 |
Long trade |
1.25 |
1.32 |
1.25 |
580 bought OEX Put $7.13 |
$1.38 credit spread |
.88 |
1.00 |
1.00 |
560 sold OEX Put $5.25 |
Ultra trade |
.38 |
.50 |
.44 |
555 bought OEX Put $4.63 |
credit spread $.63 |
.32 |
.38 |
.38 |
650 sold OEX Call $7.00 |
Long trade |
.25 |
.32 |
.32 |
655 bought OEX Put $5.38 |
credit spread $1.63. |
.13 |
.18 |
.18 |
670 sold OEX Call $2.50 |
Ultra trade |
.06 |
.13 |
.06 |
680 bought OEX Put $1.25 |
credit spread $1.25 |
0 |
.06 |
.06 |
S&P 500 Options Feb. Futures Trades |
Low |
High |
Close |
|
Sold 1200 Put $8.50 |
Outright Sell $10.75 |
8.00 |
2.00 |
3.60 |
1200 sold Put $8.00 |
Short trade |
8.00 |
2.00 |
3.60 |
1190 bought Put $7.00 |
$1.00 credit spread |
4.00 |
2.00 |
3.60 |
Bought back $3.00 giving a 13% profit |
||||
Sold 1100 Put $8.50 |
Outright Sell $8.50 |
.50 |
.20 |
.35 |
Stop at $15.00 |
||||
Sold 1350 Calls $2.00 |
Ultra Trade |
.10 |
.10 |
N/t |
Bought 1360 Calls $1.00 |
$1.00 Credit |
N/t |
N/t |
N/t |
Sold 1185 Puts $13.50 |
Long Trade |
N/t |
N/t |
3.10 |
Bought 1180 Calls $12.00 |
$1.50 Credit |
4.50 |
1.20 |
2.70 |
Sold 1100 Puts $8.00 |
Ultra Trade |
.50 |
.20 |
.35 |
Bought 1090 Puts $6.50 |
$1.50 |
.40 |
.20 |
.25 |
Copyright © 1998. All rights reserved. The information contained in the AGORA OUTLOOK NEWSLETTER is based upon data that is believed to be accurate, but is not guaranteed, and subject to change without notice. All projections, forecasts, opinions, and track records cannot be guaranteed to equal our past performance. Persons reading this newsletter are responsible for their actions. Officers and employees of this publication may at times have a position in the securities mentioned, or related services.
Agora Outlook
Publisher Ken Davidson
Fax 250-860-2051
e-mail davidson@silk.net
www.agoraoutlook.com
Davidson’s View
Technology stocks got hit pretty hard last week, while many depressed manufacturing and energy stocks advanced in another volatile stretch of trading. The market seems to be correcting by sector as it is mostly grinding sideways instead of moving sharply lower. Traders seem to be waiting for that little bit of good news to push the market higher.The Dow held up better than the Nasdaq but the Dow Jones index is still lagging behind the Nasdaq so far this year. The Dow is up 1.3% in 1999, way behind the Nasdaq's 8.3% increase. The S&P 500 was off 3.1% last week, cutting its year to date gain to 0.8%.
This week AMG data reported that about $2.9 billion was withdrawn from mutual funds. The past few weeks has revealed that in-flows have seemed to plateau. I continue to believe that most of the money is in the market so it will take something else to move the market. Without the momentum of the money coming in, one must look at fundamentals.
With the 30-year bond backing up to 5.34% this week it indicates that the S&P 500 is about 15% overvalued with current earnings estimates and even more overvalued if earnings start to back up. It suggests that the market will have a tough time moving forward unless bonds rally. But, poor earnings have not been the chief cause of a lower stock market in the past century. So what if interest rates continue to back up?
Rising interest rates and inflation have triggered bear markets in the past. Data suggests that the market has largely shrugged off earnings drops as temporary spills but has reacted negatively to changes in inflation and interest rates. Interest rates are indeed important and their ability to influence the stock market was shown last year when the Fed, faced with a free falling stock market, dropped interest rates to ensure that the U.S would not be dragged down by the economic crisis overseas. The cuts did work and also sent the market to record highs. This past week, traders waited patiently to see if the Federal Reserve was going to change interest rates and monetary policy. They decided to leave keep rates unchanged, even though the economy expanded at the fastest pace in two and a half years, which heightens the risk of inflation.
The last time interest rates had any type of an impact on stocks was in 1994, when the Fed doubled rates from 3% to 5.75% in a preemptive strike against what it saw as the threat of inflation. This sent stocks plummeting. Inflation never did show up and the Fed never lowered rates back to their old levels. They have been maintaining them until they lowered them this past spring because of the economic worries.
As long as there is still a chance that the economy may slow down, it should prevent the Fed from raising or lowering interest rates. We also have to watch the Year 2000 computer bug since it could cause problems. With interest rates at current levels, we’re not likely to see much progress in either direction in the near future. However, if rates start to go down, the Dow could see 10,000! Or, it could see 8,000-8,500 if they back up to 5.50%. Most likely, the market will continue its sideways action, going nowhere too fast so our type of trading is going to be perfect for this scenario.
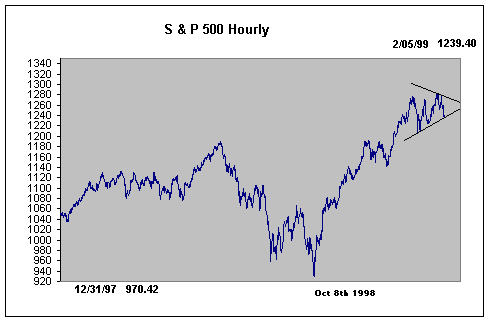
TechnicallyWe have seen the daily S&P 500 chart forming a sideways triangle formation this past week. This usually indicates a breakout to the upside. On Thursday and Friday, the S&P 500 touched the bottom of the uptrend triangle line that started on October 8th. There is still a possibility of a breakout higher but with the index touching the bottom of the lower trendline it makes us cautious as we could still see a break to the downside. The formation will end around Feb. 10th so we should have a better indication then of what may happen.
The Mclellan Oscillator is hovering around the oversold area but the summation index continues to move lower indicating there may be more downside movement left in the market.
The 5-day Arms indicator has pushed into oversold territory while the 10-day Arms indicator is now near overbought levels. For the time being this indicates a neutral reading, but if the market rises too fast without the broader market following, we could move into an extremely overbought situation.
The Bull/Bear indicator has gotten worse on the bear side this week as bears are approaching the low 20’s area making it possible to see an outright sell for the market fast approaching. We are dealing with the same numbers that were coming out in 1987. With the market spill this week, hopefully bulls will retreat a bit. (This is a contrary indicator.)
With the whipsaws that occurred this week it was surprising to see little change in volatility. That could be bad in the end as were still not seeing enough fear out there as people buy puts. The last 4 equity call/put ratios were at or very close to topping values. Multiple days, 4 or more, very often lead to declines. With the closing tick on Wednesday being a high +894 we may see further corrective action but Thursday and Friday may have been enough to remedy the situation.
Stochastics are remaining near overbought levels and momentum is stalling both daily and weekly. With half of the indicators in oversold territory and the other half still overbought, the most one should expect for the downside I think is a grinding sideways motion.
Mclellan Oscillator: -98 -100 oversold +100
overbought
Summation Index: +30
Five day arms: .79
.80 and
below, overbought 1.00 and above, oversold
Ten day arms: .88
.80 and
below, overbought 1.00 and above, oversold
Bulls: 60.0 previous week 60.7
50% plus overbought/bearish
Bears: 26.7 previous week 28.2
50%
plus oversold /bullish
Correction: 13.3 previous week 11.1
Five day Qvix: 29.25
Economic EffectsMonday
According to the National Association of Purchasing Management, overall manufacturing activity jumped to 49.5 in January from 45.3 in December, putting the index just below 50, the threshold indicating that industrial output is expanding. The index has been below 50 for the past eight months. The survey showed that new orders for factory goods made a strong comeback in January, rising to 51.3 from 46.4 in December, while production jumped to 53.1 from 46.8. Those readings indicate that at least some parts of the manufacturing sector are back on their feet.
Though overall export orders didn't grow last month, five industries an increase: wood products, paper, printing and publishing, food, and fabricated metals. When truck orders increase, that is a sign of market confidence.
Bonds didn’t like the strength of the report as it indicated a very slight chance that the Federal Reserve would lower rates at their upcoming meeting this week. Stocks also lost much of their gains on the news, as it appears manufacturing is picking up once again.
The public ended 1998 with a spending spree, giving the economy momentum as it entered the New Year. Still, economists wonder how long consumers can sustain the pace. Incomes grew strongly, but consumers spent every bit of the increase, and more.
Personal income jumped 0.5% in December, the best gain in 10 months. Spending surged an even stronger 0.8%, the most since May. Consumers are ready and willing to spend. Strong stock market gains, low interest rates and strong wage gains are supporting consumer spending, which accounts for 2/3rds of the nation's economic activity.
The problem is that people spent more than they earned in December. Their personal savings rate went negative to minus 0.1% for the second time last year. The measure of savings as a percentage of after-tax income has fluctuated around zero for four months. Spending was bolstered in December by two factors, a surge in holiday shopping and very strong auto sales. For the year, Americans saved just 0.5% of their income, the least since 1933, compared to 2.1%in 1997 and 2.9% in 1996. But, the figure is not as grim as it appears. It reflects the fact that prosperous people spent a portion of their stock market gains and tapped their home equity during a wave of refinancing spurred by the lowest mortgage rates since the 1960s.
Construction spending surged 1.7% in December, the largest gain in six months helped by unseasonably mild weather for most of the month. For the year, it rose 6.3% percent to $657 billion, following a 5.9% rise in 1997. The categories with the biggest gains included single-family homes, 13.9%; apartments, 8%; offices, 16.4%; and hotels and motels, 12.6%. December marked the seventh consecutive month that construction spending rose, while total construction reached an annual rate of $688.5 billion, adjusted for seasonal factors, but not for inflation.
Tuesday
U.S. manufacturers ended 1998 with a surge in orders, but the rest of the year was among the most lackluster of the 1990’s.
Factory orders jumped 2.3% in December, their biggest gain since November 1997, to a seasonally adjusted $343.5 billion after a meager 0.4% gain in November. The increase, which reflected strength in all major industrial sectors except primary metals, far surpassed the 0.9% gain expected by economists in a Reuters survey.
For all 1998, orders for manufactured goods rose just 2.1% to $4.03 trillion after a 5.4% rise in 1997. Last year's increase was the smallest since recession year 1991, when orders actually declined 2.3%. Orders for items meant to last three years or more, such as cars and refrigerators, surged 3.1% in December after a 0.4% rise in the prior month. Demand for nondurable goods rose 1.2% after a 0.4% gain in November. Orders for transportation equipment rose 1.8% in December, while industrial machinery orders surged 7.4% and electrical equipment orders rose 3.6%. Primary metal orders fell 1.3% in December.
The number of people filing new claims for state jobless benefits fell for the third consecutive week, hitting the lowest level since mid-December. 292,000 people filed new claims in the week ended Jan. 30, the lowest level since 289,000 claims were filed in the Dec. 19, 1998 week, and down from 301,000 in the previous week. It was well below economists' expectations of a rise to 311,000. The four-week moving average, considered a more accurate gauge of conditions in the labor market, fell to 317,250 in the week ended Jan. 30 from 333,250 the previous week. In the week ended Jan. 23, the latest week for which state-by-state figures are available, labor said 29 states reported a decrease in claims exceeding 1,000, led by North Carolina with 22,458 fewer claims.
U.S. companies added 245,000 jobs to their payrolls in January, another sign that the economy has started the year off with almost as much momentum as it displayed at the end of 1998, analysts said on Friday. The report, which also showed the unemployment rate holding steady at this business cycle's low of 4.3%, further dispelled speculation that the global financial crisis is taking its toll on the U.S. expansion.
The Labor Department reported non-farm payrolls rose 245,000 in January, after being up a revised 298,000 in December. The Department had first reported December payrolls at up 378,000. The report immediately put pressure on the 30-year bond and it fell more than a half-point as its yield rose to 5.33% versus 5.29% yesterday. This is the fifth down day in a row for bonds. At first, the news helped to lift the stock market since growth supports earnings but when traders realized that there was even less chance of a rate cut by the Fed, the market fell.
The report did not show any acceleration in wage inflation. Average hourly earnings rose six cents in January to $13.04, in line with the roughly 4.0% average gain seen in several gauges of labor compensations.
Current evidence, indeed that of recent years, is that the relationship between tight labor markets and wage and price increases is clearly a far more complex process than is captured by the more simplistic economic theories. Still, the bond market fell under the healthy job report, way above the analysts' consensus in a Reuter’s poll that had called for a 135,000 payrolls gain in January.
The employment report also delivered tentative evidence that U.S. manufacturing may be weathering the global economic crisis better than expected. Manufacturing lost only 13,000 jobs in January and 16,000 in December, much smaller than the 60,000 and 61,000 drops seen in November and October, respectively.
Next Week’s Economic StatisticsOn Tuesday we receive Productivity and Costs. This is always an important number as it reveals if workers are producing enough to cover costs and wages. If costs are rising and productivity falling it is not normally taken well by the market.
Thursday has Jobless Claims and Retail Sales. Neither of these indicators are likely be taken seriously by the market unless jobless claims continue to fall representing even more strength in the economy.
On Friday we get Business Inventories. This number can reveal if companies are stockpiling goods after the Christmas season for a busy summer or are indicating a coming slowdown. The market does not consider these numbers to be very important. There aren’t any real important indicators out this coming week so we’ll probably see more emphasis on technical trading.
MARKET CLOSES
Index |
Last Week |
This Week |
Change |
Percent |
Dow Jones |
9358.83 |
9304.24 |
-54.59 |
0.5 |
S & P 500 |
1279.26 |
1239.40 |
-39.86 |
3.1 |
S & P 500 Futures Dec. |
1280.62 |
1243.00 |
-37.62 |
2.9 |
S & P 100 |
640.06 |
617.67 |
-22.39 |
3.5 |
Nasdaq |
2504.68 |
2373.64 |
-131.04 |
5.2 |
Russell 2000 |
427.33 |
412.72 |
-14.61 |
3.4 |
30 Year bond |
5.09% |
5.34% |
Program Trades
So far, all of our trades, both cash and futures are looking great. More people got into the OEX call trades this week as the S&P 500 call options are still few and far between. It has been a few years since we have seen so few options being offered. Even with the sell off this week we are still getting about a 95% probability of success for all of the put trades except the Short 1220/1215 put trade which slipped a bit to a 84% probability. That is still high even for a Short trade so we’re not concerned. The 1100 sold puts are now hitting a 98% probability of success.
Current Trades CashAverage Entry price |
Bid |
ask |
last |
|
S&P 500 Cash Trades: |
||||
1100 sold SPX Put $8.50 |
Outright sell $8.50 |
1.33 |
1.50 |
1.75 |
Stop at $15.00 |
||||
1185 sold SPX Put $20.00 |
Long Put Trade |
8.63 |
9.63 |
10.00 |
1180 bought SPX Put $19.00 |
$1.00 credit spread |
7.50 |
8.50 |
10.00 |
1100 sold SPX Put $9.75 |
Ultra Put Trade |
1.33 |
1.50 |
1.75 |
1075 bought SPX Put $7.00 |
$2.75 credit spread |
1.00 |
1.50 |
1.32 |
1220 sold SPX Put $25.50 |
Short trade |
16.50 |
17.88 |
17.00 |
1215 bought SPX Put $23.50 |
$2.00 credit spread |
14.88 |
16.25 |
16.33 |
S&P 100 Trades: |
||||
585 sold OEX Put $8.50 |
Long trade |
4.00 |
4.25 |
3.88 |
580 bought OEX Put $7.13 |
$1.38 credit spread |
3.33 |
3.63 |
3.33 |
560 sold OEX Put $5.25 |
Ultra trade |
1.44 |
1.25 |
1.50 |
555 bought OEX Put $4.63 |
credit spread $.63 |
1.18 |
1.44 |
1.13 |
650 sold OEX Call $7.00 |
Long trade |
1.50 |
1.63 |
1.50 |
655 bought OEX Put $5.38 |
credit spread $1.63. |
1.00 |
1.06 |
1.13 |
670 sold OEX Call $2.50 |
Ultra trade |
.25 |
.33 |
.33 |
680 bought OEX Put $1.25 |
credit spread $1.25 |
.06 |
.13 |
.13 |
S&P 500 Options Futures Trades |
Low |
High |
Close |
|
Sold 1100 Put $8.50 |
Outright Sell $8.50 |
1.40 |
2.00 |
1.40 |
Stop at $15.00 |
||||
Sold 1350 Calls $2.00 |
Ultra Trade |
.25 |
.60 |
.25 |
Bought 1360 Calls $1.00 |
$1.00 Credit |
.20 |
.30 |
.20 |
Sold 1185 Puts $13.50 |
Long Trade |
N/a |
N/a |
8.20 |
Bought 1180 Calls $12.00 |
$1.50 Credit |
7.00 |
9.10 |
7.40 |
Sold 1100 Puts $8.00 |
Ultra Trade |
1.40 |
2.00 |
1.40 |
Bought 1090 Puts $6.50 |
$1.50 |
1.40 |
4.50 |
1.40 |
Copyright © 1998. All rights reserved. The information contained in the AGORA OUTLOOK NEWSLETTER is based upon data that is believed to be accurate, but is not guaranteed, and subject to change without notice. All projections, forecasts, opinions, and track records cannot be guaranteed to equal our past performance. Persons reading this newsletter are responsible for their actions. Officers and employees of this publication may at times have a position in the securities mentioned, or related services.
Agora Outlook
Publisher Ken Davidson
Fax 250-860-2051
e-mail davidson@silk.net
www.agoraoutlook.com
February Expiration January 29th 1998
Davidson’s View
This past week was very distressing as our network blew up along with our back ups. We still don’t know what caused it. The good outcome however, was that we established a new system and a back up of the back up system just in case something else happens like Y2k! Anyhow, we thank you for your patience, as we’re a bit slow to getting back to e-mails.
The market sure flipped around this week. Up one day and down the next. It seemed to find its direction finally on Friday when the Commerce Department reported Gross Domestic Product rising at an annual rate of 5.6% in the quarter. This is fabulous news for corporate earnings and the economy. This number alone could help to lift stocks in the near future. (Please read Fridays "Economic Effects" for more details.)
There is a famous stock market theory that says "as January goes, so goes the year.'' If it holds water, the market could be in for another up year. The January Barometer has had only three errors in 48 years. (A 94% average) Dating to 1950, the stock market has reflected the direction of the S&P's composite index's rise or fall in January. Friday, the last trading day in January, saw the S&P 500 close at 1,279.64 after finishing 1998 at 1,229.29. This was a gain of +50.35 points or 4.1%, meaning the market should go higher this year.
However, the market has a lot to contend with this year once again so the January Barometer could be irrelevant. The market is now struggling with Brazil's currency-spurred recession, which could quickly spread to the rest of Latin America, a big trade partner with the U.S. Brazil has the world's 8th largest economy, and what affects them could jolt the earnings of American companies, possibly as early as the first quarter of this year even though the GDP report looks like earnings estimates could be raised. There are other problems that could also rock the market. By mid-year, investors will focus on the Year 2000 computer problem and they'll ask the question: Will Y2K mean the U.S. economy will slide into recession? Some experts believe the Y2K problem, or Millennium bug, a potentially serious flaw in many existing computers whose outdated software prevents them from distinguishing between the years 2000 and 1900, could cause tremendous disruption to the economy.
Another detriment may be the CRB index. It has been falling the past few years and seems to be putting in a bottom. Inflation may be nearly dead, but it could come back to cause problems in the stock market this year. If the price of oil and other commodities start to rise, the Federal Reserve could respond to inflation by raising short-term interest rates. This would kill off the liquidity that has driven this stock market higher.
So why is the market going higher now and not discounting the possible problems? Some people doubt that Brazil's economic turmoil is the start of something big enough to drag down Latin America. There is a consensus that the 18-month-old Asia crisis is over and the region's economies will soon start to climb off the mat. Also, the U.S. market has been able to neutralize the fear that China could ignite the next devastating chain of currency devaluations in the Pacific Rim.
Overall, the market seems disconnected from the real world. The reason being that the flood of money into 401K retirement plans has created a liquidity-driven market out of proportion to economic growth and corporate earnings. On Friday, AMG data reported that inflows were only about a billion dollars compared to December net inflows of about $3.5 billion. This is surprisingly low and indicates that we may be running out of money coming into the market. This could be why we have seen the market halt it’s feverish pace the past couple of weeks. I would expect to see the market continue to rise but with that more volatility on both the upside and downside as we work through the problems that I noted above.
Technically
Short term, the market is solidly overbought but longer term, it is neutral. Right now, the euphoria seems to be about as lopsided as it can get. Put/call numbers have been quite low meaning that more people are buying calls on every dip than they are buying protective puts. Normally, this sees swift declines when the trend changes. We’ll have to keep watching it.
The Mclellan Oscillator and summation index are both revealing the same thing. They are giving oversold readings without giving any indication that the market is going to zoom ahead in the near future. One of the best indicators to look at now is the 5 day arms index since it shows that the market is quite overbought with a reading of .79. This should at least hold back the market and maybe even cause a slight decline.
Many analysts are worried about the current bull/bear indicator that’s been flashing huge warning signs. It has swung strongly to the bearish side as bulls have now moved to 60.7%, the highest reading since August of 1987. You know what happened a month later! The only difference is that there were only about 20% bears back then. This should at least slow it down to the upside for now.
With technicals being so mixed we don’t expect the market to rise or fall very much in the coming week.
Mclellan Oscillator: -49 -100 oversold +100 overbought
Summation Index: +396
Five day arms: .79 and below, overbought 1.00 and above, oversold
Ten day arms: .88 .80 and below, overbought 1.00 and above, oversold
Bulls: 60.7 previous week 60.3 50% plus overbought/bearish
Bears: 28.2 previous week 28.9 50% plus oversold /bullish
Correction: 11.1 previous week 10.8
Five day Qvix: 29.40
Economic Effects
U.S. labor costs slowed last year as wages and salaries grew at the slowest rate in two while orders for costly manufactured goods kept rising. The reports showed a nearly eight-year-long U.S. expansion rolled into 1999 with solid momentum, with very little price and wage pressures despite a booming job market. Analysts said it also meant interest rates likely would remain unchanged when Federal Reserve policymakers meet next week since the economy remained vibrant.
The Employment Cost Index (ECI), rose 0.7% in the fourth quarter after a 1% increase in the preceding third quarter. The Fed meets next Tuesday and Wednesday to consider interest-rate strategy. With price and wage rises dampened, inflation is nearly a dead issue though policymakers recently have been sounding alarms about potential over-valuations in financial markets. Fed Chairman Alan Greenspan, in testimony before Congress Thursday, said there was a measure of ``hype and craziness'' in recent soaring prices for some Internet stocks that made the market look like a lottery.
Bond prices initially fell after release of the economic data that implied steady interest-rate policy. But by mid-afternoon, prices for the 30-year bond had gained as the yield, which moves in the opposite direction, fell to 5.10% from Wednesday's close of 5.13%. The Dow also rallied as a steadily expanding economy raised chances for growing corporate profits.
The ECI report said that, for all of 1998, wage costs posted a 3.4%t gain, up from 1997's 3.3% gain for the largest year-over-year increase since a 3.5% gain five years earlier in 1993. Analysts said it might foreshadow a modest pickup in wage pressures, though in last year's fourth quarter both wage and salary costs as well as costs of providing benefits such as insurance, pensions, health care and vacation pay eased in the final three months last year from third-quarter levels. The overall trend suggests we're likely to see some moderate increases in wage pressures most of through 1999. We'll begin to see some higher numbers, but not dramatically worse numbers.
According to the report, wage and salary increases slowed to 0.7% in the fourth quarter from a robust 1.2% in the third quarter, the lowest quarterly rise in two years since a matching 0.7% gain during the fourth quarter of 1996. Benefit costs rose 0.6% in the fourth quarter after a 0.8% third-quarter increase.
New jobless claims for unemployment dropped for a second week in a row last week, falling sharply by 15,000 to 301,000. Tumbling claims reflect strong hiring that has led some employers to complain they were unable to find anyone to hire. The less volatile four-week moving average of first-time claims, which is more widely used by economists than the weekly claims as a job market gauge, fell to 333,250 in the latest week from a revised 351,000. On Feb. 5, the Labor Department will release its employment report for January, which will give a broad look at labor market conditions throughout the economy. Economists predict January's unemployment rate will rise to 4.4% from 4.3% in December, with 133,000 new jobs created outside the farm sector.
Orders for durable goods rose 1.9% during December to a seasonally adjusted $192.7 billion. That followed a downwardly revised 0.3% gain in November which was previously reported as a 0.8% rise. During all of 1998, new orders for durable goods rose by 3.5% to $2.3 trillion, from $2.2 trillion in 1997 on a non-seasonally adjusted basis. That was the smallest annual gain since 1991, when the economy was coming out of the last recession.
Greenspan repeated to Congress that the U.S. economy, which will complete eight years of unbroken expansion in March, couldn’t forever remain unaffected by the drag from enfeebled economies in other parts of the world. November was the sixth rise in the last seven months. For the year, new orders of durable goods were up by 3.5% over 1997 on a non-seasonally adjusted basis, the department said.
Durable goods include high-cost items such as cars and appliances that are meant to
last three years or more. The December rise in new orders was higher than the 1.2-% rise
analysts had expected and reflected strong demand for industrial goods.
MARKET CLOSES
Index |
Last Week |
This Week |
Change |
Percent |
Dow Jones |
9130.71 |
9358.83 |
+228.12 |
2.5 |
S & P 500 |
1225.56 |
1279.26 |
+53.64 |
4.4 |
S & P 500 Futures Dec. |
1232.55 |
1280.62 |
+48.07 |
3.9 |
S & P 100 |
610.77 |
640.06 |
+29.29 |
4.8 |
Nasdaq |
2338.82 |
2504.68 |
+165.86 |
7.1 |
Russell 2000 |
422.44 |
427.33 |
+4.89 |
1.2 |
30 Year bond |
5.08% |
5.09% |
Program Trades
So far all of our sold trades, both cash and futures are looking good and as expected the market has turned higher after we placed them. We should be able to get into our call trades this week, which will complete this month’s trade. Overall we are getting about a 95% probability of success for all of the put trades except the Short 1220/1215 put trade which is only showing a 86% probability. That is still high even for a Short trade so were not concerned about it.
Current Trades Cash
Average Entry price |
Bid |
ask |
last |
|
S&P 500 Cash Trades: |
||||
1100 sold SPX Put $8.50 |
Outright sell $8.50 |
1.32 | 1.88 | 1.25 |
Stop at $15.00 |
||||
1185 sold SPX Put $20.00 |
Long Put Trade |
6.00 | 7.00 | 5.50 |
1180 bought SPX Put $19.00 |
$1.00 credit spread |
5.88 | 6.88 | 5.50 |
1100 sold SPX Put $9.75 |
Ultra Put Trade |
1.32 | 1.88 | 1.25 |
1075 bought SPX Put $7.00 |
$2.75 credit spread |
.63 | 1.13 | 1.00 |
1220 sold SPX Put $25.50 |
Short trade |
10.75 | 12.00 | 8.88 |
1215 bought SPX Put $23.50 |
$2.00 credit spread |
9.88 | 10.88 | 7.50 |
S&P 100 Trades: |
||||
585 sold OEX Put $8.50 |
Long trade |
2.50 | 2.75 | 2.25 |
580 bought OEX Put $7.13 |
$1.38 credit spread |
2.32 | 2.50 | 2.25 |
560 sold OEX Put $5.25 |
Ultra trade |
1.06 | 1.18 | 1.13 |
555 bought OEX Put $4.63 |
credit spread $.63 |
.93 | 1.00 | 1.00 |
650 sold OEX Call $7.00 |
Long trade |
5.88 | 6.00 | 6.00 |
655 bought OEX Put $5.38 |
credit spread $1.63. |
4.32 | 4.62 | 4.50 |
670 sold OEX Call $2.50 |
Ultra trade |
1.25 | 1.32 | 1.25 |
680 bought OEX Put $1.25 |
credit spread $1.25 |
.50 | .63 | .56 |
S&P 500 Options Futures Trades |
Low |
High |
Close |
|
Sold 1100 Put $8.50 |
Outright Sell $8.50 |
.90 | 1.40 | 1.35 |
Stop at $15.00 |
||||
Sold 1185 Puts $13.50 |
Long Trade |
5.30 | 6.10 | 6.10 |
Bought 1180 Calls $12.00 |
$1.50 Credit |
4.00 | 5.60 | 5.60 |
Sold 1100 Puts $8.00 |
Ultra Trade |
.90 | 1.40 | 1.35 |
Bought 1190 Puts $6.50 |
$1.50 |
1.10 | 1.10 | 1.10 |
Copyright © 1998. All rights reserved. The information contained in the AGORA OUTLOOK NEWSLETTER is based upon data that is believed to be accurate, but is not guaranteed, and subject to change without notice. All projections, forecasts, opinions, and track records cannot be guaranteed to equal our past performance. Persons reading this newsletter are responsible for their actions. Officers and employees of this publication may at times have a position in the securities mentioned, or related services.
Short Trades |
Long Trades |
Ultra Trades |
Outright Short Sales |
|||||
| 1999 Current | 17% |
1999 Current | 28% |
1999 Current | 14% |
1999 Current | ||
| 1998 | 66% |
1998 | 43% |
1998 | 79% |
1998 | 71% |
|
| 1997 | 108% |
1997 | 188% |
1997 | 82% |
|||
| 1996 | 163% |
1996 | 169% |
1996 | 99% |
|||
| 1995 | 93% |
1995 | 76% |
|||||
| 1994 | 79% |
1994 | 89% |
|||||
| 1993 | 177% |
1993 | long |
|||||
| 1992 | 112% |
1992 | long |
|||||
| 1991 | 162% |
1991 | long |
|||||
| 1990 | 166% |
1990 | long |
|||||
Futures Trades
Outright Sells & Strangles |
Long Trades |
Ultra Trades |
| 1999 Current | 1999 Current 23% | 1999 Current 20% |
| 1998 130% | 1998 93% | 1998 16% |