 The Commentary
Good day, here you will find the commentary e-mail
that is sent out to subscribers and hedge fund clients daily during the trading
week. Once a week or every second week they are put up here for you to read
to get an idea of what is going out to clients. This is only the commentary
part and does not have any trading information.
Hope you enjoy reading the following commentaries,
have a great day and good trading!
Monday, April 20, 2015 5:20 p.m est.
The market the past weeks has really gone nowhere fast but trade sideways basically since February 1st. For the year the market is still near unchanged and here we are almost 5 months in. Why is the question, but does seem quite obvious as earnings are going to be negative for this quarter while the p/e ratio for the overall market is rising fast. Were also now 7 years into this bull and that is stretched with no more than -5% correction.
Friday saw the market fall over -1% but did have a bit of recovery at the close and of course the world is fine today so it rallied with the Dow seeing highs of +260.00 points, S&P 500 +22.00 points and the Nasdaq +65.00 points. At the close today the Dow was up by +209.00 points to 18,044.00, S&P 500 +19.00 points to 2100.00 S&P 100 +9.00 points to 919.00, and the Nasdaq Composite +63.00 points to 4994.00. Oil has been rallying of late closing up +$.56 to be at the $56.41 level.
So the question is when will we see a bigger correction. That may still be hard because there is so much free money out there and our Fed is still saying even if they do raise rates it will be a very slow process!! The EU is now stimulating and overnight we saw index futures rise after China cut the amount of reserves commercial banks are required to hold by one percentage point, a bigger-than-normal reduction that will free up around $200 billion for lending. All of their stimulus has seen their market rally hard but when you look under the hood you see that Chinese tech stocks are trading over 200x of earnings!! The Nasdaq topped around 156x in 2000. For now though the point is they are NOT fueling a bubble with more leverage, they are only trying to keep it from collapsing at this point. World central banks are backed into a corner and its getting worse every month so it will be interesting to see how they get out of this predicament. For now volatility will continue and this sideways action is likely to continue.....
Wednesday, March 25, 2015 4:50 p.m est.
So far this week the market has had a rough time, being down over -2% already for this week. Today saw the Dow see lows of -290.00 points, S&P 500 -31.00 points and the Nasdaq -120.00 points as biotech stocks got slaughtered. Although, they have had a huge run the past year!!! At the close today the Dow was down by -293.00 points to 17,719.00, S&P 500 -30.00 points to 2061.00 S&P 100 -14.00 points to 902.00, and the Nasdaq Composite -118.00 points to 4876.00. Oil has been rallying of late though and tension in the middle east helped it to rally today, closing up +$1.70 to be at the $49.21 level.
With the market sell off today the market is now negative for the month with only a few trading days left. It is getting oversold quite quickly though as volume on this sell off has been less than the rise. Interestingly, the market really started to fall after the SEC announced that they are approving a plan requiring high speed trading firms to get registered and regulated. This has been a long time coming and will be good in the end but for now will likely just add to the volatility. Nonetheless, it will be interesting to see how the week ends to see if this is just a normal correction or it may be something deeper.....
Saturday, March 21, 2015 2:50 p.m est.
This was a volatile week for the market with the Dow seeing triple digits each way this week and an overall strong gain for the week for the market of +2.5%. After being down -.50% yesterday, today the Dow saw highs of +240.00 points, S&P 500 +25.00 points and the Nasdaq +55.00 points to get closer to that all time intraday high of 5132.52 set back in 2000.
At the close today the Dow was up by +169.00 points to 18,127.00, S&P 500 +19.00 points to 2108.00 S&P 100 +8.00 points to 923.00, and the Nasdaq Composite +34.00 points to 5027.00. Oil closed up +$.96 to be at the $46.57 level.
The market is interesting as it continues to hover around highs it first made in February. This past week everyone eagerly anticipated the Fed’s release of their decision on interest rates on Wednesday and if they’d lose the word “patient” or not! They did but Janet Yellens entire speech after that was about not raising rates in June and very confusing overall!! Not surprising though as they couldn’t keep putting lipstick on a pig like in January. The market loved it of course rallying +1.5%. The problem that it might find making anymore progress higher though is that earnings are slowing down, and although it could be transitory, they are now turning negative and then you got the decline in core inflation, a very powerful signal together of negativity. So not surprising the Fed had to back off, so the market likes it for now. Nevertheless, this rally is rather speculative in the face of economic deterioration and the lack of quantitative easing so I think volatility will persist. In the longer term perhaps the next move for the Fed will be to lower actually and may find itself injecting more liquidity eventually, especially since its now going against the ECB and everyone lowering instead of raising! The Swedish Central Bank just lowered their key rate to negative -.25%! The Fed will need some sort of a sell off or correction first to justify it, so maybe a good one in the fall. Of course then the Fed will try to save 2015 probably by outright delaying the rate hikes so the downside would be limited. For now only time will tell but one thing for sure is volatility is likely to continue!!
Saturday, March 14, 2015 2:10 p.m est.
So the market ended the week on the downside about -1% which made for a three week in a row losing streak while oil made its way back to its lows in February. Inventories remain at record levels and there is talk that the U.S will run out of storage capacity this summer. Its no wonder the market and everything is down though as it was reported today that Economic data in North America overall is at its worst levels since 2009 according to Bloombergs ECO Surprise Index which measures whether data beats or misses forecasts. Yes were seeing lots of employment for Walmart and Home Depot but manufacturing and bigger jobs continue to dwindle while personal income and spending continues to fall and earnings forecasts continue to be lowered. All bad news for the market….
Next week however is an expiration traded week so the computer bots will likely be at work keeping the market in check along with the Fed who will be meeting about what to do about interest rates. They might lose the being “patient” part about economic data so the response in the market could be interesting. Interest rates have been backing up in anticipation of a rate increase this summer but when you see indicators such as the above it makes me think that there could be QE4 on its way to hold the market up lol!!
At the close today the Dow was down by -145.00 points to 17,749.00, S&P 500 -13.00 points to 2053.00 S&P 100 -6.00 points to 901.00, and the Nasdaq Composite -22.00 points to 4872.00. Oil closed below $45 now, -$2.09 to be at the $44.84 level.
Friday, March 6, 2015 2:50 p.m est.
The market ended the week on a sour note even though there was positive economic data out this morning showing a stronger than expected employment report. That may have actually been the problem as bonds sold off strongly indicating that the Fed may now be forced to raise rates in June. It was a slow decline though as it stair stepped its way to a slight bottom in the final hour. The Dow saw lows of -310.00 points, S&P 500 -35.00 points and the Nasdaq up -70.00 points. At the close the Dow was down by -279.00 points to 17,857.00, S&P 500 -55.00 points to 2071.00 S&P 100 -12.00 points to 912.00, and the Nasdaq Composite -55.00 points to 4927.00. Oil meanwhile closed below $50 once again, -$2.20 to be around the $49.55 level indicating that the record supply of inventory may not get any better soon.
So it appears that employment is stronger than believed as it increased +295,000 in February after healthy increases of +239,000 in January and +329,000 in December. January and December were revised down a net -18,000. Market expectations for February were for a +230,000 increase. The unemployment rate fell to 5.5% from 5.7% in January, analysts had forecast 5.6%. The sad part of the report though was that the labor force participation rate edged down marginally to 62.8% from 62.9% in December. The establishment survey indicated that private payrolls increased +288,000 in February after a +237,000 gain the month before. The median forecast was for +225,000. Hourly wages rose 3 cents, or a marginal +0.1%, to $24.78. The average workweek held steady at 34.6 hours, equaling expectations. Overall, the latest employment situation suggests the labor market is gradually gaining strength but most of the gains were in serving and bar-tending, not solid long lasting jobs. However the odds of a June rate increase by the Fed just went up just so they can hold face as they keep claiming to be data dependent.
The funny thing is that even the Fed has admitted the unemployment rate has become a meaningless, anachronistic relic. If you do the calculations it makes you question why the unemployment rate dropped once again, sliding from 5.7% to 5.5%? The reason is that while the number of unemployed people dropped by -274,000, those employed rose by +96,0000 which indicates that the underlying math isn’’t right as the civilian labor force dropped from 157,180 to 157,002 , following the major revisions posted last month, while the people not in the labor force rose by +354,000 in February, rising to a record +92,898,000. Also, people who currently want a job rose to 6,538, matching the all time high number of people not in the labor force. End result: the labor force participation rate dropped once more, declining to only 62.8%, just off the lowest print recorded since 1978!
Also put was that the trade deficit narrowed in January after hitting a two-year high in December. The nation's trade gap narrowed -8.4% to $41.8 billion from revised $45.6 billion in December. Economists had forecast a total deficit of $40.6 billion. In January, overall exports slipped -2.9% to a seasonally adjusted $189.4 billion. Imports decreased 3.9% to $231.2 billion.
Even though were still near new highs I still believe that The January Barometer as I was mentioning before said, that as January goes,,,, so goes the rest of the year in the market and that at the least,,,,volatility will continue to reign. This adage has a decent track record, although it has been rather unreliable as of late with several down January’s not resulting in losses over the following 11 months. But,,,,, as it turns out, adding another data point may help investors distinguish the potential losers from winners following down January’s. After posting a loss of nearly -4% in January, the Dow had rebounded strongly, the first two weeks of February. There have been 13 years prior to this one in which January showed a loss of at least -3% and the first two weeks of February rebounded by at least +1% at some point. The median return from that high point during the first week until the end of February was +1.5% and we were well above that at +5.5%. While these figures may not seem like a big deal, the difference from the average of all February’s and all February-December periods is significant. Consider that the median return for all years during the entire month of February is +0.5%,,, +5.5% is significantly higher. This is especially so considering that the returns are measured from the high point during the first two weeks of February and the market has already rallied a fair amount more during the month. Interestingly though there is a significant change when considering the median return from the 1st of February through the end of the year only being +6.5% then. And given the positive median gains during the rest of the month of February in these occurrences, returns are even that much worse from the end of February into year-end. Of the 13 instances, 7 turned in losses into the end of the year. Considering how we’ve started March it looks like volatility is going to continue.....!!
Tuesday, March 3, 2015 2:50 p.m est.
So here we are at Nasdaq 5000. Its only been 15-years to get back to this level and the question was how long would it stay above this level. Yesterday the Dow saw highs of +170.00 points, S&P 500 +14.00 points and the Nasdaq up +60.00 points. At the close the Dow was up by +155.00 points to 18289.00, S&P 500 +13.00 points to 2117.00 S&P 100 +6.00 points to 932.00, and the Nasdaq Composite up +45.00 points to 5008.00. Oil meanwhile closed higher +$.07 to be around the $50.00 level.
This morning though everything fell apart as there were weaker than expected growth in monthly car sales, likely due to the cold and harsh weather in February. But then everyone had their ear toward Israeli Prime Minister Benjamin Netanyahu’s speech to Congress criticizing the White House’s attempts to reach a nuclear deal with Iran, saying it was a “bad deal.” The speech reminded investors of potential geopolitical risks abroad. This was where the selling started with the Dow seeing lows of -160.00 points, S&P 500 -19.00 points and the Nasdaq -50.00 points once again well off of 5000. 15-year ago’s the Nasdaq had an intraday high of 5132.52 before it sold off -12% in 5 days so it will be interesting to see what happens this time around! The market is due for some type of a correction and now that the algo computers got there 5000 read, you never know, volatility may be looking to return!!!
Tuesday, February 24, 2015 12:35 p.m est.
Yesterday the market was flat and this morning was actually down but when Janet Yellen came out before Congress and said that there would be no rate hikes at least for the next couple Fed meetings the market started to rally to new all time highs. The Dow so far has seen highs of +100.00 points, S&P 500 +7.00 points and the Nasdaq up +10.00 points. Her remarks struck a decidedly dovish tone indicating that it would be a while before the central bank's Open Market Committee would make a move on interest rates. Hmmm economy not so good after all? "The FOMC's assessment that it can be patient in beginning to normalize policy means that the Committee considers it unlikely that economic conditions will warrant an increase in the target range for the federal funds rate for at least the next couple of FOMC meetings," Yellen said in prepared remarks before the Senate Banking Committee. This makes a lot of sense and when you see this type of chart you understand why!

So then why is the market up so much after looking at this chart. Well that's easy, global GDP had about $50 trillion pumped into it between 2009 and 2014!! That's 80% in 5 years or 16% per year of our GDP that was borrowed!!!! They say its ok because there making money by the way they calculate it but If you have a family income of $100,000 and you spend $116,000 and go $16,000 into debt, when asked what you are making do you say $116,000? No, that would be silly right? Well, that's how our Global GDP is calculated. It doesn't matter where the money came from, as long as it gets spent so we're going to count it as income. It doesn't matter what the debts are because we're going to pretend they don't need to get paid and, so far, they don't, just ask Greece, get another extension who was just fixed by that again. So, the more we borrow, the better our economy is and the better our economy looks, the more we get to borrow until, like Japan, we are 517% of our GDP in debt! This is unsustainable and everyone knows it's going to end badly but the question is when. But then again were all fine and Japan’s been doing it for almost 20-years now cause if they want to pay down their debt they can always borrow more money, right? Europe is also in Japan's league and China is even on its way having only 300% of their GDP in debt, but that's only based on what they admit to. In reality, China may be worse off than all the rest. Anyhow, until it all implodes, China will buy U.S bonds and Europe will buy Chinese bonds and the U.S will buy U.S bonds because that's what everyone does as it all just goes round and round in an ever ending circle....

Sunday, February 22, 2015 12:35 p.m est.
So the market made another new all time high on Friday with the news that Greece got another six month extension to figure out what to do and that's considered good news, wow!! At the close the Dow was at highs, up by +154.00 points to 18140.00, S&P 500 +13.00 points to 2110.00 S&P 100 +5.00 points to 927.00, and the Nasdaq Composite is within 100 points to its all time high, up +31.00 points to 4955.00. I still remember when it went over 5000 in 1999 and I said it would see a big correction and then be in at least a 15 year bear market. The Dow and S&P have made new highs but the Nasdaq is still lower. Considering were in the technological revolution that's surprising. Anyhow, all this while oil was lower closing down -$1.36 to be around the $50.81 level. The market is quite overbought right now so its ripe for a correction and even fundamentally it is getting pricey!! Of course right now because of Greece and the EU's continued rhetoric and world stimulus, markets are struggling to remain higher on lower and lower volume but so far its working now bringing the market up about +2.5% for the year! Still, I think volatility will return.
The S&P 500 trades at 17.3 times forward earnings per share and 10.2 times earnings before interest rates, depreciation, and amortization added back to it,,,EV/EBITDA. The only time during the past 40 years that the index traded at a higher multiple was during the 1997-2000 Tech Bubble. The median stock has a P/E and EV/EBITDA of 18 times and 11.0 times respectively. These valuations rank in the 99th percentile of both P/E and EV/EBITDA multiples since 1976. The entire market is about 2-3 turns of EBITDA overvalued. And there are those who say stocks are "cheap," right!!! And of course interestingly the smart money is, well, smart and knows that buying anything at 10x or 11x EBITDA usually ends up wiping out gains so yes “smart money” is selling, not buying. Completed private equity sales through M&A and via follow-on offerings have both surged to record levels measured by both number of deals and by transaction value. A total of 350 follow-on sales by private equity firms were completed in 2013 and 2014, a 70% jump from the 210 transactions completed in 2011 and 2012. So far it hasn’t done anything but that's because thanks to management teams, whose equity-linked incentives and compensation go up the higher their stocks goes, which is why companies were forecasting to buy back a record $450 billion in stocks in 2014 and probably much more, in 2015.
The only other thing helping the market is that even now the world's oldest central bank, Sweden's Riksbank has taken the plunge into negative rates! There have been 19 'eases' by central banks this year and so Morgan Stanley is warning about the "ghosts of the 1930’s" and we all remember how that turned out! Even Canada just lowered rates but that's not the case with America just yet. This could be a telling week though because everyone is expecting the Fed to raise rates later and later and it keeps getting pushed back so that has helped support the market. However, Tuesday and Wednesday Fed chief Janet Yellen is speaking before Congress though and she may give the market a better clue of when they will start and if its sooner than later, the market may see volatility start once again! Actually, the expectation of a normalization of monetary policy by the Fed has resulted in a sustained rally in the U.S dollar. Such strength in the world's reserve currency has simultaneously applied pressure on economies pegged to the greenback as their dollars fall. Meanwhile rate hikes from the Fed - which are expected to begin later this year will naturally lead to tighter monetary conditions in economies everywhere from Mexico to Hong Kong as they may be forced to raise rates and It is this divergence in the actions of the world's major central banks which could lead to a new global liquidity crisis, which could be lets say “interesting,” for the market.
Monday, February 16, 2015 2:35 p.m est.
With today being a holiday and were headed into an expiration traded week its interesting that the past two weeks have seen the market lose its volatility and return to just trading to the upside with new highs hit on Friday with the Dow surpassing the 18,000 level and the S&P 500 just short of 2100, up +5% in the past two weeks. All the while geopolitics remain hot, the economy remains average and earnings although beating, are on much lower expectations than originally forecast three months ago and thus making stocks look very expensive from an earnings standpoint! At the close the Dow was up by +47.00 points to 18019.00, S&P 500 +9.00 points to 2097.00 S&P 100 +4.00 points to 923.00, and the Nasdaq Composite +36.00 points to 4893.00. Oil rallied but is remaining near the $50 level as it may for a while to come with it closing up +$1.44 to be around the $42.78 level.
This is interesting as traders are forgetting the highest inventory-to-sales ratio, Chinese poor economic and deflation data, the newly set record low in the Baltic Dry Index as shipping is non-existent outside of the strike, American economic data average, slumping U.S earnings, dumping oil prices, huge credit spread widening.... and don’t forget Greece, yet we see stocks rally to new highs. This may make for an interesting week as there was a DeMark 13 Sell signal last Thursday which is a respected technical indicator by a short list of respectable information sources including Bloomberg, CQG, DeMark Prime, and Thompson/Reuters. The last time the 13 signal was generated was at the end of November when the S&P 500 fell from 2080 to 1960 for about a -120 point decline. Although I don’t follow this information, I've heard it has a reasonable track record and something to be aware of. Another reliable indicator that saw an extreme reading was the Arms 10-day moving average which reached a sell signal low on Thursday, which has not been seen in well over a year and then set another extreme sell signal on Friday. Also the Nasdaq has left many gaps behind and often gaps are revisited which would mean the +170 points that weren't so much traded, as it moved, may see a reason to work its way back down without even breaking any key support levels. In addition volatility closed at new low for the year at 14.6, not extremely low because we can all remember lows of 12 and 13 but when mixed with the Arms low and the 13 signal its another reason for the markets to start to maybe start to rollover next week.
Saturday, January 31, 2015 12:35 p.m est.
Friday the market was under pressure once again but midday did make an attempt at a rally and moved slightly into positive territory but the final hour saw selling come back with it closing at its lows and once again another triple digit loss on the Dow. At the close the Dow was down by -251.00 points to 17165.00, S&P 500 -26.00 points to 1995.00 and the Nasdaq Composite -48.00 points to 4635.00. Strangely it was after oil rallied on the day with it closing up +$3.65 to be around the $48.24 level.
At the beginning of the year I mentioned that history says that years ending in 5 are always up and pre-presidential election years are always higher, but that it would be volatile. So far that continues to be the case especially if we look at this week alone with the past 4 of 5 sessions seeing triple digit moves both ways on the Dow.
The other day I saw an interesting statistic that I had to look up. The S&P 500 has never had seven consecutive up years in a row. Even after Al Gore invented the internet lol, and the market soared +132% over 5 years, the following three years were lower. Of course, records are made to be broken, and each year is supposed to stand on its own but in a market that faces an uncertain future regarding monetary policy, the global economic slowdown happening, an oil price plunge that is dampening capital investment, the S&P 500 is highly priced at more than 19 times earnings,,, then one thing for sure is that if you're going to see another up year, you're going to have to grow earnings very fast as future earnings are being downgraded daily. Another big factor is that geopolitics are getting tense once again so it looks like a decent correction could be sitting out there or at the least, volatility is here to stay. I'm reluctant to say we’ll see a strong correction because we all know the Fed can jump in to save the market in a second but we could see a slow drag lower as we move through the summer.
As today is also the last trading day of January we can also say that its not looking good for the year as we finished the first few days of trading lower, the first week lower and now the month lower and statistics say that there is now a 88% chance that we’ll see a lower year. It didn’t happen last year so you never know and with the Fed in charge who knows but for sure again we’ll likely see volatility continue! It also means that even if we do see an up year it will likely be with small gains.
One of the reasons for the downside pressure was because it was reported that the economy slowed a bit more than expected in the fourth quarter after expanding at the fastest pace in eleven years during the fall, according to data. Gross domestic product, the value of all goods and services produced, grew at a +2.6% annual clip in the fourth quarter. That’s below the +5.0% pace recorded in the July-September period. Economists forecast GDP would grow by a seasonally adjusted +3.2% in the October-to-December period. For all of 2014, the economy grew at a +2.4% rate, slightly faster than the +2.2% gain in the prior year. Of course consumer spending was a major positive in the fourth quarter, expanding +4.3%, the fastest pace since before the financial crisis. But growth was pulled down by weaker business spending, a drop in federal government spending and net exports. Economists say the pattern of strong consumer spending and weak business spending should persist in the first quarter as a result of the sharp drop in oil prices.
Wednesday, January 28, 2015 1:15 p.m est.
Monday’s market ended the day neutral to slightly higher but after Caterpillar reported very poor earnings after the bell, microsoft had a “disappointing outlook”, Procter and Gamble also missed earnings and had a poor outlook and finally Freeport-McMoRan said it is cutting capital expenditures, the market tanked yesterday opening lower by over -1%. It was also reported that 18 other companies in the S&P 500 all reported poor earnings and lowered their expectations. The Dow saw lows of -390.00 points, ,S&P 500 -38.00 points and the Nasdaq -115.00 points in the first hour of trading. By the end of the day some of the losses were cut with the Dow down by -291.00 points to 17387.00, S&P 500 -27.00 points to 2030.00 and the Nasdaq Composite -90.00 points to 4682.00.
Today was looking like Apple saved the day with their earnings as early highs were seen with the Dow up +75.00, S&P 500 +14.00 and the Nasdaq +65.00 points but when oil inventories were reported the highest in 80-years, the market started to sell off. Wasn’t it five years ago that we were supposed run out of oil lol!! Traders were also worried about what the Fed may say after its meeting ends at 2:00 est. The Dow saw lows of -40.00 points, S&P 500 -6.00 points and the Nasdaq -5.00 points. After this though the market drifted back into positive territory as it awaits the Feds decision.
The biggest problem with earnings is that the strong dollar is starting to hurt our multinational companies who make most of their money overseas which is already struggling with a economic slowdown. Add in the fact that future earnings continue to be lowered its no reason the market fell as the market appears expensive. Volatility is likely here to stay.
Other factors that may be affecting the market from a contrary standpoint was that Consumer confidence jumped in January to the best reading since August 2007, according to the latest reading from the Conference Board. The consumer-confidence index rose to 102.9% from 93.1% in December, above economic forecasts of 96.9%.
Orders for durable goods also declined sharply in December, raising questions about whether businesses are really ready to ramp up investment in 2015. Durable-goods orders sank -3.4% last month, while the November’s reading was marked down to a -2.1% decline from a drop of -0.9%. Economists had expected a +0.1% increase in orders, although expectations were all over the map. The weak December reading was the fourth decline in the past five months. The data comes as the Fed gathers in Washington to set monetary policy for the next six weeks. Economists expect the Fed to say it remains “patient” about the first rate hike. Numbers like this and the risk of the Fed raising rates becomes unlikely. The surprising decline appeared to stem in part from how commercial-aircraft orders are calculated as non-defense aircraft orders fell -55.5% in December. There was weakness across the board though, excluding the volatile transportation sector, orders were still down -0.8%, the third straight decline.
There was good news as sales of New single-family homes rose sharply in December, helping sales for the year to show a modest increase from 2013. Sales of new single-family homes jumped +11.6% in December to a seasonally adjusted annual rate of 481,000. Economists had expected an annual rate of 455,000 in December, compared with an originally estimated November rate of 438,000. Sales of new homes in December were up +8.8% from a year earlier. For all of 2014, new-home sales hit 435,000, a +1.2% rise from 429,000 in 2013. Sales remain far below a peak rate of almost 1.4 million in 2005. The median price of new homes hit $298,100 in December, up +8.2% from the year-earlier period. For 2014, the median price hit $283,600, up +5.5% from the prior year. The supply of new homes on the market fell to 5.5 months in December from 6 months in November.
Monday, January 26, 2015 1:50 pm est.
Okay well we can now say the entire world has gotten into the stimulation game as of last week. Our Fed started it in 2008 and of course Japan started back in the late 90’S but have recently ramped it up again. Even China started doing a little a few months ago but the big one now is that the European Central Bank finally announced it will start a $70 billion per month bond purchase program to start in March to help save their economy. Interestingly our markets reacted negatively on the news at first falling with the Dow seeing lows of -80.00 points, ,S&P 500 -6.00 points and the Nasdaq -25.00 points. It turned back up pretty quick though because the banks realized its free money to invest in stocks so the Dow saw highs of +280.00 points, S&P 500 +33.00 points and the Nasdaq +85.00 points. At the close the Dow was up by +259.00 points, S&P 500 +31.00 points and the Nasdaq Composite +83.00 points, taking indices into positive territory for 2015.
On Friday however even though Europe was higher once again our market sold off all day closing at lows with the Dow down by -141.00 points to 17,672.00, S&P 500 -11.00 points to about 2052.00, S&P 100 -6.00 points to 903.00 and the Nasdaq Composite +7.00 points to about 4758.00. For the week though the ECB saved the day as we saw a higher week. All of this even though oil fell -$1.00 to close around the $45.50 level, new lows for the week. Overall another volatile week with the market seeing huge 1% gains swings every day. How long will this continue is the question, likely for awhile as technically the market is still overbought, fundamentals are weakening fast as companies continue to lower future earnings expectations making the market fundamentally expensive and geopolitics are still sitting out there with the war in Ukraine kicking up and who knows where ISIS will attempt to terrorize the world once again. At the least headwinds persist making for a volatile year!
The funny thing is that after over 2 years of talking up the market, ever since his "whatever it takes" speech in July 2012, Draghi finally folded and launched QE. ECB President Mario Draghi said the central bank would make monthly bond purchases of as much as $70 billion starting in March, and running through September of next year for now lol. We announced three QE programs for example lol!! Anyhow, this after the ECB held benchmark rates unchanged at record lows. Of course this isn’t going to increase bank lending in Europe as far as I can see just like it didn’t in America but only help to support stockmarkets. The one thing that it may do is cause more deflation as currencies fall actually but even that's a stretch. But the main point is once again this isn't a cure as it hasn't helped Japan, it hasn't really helped America and even though its an idea, it's not a cure for Europe's deepening economic stagnation.
In the U.S., Fed officials recently decided to end their third round of QE after sucking up more than $3 trillion in bonds. Though the Fed policy was not without critics, it is generally credited with helping to slightly build the economy and put the banking system back on its feet after the worst financial crisis since the Great Depression. However when you look deeper and see that our great employment achievement of 5.60% has the lowest participation rate since 1978 you can see why its not really that great. The good news though is that through all of this our interest rates are one of the best to invest in and why the American dollar continues to rally. America is the only country to show any potential growth and our interest rates are actually higher at 1.82% currently. Spain 1.35%, Germany 0.36%, Japan 0.22% and Switzerland now negative -0.33%.
Japan and Europe are not alone in facing the problems of falling prices and economic slowdowns. The U.S and the rest of the world's economy is grappling with dropping prices and slower growth. Even Canada just lowered interest rates a quarter point as they worry about what falling oil prices may do to the economy. While the recent crash in oil prices has accelerated the trend, prices of raw materials such as copper, which just hit new lows and other natural resources which have been falling since the Great Recession in 2008, it indicates people just aren’t buying that much “stuff” so to speak. This is all making for the coming year to be very interesting as everyone is now in the stimulation game as the world economy is slowing and companies are running out of steam. Falling oil prices has caused over a 100,000 layoffs and tech companies are showing the strain as companies are laying off now. IBM this morning announced -100,000 jobs cut for example. Its going to be an interesting year for sure and as this the last week of trading for January it will be interesting to see how we finish up to guesstimate the rest of the year!!
Friday, January 16, 2015 1:27
This week saw volatility continue as the Dow saw a 3200 point swing move in the past 10-days and had been down 5-days in a row. Tuesday was the start of it when the market was up huge, +290.00 points on the Dow, +30.00 points on the S&P 500, but then fell to close the day lower with the Dow seeing a 450 point swing alone! Today was actually pretty tame as we started the day slightly down and then rallied pretty hard with the Dow seeing early morning highs but before there was 30-minutes of trading, the Dow saw lows of -40.00 points, ,S&P 500 -6.00 points and the Nasdaq -15.00 points. It wasn’t looking good but expiration may have come into play though as it started to rally again making new highs in the final hour with the Dow up +210.00 points, S&P 500 +28.00 points and the Nasdaq +65.00 points. At the close the Dow was up by +191.00 points to 17,512.00, S&P 500 +27.00 points to about 2019.00, S&P 100 +11.00 points to 889.00 and the Nasdaq Composite +64.00 points to about 4634.00. Oil rallied today closing up +$2.18 to close around the $48.50 level.
It was looking ugly overnight though as the market was looking like it was gonna be down hard this morning as a headline appeared overnight that two Greek banks had requested emergency liquidity assistance so Globex S&P 500 futures sold off all the way down to 1970.50, another -1% loss. It does look like the S&P is heading for its 200-day moving average at 1965 in the end but this was an expiration traded week which can exaggerate moves and were now a bit oversold so it may have to wait. Oil has been key to watch, for example crude futures made a high of $51.00 yesterday but then traded down to $46.39, a $4.61 drop. Everyone knows that this movement in indexes and commodities has been too extreme and all the increased volume algorithmic and program trading has exploded from 10 point moves to 30- to 50 point ranges now becoming the norm. My view is that the market hasn’t found support yet longer term and will head sideways to down but since the 1970-75 level held up against the short-selling, it wasn’t surprising we saw a late Friday run to the upside. Of course then there's next week but I’ll talk about that more over the weekend!!
This morning it was reported that Consumer inflation in December saw the biggest monthly drop in six years as gas prices crashed. Consumer prices fell -0.4% in December, the largest drop since the end of 2008, matching expectations from economists. Energy prices plunged -4.7% in December, the biggest drop since the end of 2008, as gas prices fell -9.4%. Energy prices are expected to drag down headline inflation in coming months as well. Consumer prices grew +0.8% in 2014, the second smallest calendar-year increase in the last five decades. While low inflation sounds good to consumers, the Fed wants to make sure that inflation doesn’t get too low. That’s because it’s hard to break the vicious cycle of deflation, a sustained downward price trend that sees consumers delay purchases, weakening the economy. The “core” reading of inflation, which excludes the volatile categories of food and energy, showed that prices were unchanged in December, compared with a gain of +0.1% in November. The inflation-adjusted average hourly earnings rose +0.1% in December. For the year, real average hourly earnings rose +1%.
The preliminary January reading of the University of Michigan/Thomson Reuters consumer-sentiment index jumped up to 98.2%, the highest level since 2004 from a final December reading of 93.6%. Economists had expected a January result of 95%. For context, the consumer-sentiment gauge averaged 86.9% over the year leading up to the recession. Economists follow readings on confidence to look for clues about consumer spending, the backbone of the economy.
Industrial production declined -0.1% in December, marking the first drop since August, after unusually warm weather quelled demand for heating, the Fed said. Economists had expected a -0.2% decline. Excluding utilities, industrial production rose +0.7%, as manufacturing output rose +0.3%. Compared to a year ago, industrial production climbed +4.9%. Capacity utilization fell in December to 79.7% from 80% in November.
On Wednesday one of the things that hurt the market was that consumer spending unexpectedly fell in December as demand fell almost across the board, but that is probably not the start of a weak trend given lower gasoline prices and a firming labor market. The Commerce Department said retail sales excluding automobiles, gasoline, building materials and food services fell -0.4 percent last month after a +0.6% rise in November. The so-called core retail sales correspond most closely with the consumer spending component of gross domestic product. Economists had expected core retail sales to rise +0.4% last month. December's surprise decline could temper expectations that consumer spending, which accounts for more than two-thirds of economic activity, accelerated sharply in the fourth quarter.
Tuesday, January 13, 2015 1:27
Yesterday the market was down hard over -1% but ended the day on an ok note but today we ended up seeing a huge range in the market with the Dow seeing early morning highs of +290.00 points, S&P 500 +30.00 points and the Nasdaq +90.00 points even though oil was lower once again and Alcoa’s earnings were only average and their stock lower. But then there were disappointing comments from KB Home on its conference call, which dropped the whole home builder market and reports out that some traders sold a bunch of call options on several large cap names such as Pfizer, Microsoft, Yahoo, JNJ, and Cisco. It may have also been affected by President Obama's request to Congress for authorization to use military force against an Islamic State slowly dragged the market lower.
Financials also performed poorly today and were among the first sectors to drop off and but as we are going into earnings reports for big banks this week, it is fairly common to sell into earnings a bit. We could see more volatility tomorrow though as the European Court of Justice will rule on the legality of the Outright Monetary Transactions, which promised to buy sovereign debt on the secondary market. Any rulings that say such actions are not legal will put a damper on sentiment, even if it is non-binding and would be difficult for the ECB to do a QE program in the face of such a legal turndown. Highly unlikely but is out there....
At its lows the Dow was down -150.00 points, a 450 point swing,,,,,,S&P 500 -20.00 points and the Nasdaq -40.00 points midday. At the close the Dow was was only down by -27.00 points to 17,613.00, S&P 500 -5.00 points to about 2023.00, S&P 100 -2.00 points to 893.00 and the Nasdaq Composite -3.00 points to about 4662.00. Oil was off -2% at one point today but closed up +$.18 to close around the $46.00 level.
Friday, January 9, 2015 1:27
It was another volatile week for the market with the Dow seeing triple digit gains and losses all week but it ended up only being down about 3/4 of a percent in the end. Today the Dow was down -230.00 points, S&P 500 -24.00 points and the Nasdaq -60.00 points midday but cut a bit of the losses by the close. At the close the Dow was down by -171.00 points to 17,737.00, S&P 500 -17.00 points to about 2045.00, S&P 100 -8.00 points to 902.00 and the Nasdaq Composite -32.00 points to about 4704.00. Oil closed near lows down today -$.55 to close around the $48.00 level.
This week so far has confirmed what the entire year may look like as the market deals with changing fundamentals such as a higher p/e ratio, slower growth around the world, to much bullish sentiment and complacency, monthly technicals overbought, geopolitics heating up such as today’s terrorist attack in France and the smart money is leaving the market slowly. At the least were likely to see continued volatility even if the Fed comes back in to rescue the market with another round of quantitative easing which could be possible if the market does go down to much! For now though it will be hard for them to do that as there is “decent” economic data such as todays employment report showing another +252,000 jobs were created with unemployment falling to 5.6%. The bad news is wages fell -.05 cents to $24.57.
Friday, January 2, 2015 1:27
This was an interesting year, as Americas debt rose but so did the stock market, an 18,000 Dow and an 18 Trillion debt level was surpassed....19 trillion will come in short order so will a 19,000 Dow be in store, we’ll see....
According to Investors Intelligence there have never been so few bears in the market and everyone is expecting another great year but.... At the start of 2014, January saw about a -6% fall out of the gate as 2013 finished strong up +30%. Today was looking similar because after an ugly -1% fall Wednesday to end the year, today the Dow was down -100.00 points, S&P 500 -13.00 points and the Nasdaq -40.00 points midday. There has been a lot of talk about the market always being higher because it is a year ending in 5 so I looked back at 2005 and found some interesting similar statistics. In 2003 the market was up +26%, 2004 was up +9% and 2005 finished the year up only +4% after a ton of volatility and the year started with a -4% fall!!
There are many reasons for the market to see volatility this year, commodity prices crashing, every Central bank in the world has been in play trying to support the market, our Fed plans on raising interest rates next year and we’ve now been up 6 years in a row. While statistics suggests that 2015 leans more heavily towards positive returns, there is sufficient cause for concern. There are only three previous periods where all three prior years were positive return years also. There is no real precedent for the 5th year of the decade when the previous six years were positive. In fact, there are only two periods going back to 1835 where the markets have had sequential positive returns for six years or more. The first was from 1866-1872 which was followed in 1873 with a -13% decline. The second was the unprecedented nine year run from 1991-1999 during the "tech boom" after Al Gore invented the internet lol!! This unfortunately ended dramatically with a three year bear market beginning in 2000. There are many analysts and economists suggesting that we are repeating the 1990's secular bull market, not being marked by global economic weakness, rising deflationary pressures, and an ongoing scramble by Central Banks globally to support asset prices. With the current bull market already very aged by historical standards, valuations above all but one bull market peak, margin debt at new record levels and the Fed now supposedly moving to a tightening monetary policy, there are significant risks that should not be readily dismissed.
They also say the 5th year of the decade is also the pre-election year of the Presidential election cycle. Like the 5th year of the decade, the pre-election year of the Presidential cycle is the best performing of the four-year span. However, that does not mean that 2015 is a guaranteed winner either. With President Obama now considered a "lame duck President," the market and economy will begin to deal with higher costs and taxes from the Affordable Care Act, reduced liquidity from the Fed, ongoing geopolitical risks and a lack of fiscal policy. Friday was kind of surprising as I thought investors would want to hold that 18,000 level on the Dow but it continued lower today.
At the close the Dow was barely up by +10.00 points to 17,833.00, S&P 500 -.70 points to about 2058.00, S&P 100 -.06 points to 908.00 and the Nasdaq Composite -9.00 points to about 4727.00. Oil closed near lows for the new year down today -$.60 today to close around the $52.70 level.
Friday, December 12, 2014 4:07
The market attempted to bounce strongly yesterday but as oil fell it almost wiped out all of the gains. Today it continued selling as oil broke the $60 level with the Dow seeing lows of -330.00 points, S&P 500 -33.00 points and the Nasdaq -55.00 points in the final hour. At the close the Dow was down by -316.00 points to 17,281.00, S&P 500 -33.00 points to about 2002.00, S&P 100 -14.00 points to 888.00 and the Nasdaq Composite -54.00 points to about 4654.00. Oil has continued lower down -$2.00 today to close around the $58.00 level. Many analysts are saying it could go all the way down to $30 a barrel level before turning back up.
It wasn’t surprising to see a down market this week as we were up 7 in a row and the weakest for the December trading period. Psychology is funny, you would think lower oil, meaning lower gas prices would be incredible news as it adds billions of dollars to the overall economy for spending which is 76% of the economy anyhow. When traders get that maybe it will turn back up. For the shorter term as were now entering expiration week we’ll likely see upside pressure and there are some interesting stats out there for the rest of December that may confirm that.
On Tuesday we saw a “90% Down Volume Day” and there has been a number of them this year. These are days in which 90% of market volume during the day occurred in declining stocks. Generally these negatively skewed days are indicative of exhaustive selling pressure, and thus should lead to a rebound. Interestingly, amid all the Santa Claus Rally talk, its a good idea to look at 90% Down Days occurring in the month of December. Since 1965, there have been 14 90% Down Days occurring in the month of December. 13 of the 14 occurrences have been positive with the one negative result, following 12/11/2007 and was down just -0.6% at year end. The average return into year-end was +3.31%. Even after year-end, the strength typically persisted with a median 3-month return of +11.5%, nearly triple the return following all 90% Down Days. Of course, the sooner that the 90% Down Day occurs into December, the more time there is to generate higher returns. The 12th of the month leaves plenty of time for a rally and interestingly the December 90% Days actually occurred, on average, 10 days into the month. The market has been up pretty strong this year though so that may be the one caveat to deal with this indicator which is more comparable to the 2007 period but even in that case it only saw a slight loss in the end.
There is also an interesting stat out for volatility when it ratchets straight up in December that sees a perfect 52 for 52 record of seeing a higher market. Today the VIX, volatility index was up +82% above its 1-month low, set last Friday. Therefore, if the historical pattern is to hold true again, the S&P 500 should at least close the year above the 2050.00 level. These are two pretty good indicators for the market and make sense considering it has been a decent year so the Fed who I have learned is now trading the S&P 500 e-mini contracts, will also likely try to support the market here as it has ended the week on a sour note.
Wednesday, December 10, 2014 4:07
The market has been hit pretty hard this week, down about -2.3%,the last three days in a row, although yesterday was mixed as tech stocks were up. Today saw the worst so far as the Dow saw lows of -300.00 points, S&P 500 -36.00 points and the Nasdaq -90.00 points. Seasonally wise the selling isn’t surprising as we were up seven weeks in a row and this is supposedly the weakest week of December. We are getting close to the holidays and the end of the month so I’m sure support will be found soon, around prior break out levels and I’m sure the Fed will be in soon buying up some S&P 500 e-mini contracts to help support the market so it will be interesting to see how we finish up going into expiration week!!
At the close the Dow was down by -268.00 points to 17,533.00, S&P 500 -34.00 points to about 2026.00, S&P 100 -14.00 points to 898.00 and the Nasdaq Composite -82.00 points to about 4684.00. Oil has continued lower down -$3.00 today to close around the $61.00 level.
Thursday, December 4, 2014 4:07
$18,000,000,000,000 trillion in debt now wow! Thank you very much President Obama, it only took an entire year to add another trillion!! At the same time we see that China has just become the largest economy in the world producing $17.6 trillion putting America in second with $17.4 according to the IMF. This is the first time since 1822 and not in question since 1945. As recently as 2000 America was three times as strong as China so the change has been quick. Interestingly the Chinese economy seems to be slipping into recession right now. But we all know QE will save their day lol!! Meanwhile the stockmarket yesterday matched 1929’s record of 48 record closes . Biggest difference there though was that was done in September for a October crash and now were in December so a crash from here is unlikely.
So far this week the market has been pretty flat even with that record high yesterday. Today it was under pressure as the European Central bank had nothing but bad news out as they offered no surprises when it decided to leave interest rates unchanged. President Mario Draghi made things worse when he said the bank will reassess its current plan in the first quarter, implying that any initiative to purchase sovereign debt which the market wants was not imminent. He also made references to the ECB balance sheet, saying that it is his "intention" to raise the balance sheet by 1 trillion to 3 trillion euros, but that is not a "target." If that sounds a little too subtle, it means the ECB may not be as aggressive as initially thought. He also said he expects GDP for 2015 to only be +1%. The biggest problem is that Germany who’s economy is going strong and one of the biggest providers for the EU doesn’t want more stimulus.
This originally hurt the market with it seeing lows of -100.00 points, S&P 500 -12.00 points and the Nasdaq -15.00 points but there was a sudden spike in the market right after it was announced by some other European officials that "The European Central Bank’s Governing Council expects to consider a proposal for broad-based asset purchases including sovereign debt next month.” This also reveals how fake the market is right now, moving on fake money not real investing. Can’t wait till we get into the new year!
Final hour selling saw the market pullback again so at the close the Dow was down by -13.00 points to 17,900.00, S&P 500 -2.50 points to about 2072.00, S&P 100 -1.00 points to 918.00 and the Nasdaq Composite -5.00 points to about 4769.00. Oil has been getting smashed as OPEC never cut production and there is such a glut of it out there and today it crashed closing down -$.65 now around the $66.70.
Friday, November 28, 2014 2:07
This week was a holiday period of trading and there are many things to be thankful this Thanksgiving outside of the market as it continues to push higher on fumes and having zero logic for everything going on around it. This makes it the best time to focus on numbers and just go by them. On Wednesday it broke an all time record up 29 days in a row above its 5-day average. The last record was 28-days in a row in 1915!!! With the sell off at the end of the day today we finally saw it break though and after its record in 1915 was broken the market saw a -10% correction so it will be interesting to see what happens this time around. We are in what everyone and their dog is declaring the most favorable seasonal period of the year so that may be hard to see. Considering everyone is thinking this way it should be something to be concerned about though! One thing for sure though is the market is so overbought its unbelievable and trading on fumes! Although this week generally doesn’t see much movement due to the holiday this one saw it become mixed but still higher for the sixth week in a row.
Today the Dow saw highs of +70.00 points, S&P 500 +4.00 points and the Nasdaq +20.00 points. In comparison tech stocks have been incredibly strong all week up about three times as much as other stocks but I think that's because the Nasdaq 5000 bulls are trying to take hold. The shortened trading day saw selling come in though and the Dow saw lows -20.00 points, S&P 500 -8.00 points and the Nasdaq only -1.00 point. At the close the Dow was up +.50 points to 17,828.00, S&P 500 -5.00 points to about 2068.00, S&P 100 -2.00 points to 916.00 and the Nasdaq Composite +4.00 points to about 4792.00. Oil has been getting smashed as OPEC never cut production and there is such a glut of it out there and today it crashed closing down -$6.50 now around the $67.25 level unbelievably.
The divergences in the market continue to be unbelievable as the 30-year bond has now closed under 3.00% which is very strange as the S&P 500 is now trading 200 points above Treasury markets. In normal markets the 30-year yield should be about 55 points higher especially with world GDP expectations plunging as fast as oil prices. This also indicates the economy may not be flying as hot as stocks think it is in the future and with stretched valuations that's a concern. Valuations of reported and expected earnings are both above previous 2000 and 2008 peaks now and if world GDP really is slowing that may be a concern for next year. Margin levels to borrow stocks are also way above both the 2000 and 2008 peaks which is still sitting out there as traders become complacent that they can borrow to buy more and more stock! Sentiment is also leaning way to far to the left now as there are barely any bears left in the market whatsoever and that is confirmed by volatility almost back to prior year lows. Overall, complacency is unbelievable right now so the market is ripe for volatility to start but the question is when and that's why I’m switching to reading hourly indicators instead of daily. The tech bulls are really trying to grip the market and were about to enter the last month of the year for trading so they have a shot at making 5000 so even if we do see volatility kick up there likely isn’t much downside left for the year because managers want their books to look good for another year.
Tuesday, November 18, 2014 4:07
The market continues to move to its own beat and showed that today as another new record was set. The Dow saw highs of +90.00 points, S&P 500 +16.00 points and the Nasdaq +40.00 point. At the close the Dow was up +40.00 points to 17,688.00, S&P 500 +10.00 points to about 2052.00, S&P 100 +3.00 points to 910.00 and the Nasdaq Composite +31.00 points to about 4702.00. Oil closed down -$.85 now around the $74.50 level.
Once again the market is making history for an upside move. The S&P 500 had only moved 2 points in the past 5 days and it hasn't done that since the 1940's. The S&P 500's closing range over the past 5 days is the lowest in history. The S&P 500 in the past 6 days has closed at the following prints; 2038, 2039, 2038, 2039, 2039, 2041, which is the narrowest 6 day market range in well... ever!!! With the index setting a new 52-week high it has now closed above its 5-day moving average for 23 days in a row now. Quite the feat, and closing in on the record, which is 26 made way back in the 1940’s. The problem is that although we were more or less flat yesterday, there was a huge discrepancy between declining versus advancing stocks across the board and today’s move was also very slanted. It's a stealth sell-off, the kind we often have before a major market fall. With three trading days to expiration and this being set as one of the strongest expiration cycles ever, I still think there could be some volatility to end this cycle to the downside looking at Program Numbers.
In September of this year, margin debt on the New York Stock Exchange (NYSE) stood at $483.87 billion, a new record-high. When the stock market was forming a top in 2007, margin debt was at a “then” record-high of $329.51 billion. Margin debt on the NYSE is now 47% higher than just before the previous big market sell-off. And according to the S&P 500 Shiller P/E multiple (a measure of the value of stocks compared to inflation-adjusted earnings), stocks are very expensive. As of November 6th, this multiple stood at 26.51; this means that for every $1.00 a company makes, investors are willing to pay $26.51. From a historical perspective, using this indicator, stocks are severely overvalued. As we move into next year I think I think things are going to get interesting. November and December are generally good months for the stock market. But we must face the facts going into 2015; the big rebound we had in stocks following the 2009 lows is nearing a peak to at least see volatility. With money printing off the table for now and the Fed having warned of higher interest rates in 2015 and 2016, how can stocks move higher?
Monday, November 17, 2014 4:07
Overnight Japan reported that their GDP fell for the 2nd quarter in a row down -1.6% from an expected rise thus making it official that Japan has entered a triple-dip recession, in one year! So after their big rally the past month after their announcement of stimulus #20 I think,,,,they saw a -3% fall! This drove Globex futures down overnight almost half a percent but by the open it came back quite a bit because there was still some comments to come from the ECB about another stimulus program there too. Just after the open the Dow saw lows of -40.00 points, S&P 500 -5.00 points and the Nasdaq -25.00 points. Then when suddenly,,, and I say this very cynically, ECB President Draghi said that the European Union will do whatever it takes within its mandate and may even do an expanded purchase program for government bonds, the market turned around and the Dow saw highs of +25.00 points, S&P 500 +3.00 points but the Nasdaq only made it to -1.00 point. The market struggled a bit from there interestingly though and ended up closing mixed with the Dow up +13.00 points to 17,648.00, S&P 500 +1.50 points to about 2041.00, S&P 100 -.25 points to 907.00 and the Nasdaq Composite -18.00 points to about 4671.00. Oil closed down -$.30 but now around the $76.00 level.
Another factor that hurt the market this morning was that JP Morgan cut its rating on U.S. stocks to underweight, similar to a sell recommendation, from the equivalent of buy, while reversing the call for euro-area equities. As enthusiasm for European stocks faded since the beginning of 2014, when bulls united in favoring the region, the lag versus the U.S. has now made them too cheap to ignore, according to JPMorgan strategists led by Mislav Matejka. The American market had rallied +12% since the October low whereas Europe is only up a more normal +6%. Why has ours been up so much, because of the belief now that there will be more stimulus in the end and interest rates wont rise until late 2015. Everyone and everything is about stimulus now or how our markets are being affected by them. This is a scary thought and I think will drive the market lower when there is a hint that its not working or we may see a cutback. Maybe then we’ll see normal market trading once again,,,,,,the good old days…....
Friday, November 14, 2014 4:07
The market was virtually flat once again this week, just building on its overbought level and sentiment getting even more bullish. At the same time volume continued to fall which isn’t healthy. With oil collapsing to the $75 level, all of this is making it hard for the market to hold itself up but it needs something to spark a bit of a corrective action. Considering that next week is an expiration traded week that may be the case as it was for the October expiration cycle. Today the market started the day slightly higher but fell midday with the Dow seeing lows of -45.00 points, S&P 500 -5.00 points but the Nasdaq held up well after earlier lows of -20.00 points. From there it drifted and finished the day mixed.
At the close the Dow was up -18.00 points to 17,635.00, S&P 500 +.50 points to about 2039.00, S&P 100 -.15 points to 906.00 and the Nasdaq Composite +8.00 points to about 4689.00. Oil closed up +$1.80 but now around the $76.00 level.
One of the reasons the market rallied so hard off of lows a few weeks ago was because Fed President Bullard changed his tune saying “a logical response at this juncture is to delay the end of QE!” One of the reasons the market started to fall last month was because it looked like the Fed was going to raise interest rates sooner than later so it was smart for him to say that to save it. This past week he said the “the economy is in good shape, no need for QE for now”! So far the market hasn’t reacted but time will tell.
The Fed remains at 0% and is not expected to raise rates until September 2015. But what is the Fed really targeting and is this good long-term policy? The economy added +214,000 jobs last month and was the 48th consecutive month of payroll gains, the longest streak of positive payrolls in history. This is surprising as the Fed continues to focus on the negative, emphasizing "labor market weakness" and "slack." They have done so to justify keeping Interest rates at 0% for what will be six years next month. For a long time, the Fed stated that it would be appropriate to keep the Fed Funds Rate in an "exceptionally low range" as "long as the unemployment rate remains above 6.5%. Instead of following this policy, they chose to remove this language in March of this year as the unemployment rate approached 6.5%. Today the unemployment rate is down to 5.8% and the Fed is still telling us that rates will be at 0% for a "considerable time!"
Why are they playing these games more than five years into an economic expansion? The answer to this question only make sense when you understand the Fed's true objective, its no longer "maximum employment" but instead maybe a maximum "wealth effect." So far it seems they seem to be targeting another bubble in stocks. But why would they do that! Its because of the hope that it will help increase consumer spending which will then lead to higher incomes and a stronger economic expansion. Sounds good in theory but there are problems because were seeing the slowest wage growth expansion in history with now huge gaps between the richest and poorest people and the slowest economic growth expansion in history with year-over-year real GDP averaging +1.8%.
Yet the market has more than tripled since the March 2009 low leaving valuations above the 94th percentile on a historical basis since 1881-Present. Six years of easy money has helped to inflate the market but the Feds moves have failed to have a proportionate effect on the real economy. So if maintaining 0% interest rates was really about wage and economic growth, wouldn't we have seen it by now after six years? If they followed prior cycles they would have been done back in 2010. During the recent -9% S&P 500 correction, expectations for the first Fed rate hike was pushed all the way back to September 2015 after a number of dovish statements by Fed members were released thus the market quickly racing back to new highs on this news which is where it stands today. If the futures market is correct, it will be almost seven years of 0% rates before the Fed finally raises rates and it seems if there is a larger correction between now and then in stocks or any signs of economic weakness, you can bet this timetable will be pushed back once again.
The problem that is mounting as we move into next year is that on both a trailing- and forward-estimates basis, the S&P 500 is more expensive now than it was at the market peak in 2007! Current 2015 earning projections are for the fastest earnings growth in several years but this year saw consistent revisions downwards so companies would beat, and that's not likely to change so valuations could rise even more. With yesterdays new all-time high for the S&P 500 intraday at 2046, trailing 12-month earnings of $114.74, the widely-followed index just touched a P/E of 17.833 which is above 2007’s record. For those who don't care about trailing earnings and instead are focused on the forward estimates analysts provide, it's worth noting that the S&P 500 is also trading above its 2007 peak which is dangerous. With revenue growth in the low single digits and anemic wage growth still a problem for the economy, companies better ramp up their buybacks and cost-cutting efforts or else they risk strongly disappointing investors over the next year and we could see volatility really kick up.
Friday, November 7, 2014 4:07
Employment came in pretty good today but the market barely reacted to it with the Dow seeing early lows of -70.00 points, S&P 500 -6.00 points and the Nasdaq -35.00 points before rallying back bit with the Dow seeing highs of +25.00 points, S&P 500 +4.00 points and once again the Nasdaq lagged, still down but off -5.00 points. At the close the Dow was up +20.00 points to 17,574.00, S&P 500 +.70 points to about 2032.00, S&P 100 -.40 points to 901.00 and the Nasdaq Composite -6.00 points to about 4632.00. Oil closed up +$.80 now around the $79.00 level. This was mostly a flat week for the market and has moved into quite an overbought situation and sentiment has gone through the roof with bullishness at its highest level of all of 2014 and bears have gone into early hibernation. The last time this happened the market had a quick -5% spill so we’ll see how next week turns out...
Employment gains this past month were +214,000 jobs in October, nudging the unemployment rate down a bit to 5.8%, as many companies added workers to gear up for the holiday season but sadly the majority of workers were bartenders or servers at +42,000, lol. The economy has now added +200,000 workers or more for nine straight months, a feat last accomplished in 1994. Economists had expected a seasonally adjusted gain of +243,000 jobs. So far in 2014 the average has been +229,000 jobs a month, the fastest pace since 1999. Yet despite the acceleration in hiring, average hourly wages were little changed. Hourly pay rose +0.1% in October to $24.57, putting the 12-month increase at +2%. Year-over-year increases have ranged from 1.9% to 2.2% over the past two years. The amount of time people worked each week, however, rose a tick to 34.6 hours and matched a post recession high. The labor-force participation rate, meanwhile, edged up to 62.8% from 62.7% as more people looked for work. Employment gains for September and August were revised up by a combined +31,000. The government said the +256,000 new jobs were created in September, up from a preliminary 248,000. August's gain was raised to 203,000 from 180,000.
Friday, October 31, 2014 4:07
After hitting its new all time at the end of September the market fell for 19 days hitting a low on October 15th down -9.5%. In 12 days the market has now hit new highs from intraday lows up +11% because the world has become a perfect place! This is unbelievable volatility and is confirmed by the fact that the Dow broke a 100-year record today of making a new high after breaking back through its 50-day moving average. The way its looking is if we see this continue the Dow should be above 25,000 by year end! Of course this isn’t going to happen and we’ll likely see volatility return to at least seeing choppy trading higher. Nothing has changed in the world economy wise as were seeing slow growth, earnings are still flattening so P/E ratios are rising and there is still lots of unrest amongst the world. The biggest thing though is that technically the market is so incredibly overbought its hard to believe actually. For example the NYSE McClellen Oscillator, hasn't been this high, (overbought) since July of 2011, when the S&P 500 fell from 1,345 to 1,123, -16.5% in 4 terrifying weeks. The question is what will start it as the Fed announced it is stopping its stimulus program but the Bank of Japan announced overnight that they were going to throw everything but the kitchen sink at the market so the Japanese market rallied hard and thats why we moved up today. What happens after everything is digested over the weekend will be interesting.
Today the Dow saw highs of +210.00 points, S&P 500 +23.00 points and the Nasdaq +80.00 points. At the close the Dow was up +195.00 points to 17,391.00, S&P 500 +23.00 points to about 2018.00, S&P 100 +10.00 points to 896.00 and the Nasdaq Composite +65.00 points to about 4631.00. Oil remains under pressure down -$.60 now around the $80.00 level after being below it .
Thursday, October 23, 2014 4:07
One week ago the market was coming off the worst day in quite sometime hitting its lowest point and reversed intraday to start this 8 day, +8% rally! It looked like the rally was over yesterday as there was a terrorist attack in Ottawa Canada that went on all day as the RCMP hunted down the losers who killed Canadian soldier, Cpl. Nathan Cirillo who was guarding their war tomb memorial. Our thoughts go to his friends and family! Must say it was very cool to hear that at a NHL Philadelphia Flyer, Pittsburgh Penguin game they sang the Canadian anthem before their game. The market was also dealing with the fact that oil almost fell below the $80 level. At its lows the Dow was off -170.00 points, S&P 500 -16.00 points and the Nasdaq -45.00 points. It seemed to be a one day wonder however as the market opened strong today with the Dow seeing highs of +310.00 points, S&P 500 +36.00 points and the Nasdaq +100.00 points. At the close the Dow was up +217.00 points to 16,678.00, S&P 500 +24.00 points to about 1951.00, S&P 100 +10.00 points to 867.00 and the Nasdaq Composite +70.00 points to about 4253.00. Oil remains underpressure but up today +$1.46 now around the $81.90 level.
The market is now at a turning point because if volatility is going to return this will be the place we should start to see it. Many bulls are already calling that it was a V bottom recovery and were onward to new highs. This may be the case but the question is if it will be a straight up affair or will volatility start to take over and we move up under normal market conditions. Have things changed that much in a week, is the economy not slowing, lowering profits for companies, obviously terrorism is still happening and Europe is still near recession. Oil continues to be a center of attention as it is under so much pressure falling -$2.00 yesterday back to the $80 level. Even today the market lost alot of gains to end the day because a doctor in New York reported ebola symptoms. The coming week will be an interesting tell!!
Wednesday, October 15, 2014 4:07
Ouch, the market gapped down this morning on new worries about a third Ebola victim and retail sales turning negative instead of an expected positive reading. Within 10-minutes the Dow saw lows of -370.00 points, S&P 500 -41.00 points and the Nasdaq Composite -90.00 points. It bounced after this though cutting losses in half but then drifted lower until midday with the Dow seeing -460.00 points, S&P 500 -57.00 points and the Nasdaq -110.00 points. No those aren’t miss prints. Its actually not that bad because the market is so high it just seems like a lot. For the Dow thats only -48.00 points away from the October 1987 -508.00 point crash which back then was actually -22%, this was only -2.8%. The final hour appeared to see that there was a cure found for Ebola as the Russell 2000 small cap indice went positive and tech stocks almost made it. Unfortunately it was still down at the close though with the Dow off by -174.00 points to 16,141.00, S&P 500 -15.00 points to about 1863.00, S&P 100 -9.25 points to 831.00 and the Nasdaq Composite -12.00 points to about 4215.00. Oil has been getting killed of late down a hard -$.30 now around the $81.60 level.
Retail sales declined in September even when factoring out weakness at auto dealers and gas stations, providing a surprisingly cautionary sign for the strength of consumer demand. Total retail sales dropped -0.3% during the month. Analysts had expected a fall in retail sales, as auto production has slowed and oil prices have fallen sharply in recent months on signs of slowing global economic growth because there is such a huge supply of oil out there. What came as more of a surprise was a drop in so-called core sales, which strips out automobiles, gas, building materials and food services, and correspond most closely with the consumer spending component of gross domestic product. Economists had expected the reading to increase. Instead, it fell -0.2%.
At 2:00 p.m est it was reported that despite the sell off in markets, the Fed believes economic growth is progressing at a "modest to moderate" pace. The Fed's “Beige Book” of economic conditions indicate officials there believe growth to be a modest to moderate pace, with consumer spending improving at a slight to moderate pace. Other details from the report show New York retailers optimistic, with upbeat reports on tourism and most districts showing better real estate growth. Also, banking and employment conditions are expanding.
Tuesday, October 14, 2014 4:07
Volatility has continued as we ended last week on a sour note taking the market down for the third week in a row, the first time this has happened since 2011. Yesterday the market was looking to bottom after a poor start to the day as it reached into positive territory for a short time but a rumor out that there was a plane being held from take off because of a possible Ebola case sank the market in the final thirty minutes about -1.5%! As of yesterday we are now mixed for the year with the Dow off about -1% and the S&P 500 and Nasdaq basically flat! This is very interesting considering that earnings although getting average have been okay so the market should at least be a little higher. The market is concentrating on emotion a little bit too much of late now, but thats ok as it has created volatility. Are we in for a crash, I cant see that but its great to see this volatility that could continue well into next year!!
This morning there was a bounce attempt at trying to take back that final 30 minute loss and going into lunch hour the Dow saw highs of +150.00 points, S&P 500 +24.00 points and the Nasdaq +70.00. From there it drifted lower and lower though and the final hour saw lows hit with the Dow seeing -50.00 points, S&P 500 -4.00 points and the Nasdaq -5.00 points. At the close the Dow was down by -6.00 points to 16,315.00, S&P 500 +3.00 points to about 1878.00, S&P 100 -.50 points to 840.00 and the Nasdaq Composite +13.00 points to about 4227.00. Oil has been getting killed of late down a hard -$3.30 now around the $82.00 level.
One of the reasons the market is starting to struggle is because the dollar has strengthened so much in recent weeks, so the performance of stocks in the S&P 500 most dependent on overseas revenue has collapsed. While the S&P 500 may not be correlated to the dollar and the translation may be dismissed as accounting, dollar strength is important because it is a symptom of decelerating international economic growth. This is particularly true for Europe, which is the second largest market for S&P 500 companies. European growth has continued to slow and the 2014 GDP estimate is now just +0.7%. Outside of Europe, China has slowed, Japan is growing at just +1.1%, and Brazil is grappling with recession.
Friday, October 3, 2014 4:07
Once again the market came back and saw a very volatile day as the Dow was down -120.00 points, S&P 500 -11.00 points and the Nasdaq -40.00 points early on in the morning but as we got closer to the Fed releasing the minutes from their last meeting it started to rally with the Dow seeing highs of +295.00 points, S&P 500 +36.00 points and the Nasdaq +90.00. At the close the Dow was up by +275.00 points to 16,994.00, S&P 500 +34.00 points to about 1969.00, S&P 100 +15.00 points to 880.00 and the Nasdaq Composite +34.00 points to about 4469.00. Oil was down -$1.12 now around the $87.00 level.
This was the biggest one day gain of the year for the market and week for that matter but it has basically only taken it back to where it started the week. The Fed’s minutes did help a lot though as they read that several top officials wanted to rewrite their guidance that short-term interest rates were likely to stay low for a “considerable time,” but held off in part because of concerns that the market would view it as a fundamental shift in policy. They also showed the Fed is still very concerned with global growth slowing so obviously they aren’t looking to increase rates soon. We know they will eventually, but today made it seem like it could be later than sooner. This has been confirmed by a report just released by the IMF saying that "The International Monetary Fund slightly lowered its outlook for global economic growth this year and next, mostly because of weaker expansions in Japan, Latin America and Europe." This may be true as earnings estimates have been steadily dropping the past month for our companies due to the rise in the dollar and this slowing growth. As we started earnings season today with Alcoa beating on its lowered forecasts, we’ll see how the market reacts as this may be the next obstacle for the market to overcome. This one day rally may just be that,,,, better to see how the week ends to know for sure!
Friday, October 3, 2014 4:10
The market has seen volatility kick up this past week and was down -2% overall yesterday but todays bounce from an oversold condition helped to relieve it quite a bit. There is no real bad news out that caused it which is interesting as the Ebola scare is contained, ISIS was quiet this week on the terrorist front and Russia hasn’t been talking about invading anyone of late. Even economic data has been pretty good, especially this mornings employment report. Data hasn’t been great however and earnings are still expected to only be average for these valuations so we’ll see if volatility sticks or the computers take over for another attempt at new highs next week.
Today the Dow saw highs of +230.00 points, S&P 500 +25.00 points and the Nasdaq +60.00. At the close the Dow was up by +206.00 points to 17,009.00, S&P 500 +22.00 points to about 1968.00, S&P 100 +10.00 points to 879.00 and the Nasdaq Composite +45.00 points to about 4476.00 to end the week on the downside by about -.75%. Oil has been getting killed of late with it well below the $100 level down -$1.25 now around the $90.00 level.
Jobs growth accelerated in September and hiring in August was much stronger than initially reported, reflecting an economy that entered the fall with growing momentum. There were +248,000 jobs outside the farm sector, topping the economist forecast of +220,000. Gains in hiring, along with more people dropping out of the labor force, also helped push the unemployment rate down to 5.9% from 6.1% to mark a six-year low. The last time the jobless rate was below 6% was in 2008 but again does it count if you’ve fallen out of the workforce!
Professional jobs increased by +81,000 while retailers, health-care providers and construction companies also posted strong job growth. Jobs gains were widespread. The amount of time people worked each week also rose a tick to 34.6 hours to reach a post recession high. Hours worked usually rise when the economy strengthens. Yet average hourly wages fell a penny to $24.53, reducing the 12-month increase to 2% from 2.1%. Slow wage growth continues to hold economic growth back despite widespread signs of progress. It’s also an area that Fed Chairwoman Janet Yellen has specifically cited as needing improvement.
Employment gains for August and July, meanwhile, were revised up by a combined +69,000. So far in 2014 the economy has gained an average of +227,000 jobs a month, up +17% from the 2013 pace of +194,000. The strong September employment report as well as upward revisions in hiring in August and July leads to a growing sense the Fed will raise interest next rates next year and this may be why were starting to see volatility kick up in the market. The Fed has been waiting for more signs of progress in the labor market before raising rates for the first time since 2008.
Friday, September 19, 2014 4:07
The market looked like it was going to continue to correct this week as it was expected that the Fed may become more hawkish on their outlook after their meeting on Wednesday, there was the Scottish vote for independence on Thursday/Friday and then the huge Alibaba offering coming out Friday morning. It was also not that oversold technically. Monday and Tuesday were lower but a rumor hit Tuesday afternoon from Jon Hilsenrath of the Wall Street Journal who is highly respected for reporting on the Fed hinting that they will not raise rates for awhile, maybe not even until 2015 or 2016 so the market rallied and continued to do so until after expiration started Friday morning. Early on with the S&P 500 options and futures contracts expiring the Dow saw highs of +100.00 points, S&P 500 +9.00 points and the Nasdaq +20.00 points all at new yearly highs. It didn’t hold though as the rally was thin and at the close the Dow was only up by +15.00 points to 17,280.00, S&P 500 -1.00 points to about 2010.00, S&P 100 +1.00 points to 900.00 and the Nasdaq Composite -24.00 points to about 4580.00 to end the week. Oil has been getting killed of late with it well below the $100 level down -$.41 around the $93.00 level.
Another week of gains for the market on thinner and thinner volume and yet still little volatility. The market is becoming precarious as one of these days some news event is going to drop it like a rock and as we get into the end of September and into the much dreaded month of the October it becomes more likely that its going to happen. With no big events coming out next week it will be interesting to see how the market reacts to earnings as they start to dribble out....
Friday, September 12, 2014 4:07
The past five weeks have seen the market higher and earlier on in the week it was on track to making a new high but after Apple released the new iPhone it seemed to concentrate more on how the Fed is expected to announce next week that its going to change its policy to a tightening mode sooner than later so it started to sell off. Today the Dow saw lows of -120.00 points, S&P 500 -18.00 points and the Nasdaq -40.00 points midday but came back a bit at the close to end the week on the downside for the first time in five weeks. At the close the Dow was down by -61.00 points to 16,988.00, S&P 500 -12.00 points to about 1986.00, S&P 100 -4.00 points to 883.00 and the Nasdaq Composite -24.00 points to about 4568.00 to end the week. Oil has been getting killed of late with it well below the $100 level down -$.60 around the $92.00 level.
Yes the Fed is creating liquidity for the market via allowing banks to borrow from the Federal reserve bank, which they hope helps have a psychological impact on people. But just like other bull markets it can’t stay up forever especially when it becomes a stock bubble as economic gains are falling. The current bull market has the S&P 500 up by +45% in the past 2 years alone, whereas corporate earnings have increased less than +10%. GDP increases are average but increasing, the jobs situation is pathetic, with more people without jobs than ever so it is not fundamentals pushing the bull market. Ben Bernanke, Janet Yellen, and Alan Greenspan have explicitly stated within the last few months that stock markets are not in a bubble and thats not good. History shows their track record on such predictions is embarrassing, which has left both Greenspan and Bernanke grasping for excuses after previous bubbles burst on their watch. Soon it will be Janet Yellen's turn to backpedal, as there is simple-yet-compelling evidence that stock markets are indeed right now in an unsustainable growth pattern because of the Feds liquidity feeding.
Strangely it turns out the most valuable skill needed to identify a bubble in financial markets is the ability to count to 64. All the "name-brand" market bubbles in history have lasted 64 months from initial growth to blow-off top. This includes the 3 biggest bubbles in modern market history:
- the Dow into the 1929 peak
- the Nikkei into the 1989 peak
- the Nasdaq 100 into the 2000 peak
This also includes more recent bubbles, such as home-builders into 2005, and crude oil into 2007. So if it's an unsustainable growth pattern heading for a crash, it carries this 64-month time signature. So I guess the question is where are we now then? We just entered our 65th month coming into fall where the market has been known to struggle through. So why 64 months? Why that specific number? The short explanation is because this is aligned with whats called fractal scaling constant, that can be observed in all facets of life. In market trading there are 64 - 65 trading days in 3 calendar months (one season). These patterns work across all timeframes. A 64-day growth pattern is seen frequently during strong market uptrends, and it can also be readily observed on hourly charts, and even 5 minute charts. It's called fractal scaling. It's there to be observed by simply counting. This is bad news for the bulls on this current 64-month pattern as it means its times up on this pattern. The good news for the bulls was that there was this end of the stage bubble pattern this year. Frequently there is a broad double top, and the configuration of timing of this particular 64-month growth pattern does suggest a double top is in store. That is what we have seen since early July as we are literally right where the S&P peaked the first week of July. In the end the rest of September and October could be very interesting trading months for the market!!
Friday, August 15, 2014 4:07
This was looking to be a pretty good week for the market going into expiration today as it was quite oversold at the start of the week. Even today the market started strong with the Dow seeing highs of +50.00 points, S&P 500 +9.00 points and the Nasdaq +30.00 points. When it came across the wires that Ukraine attacked a Russian convoy the market immediately fell with the Dow seeing lows of -140.00 points, S&P 500 -14.00 points and the Nasdaq -30.00 points. Interestingly it came back quite a bit to end the day mixed and see a +1% gain for the week, but on ever dwindling volume! At the close the Dow was down by -51.00 points to 16,663.00, S&P 500 -.10 points to about 1955.00, S&P 100 -.70 points to 868.00 and the Nasdaq Composite +12.00 points to about 4465.00 to end the week. Oil closed up but still below the $100 level +$1.44 right around the $97.00 level. Earlier on in the day it was lower until the Ukraine attack.
Volatility is looking to be here for a while as we start to move into the fall trading season. Volume is super light right now which isn’t helping and thats likely due to final holidays in the Hamptons but nonetheless not a good sign. A good reason may also be because as noted this week Japan's economy suffered its worst second quarterly contraction since 2011 as consumer spending on big items fell in the wake of a sales tax rise. Gross domestic product shrunk by an annualized -6.8% in the three months ended June, Japan's Cabinet Office reported this week. The result was actually better than the -7% contraction expected by economists. On a quarterly basis, Japan's GDP dropped by -1.7% as business and housing investment declined. Japan's economy last suffered a hit of this size in 2011 after their tsunami and nuclear disaster so this is a real bad sign.
Japan's consumption tax was increased to 8% in April in a bid to improve the country's fiscal position. If needed, the government has the option to implement an additional increase to 10% by 2015. Earlier in the year, consumers responded in a big way, bringing forward big purchases which helped first quarter numbers but now that the sugar rush is over, economists had expected Japan's growth rate to slow but not this much. The country has continued to struggle with falling prices and a strong yen for years and although its helped their stock market, their real economy is obviously hurting! Negative interest rates sure aren’t helping anywhere! Japans GDP negative, Germans GDP is waning as euro zone’s largest economy, contracted -0.2% in the last quarter. France’s economy, euro zone’s second largest economy, failed to record any growth for the second successive quarter. Italy’s economy also contracted in the second quarter, by -0.2%. The sluggishness is keeping unemployment high and inflation low, increasing pressure on the European Central Bank to lower its outlook for economic growth and take more action to bring inflation closer to its 2% target from around 0.4% currently.
We also saw a negative GDP quarter this year due to “poor weather” and has since rebounded but since then retail sales have continued to fall as people just don’t have the cash. 70% of GDP is about retail purchases! Babyboomers are slowing down on their purchases and gas and this is why were seeing oil well below $100 now! There was a report out this morning about how car manufacturers are storing their unsold new cars on runways because boomers are holding onto their cars longer as the peak 70 year old boomers don’t need to drive as much anymore.
It was also reported that U.S. household consumer debt sees the average credit card debt at $15,480, Average mortgage debt: $156,474, Average student loan debt: $33,424. In total, American consumers owe $11.74 trillion in debt, $872.2 billion in credit card debt, $8.24 trillion in mortgages, $1,131.7 billion in student loans. The fall could see some interesting trading days!!
Friday, August 8, 2014 4:07
The market saw some pretty good volatility this week with it starting strongly higher but then down hard midweek with poor news geopolitically, but then ending today with strong gains as it appeared that President Obama would do little more then airstrikes in Iraq and Russia and Ukraine were quiet all day. Its not surprising as it is getting quite oversold even in the midterm so it will be interesting to see how the rally develops as we move back towards old highs. If we do see extreme overbought levels we’ll likely see more sideways action going into the fall! The Dow saw highs of +200.00 points, S&P 500 +23.00 points and the Nasdaq +40.00 points. At the close the Dow was up by +186.00 points to 16,554.00, S&P 500 +22.00 points to about 1932.00, S&P 100 +9.00 points to 858.00 and the Nasdaq Composite +35.00 points to about 4371.00 to end the week. Oil closed up but still below the $100 level +$.30 right around the $98.00 level.
Friday, August 1, 2014 4:07
This was an ugly week for the market as it was either flat or lower in the first part but as it became apparent that the strength of the economy was going to cause the Fed to tighten its free money policy and Argentina defaulted on its debt payments it really started to sell off with yesterday seeing losses of -2%. Today the Dow saw lows of -130.00 points, S&P 500 -15.00 points and the Nasdaq -50.00 points as it continued the slide but as the day wore on it rallied back a bit. At the close the Dow was down by -70.00 points to 16,493.00, S&P 500 -5.50 points to about 1925.00, S&P 100 -3.00 points to 560.00 and the Nasdaq Composite -17.00 points to about 4352.00 to end the week. Oil closed down well below the $100 level -$.59 right around the $97.60 level. It was good to see the market have a decent correction this week as it was sorely needed to get it back in check. Will this be the end of it, unlikely, as reality is starting to set in. This is a good thing and great for trading as the volatility will prepare the market for a further advance in the future. I wouldn’t be surprised to see a bounce next week though as it is now technically quite oversold in the short term.
Standard and Poor’s was saying Argentina is in default and last-minute plans to remedy the situation fell through and investors focus was turning to whether holders of $29 billion of bonds will demand immediate repayment. The nation missed a deadline Wednesday to pay $539 million in interest after two full days of negotiations failed to produce an accord with creditors from its last default in 2001. A judge ruled that the payment couldn’t be made unless those investors, a group of hedge funds led by Elliott Management Corp., got the $1.5 billion they claimed.
This morning it was reported that employment was up 209,000 jobs for the sixth straight month, signaling the economy is likely to sustain its momentum through the summer months. Although hiring tapered off after a +298,000 gain in June, there have been at least +200,000 jobs in six straight months for the first time since 1997. Every major sector of the economy added jobs and hiring was particularly strong in the professional ranks, construction and manufacturing all sectors that pay above the average national wage. The unemployment rate, meanwhile, rose slightly to 6.2% from 6.1% despite another strong month of hiring. More people entered the labor force in search of work to push the rate higher, but that’s usually a good thing. It typically a sign that people think more jobs are available. One thing that is interesting is that the nation’s largest small-business lobbying group, for instance, said employment has risen 10 straight months for the first time since 2006. And a weekly report that tracks how many people apply for jobless benefits recently hit a 14-year low. The acceleration in hiring has fueled renewed optimism that the economy is ready to experience a more rapid phase of expansion after years of agonizingly slow growth and a prolonged period of high unemployment.
It wasn’t all positive though. Wages barely grew, for instance, and there was little change in the number of people who’ve been out of work for at least six months or who can only obtain part-time work. Sluggish wage growth is a big reason why the economy continues to grow well below its historical average of +3.3% a year. Average hourly wages rose just a penny to $24.45. They have risen +2% over the past 12 months, but that’s unchanged from the start of the year. Analysts say wages have to rise much faster to speed up an economy that has grown at a lackluster 2% annual pace since 2011. The number of hours people work each week, another telltale sign of economic progress, was unchanged in July at 34.5. Even with hiring on the upswing, millions of people still can’t find work or they have to work part-time to get by. The number of long-term unemployed, those without a job for six months or longer was virtually flat at 3.2 million. The number has been falling steadily since hitting an all-time high of nearly 7 million a few years ago, but it’s still markedly higher than the previous precession record. Some 7.5 million Americans also say they can only find part-time jobs. That’s also much higher than the historical average. The so-called U6 unemployment rate that includes people who can only find part-time work and those who recently gave up looking rose to 12.2% from 12.1%. The labor force participation rate, meanwhile, climbed a bit to 62.9%, the first increase in four months. The participation rate reflects the percentage of people who hold a job or are looking for one. Employment gains for June and May were revised up by a combined +15,000. Some ±298,000 new jobs were created in June, up from a preliminary +288,000, based on newly available data. May’s gain was revised up to +229,000 from +224,000.
It was also reported on Wednesday that the economy came back to life in second quarter and expanded at the fastest pace since last fall, fueled by a upturn in consumer spending on big-ticket items such as cars and trucks as well as a sharp rebound in business investment. Gross domestic product, the value of all goods and services produced by the U.S grew at a +4% annual clip in the second quarter, the government said. Newly revised figures also show that the economy contracted by a somewhat smaller +2.1% in the first quarter instead of +2.9% as previously reported. Economists predicted GDP would grow by a seasonally adjusted +3.2% in the April-to-June period. The rebound in growth offers further proof that a plunge in first-quarter GDP was an outlier. The economy contracted sharply in the first three months of the year mainly because of an unusually harsh winter and a decline in health-care spending tied to the introduction of Obamacare.
Friday, July 25, 2014 4:07
The week was full of geo politics with Ukraine, Russia, Israel and the Gaza strip seeing lots of action but the market didn’t really react to any of it with today being the first seeing real selling with the Dow off -170.00 points, S&P 500 -15.00 points and the Nasdaq -45.00 points at one point midmorning. One of the biggest harbingers for the day was that Visa reported decent earnings but their outlook for sales wasn’t very good. At the close the Dow was down by -123.00 points to 16,960.00, S&P 500 -10.00 points to about 1978.00, S&P 100 -5.00 points to 880.00 and the Nasdaq Composite -23.00 points to about 4450.00 to end the week. Oil closed up +$.02 right around the $103.00 level. There has been little change to the market in the past week as traders are having a hard time pushing it any higher with all of the things going on around the world and because it remains technically overbought. Volume continues to wane with all of this indecision and one of the biggest problems is the market hasn’t even had a -2% correction since April so it is way overdue. Until it can see some decent selling pressure and get decently oversold to start a new advance, its likely to remain in this sideways type of action for some time to come.
Friday, July 18, 2014 1:58
The market finally saw some volatility this week after rising the first three days of the week although Wednesday saw some downside action at first as the market didn’t like the Fed’s minutes that were released and the fact that Fed chief Janet Yellen said she felt that small cap stocks and social media stocks were over valued. The market bounced back though but on Thursday when a Malaysian passenger jet was shot down over Ukraine by Russian separatist terrorists the market started to sell off. Later in the afternoon when Israel announced they were moving ground forces into the Gaza strip it sold off even more with the Dow closing at lows of 161.00 points, S&P 500 -24.00 points, Nasdaq -63.00 points, overall about -1%. Today because the market was short term oversold and it was expiration, it bounced making up almost all of what it lost yesterday and closed the week on the upside. The Dow was up by +123.00 points to 17,100.00, S&P 500 +20.00 points to about 1978.00, S&P 100 +9.00 points to 880.00 and the Nasdaq Composite +69.00 points to about 4432.00 to end the week. Oil closed down -$.20 right around the $103.00 level.
The market is at an interesting place with geopolitics heating up around the world and it is starting to see the light at the end of the tunnel when it comes to the Fed’s free money policy ending in October!! Brrrr don’t wanna think about that just yet!! There is also three in five financial professionals saying the market is on the verge of a bubble or already in one, a Bloomberg Global Poll found. Institutional investors are also noting that more buying is now being done by individual retail investors and the mutual funds and ETFs that work for them. Bloomberg Data reports $100 billion has been added to equity mutual funds and exchange-traded funds in the past year, ten times more than the previous twelve months. When retail comes in, the conventional wisdom is that the end may be near.
The markets have gone too far and a market slide could happen at any time despite all the bullish “talking heads,” This is why I believe August will at least be a volatile time for the market and then maybe a bigger correction in fall. We all know the markets have been pumped up by the Fed and it cannot go on forever and all know the markets are getting overextended as earnings are starting to slow. This is why so many big cap companies are at record levels buying back there own stock, it helps on the earning front! On the other side, its the big CEO’s that are selling their stock to their own companies, another bad sign. The only thing is that we also know there has never been a time in history of such extended zero borrowing costs staying at these levels for so long but according to the Fed’s plan that will end soon so the question is; does the market sell off in anticipation or wait until the first rate actually does happen.
The Fed revealed in the minutes of its June meeting released Wednesday that it has decided to end its asset-purchase program in October if the economy stays on track. According to the new plan, the Fed will make a $15 billion final reduction at its October meeting, after cutting it by $10 billion at each meeting up to that point. Fed officials said that members of the public had asked them if the Fed would end the program in October or with a final $5 billion reduction in December. Most Fed officials said that the exact end of the tapering issue will have no bearing on the timing of the first rate hike. The Fed has said that rates would remain near zero for a “considerable time” after the Fed halts its program of bond purchases. An end of the asset purchases will set the clock on eventual tightening which could start as soon as March 2015. The minutes also revealed that Fed officials had a lengthy discussion of its exit strategy. The central bankers generally agreed to keep reinvesting the proceeds of securities that mature on its balance sheet until after it had hiked interest rates. Fed officials also agreed that the rate of interest on excess reserves would play a “central role” in moving rates higher when the time comes. It will have an overnight reverse-repo facility. A reverse repo is when the Fed accepts cash from counter parties such as banks and money-market funds on an overnight basis in return for a security. Responding to some criticism that the Fed’s overnight repo facility might become too large and drown out private market participants, the central bankers discussed some design features that might limit its size. Several Fed officials said that they don’t think the facility will become a permanent policy tool.
Friday, July 11, 2014 1:58
The market sold off pretty good this week, -1%, with Monday and Tuesday down and then a slight bounce Wednesday before seeing a sharp lower gap Thursday with the Dow off -180.00 points, S&P 500 -20.00 points and the Nasdaq -70.00 points after comments overnight from St. Louis Fed president James Bullard saying the Fed may raise interest rates sooner than investors expect and there was trouble from a Portuguese bank being able to pay for bond purchases it had made. Add in the fact that Japanese machine orders dropped -20% the Globex S&P futures dropped -1% overnight. It seemed like the sell off would continue but the market came back to cut losses in half by the close.
Today it also seemed to want to sell off as it was down again to start the day but by the close it came back once again on incredibly low volume indicating that the correction may not be done just yet!! The market is starting to bounce up against a top and there are many things it is dealing with from not being technically oversold yet, earnings coming in a little weaker than expected, the Fed saying its just about done with its free money policy and geo politics heating up so expiration week could be interesting! Here are some interesting stats to follow, July has closed lower 55% of the time in the last 20 years, volatility is up 80% of the time in July in the last 20 years and August is the worst performing month of the year, with a -1.2% average loss.
At the close the Dow was up by +29.00 points to 16,944.00, S&P 500 +3.00 points to about 1967.00, S&P 100 +2.00 points to 872.00 and the Nasdaq Composite +20.00 points to about 4415.00 to end the week. Oil closed down -$2.20 right around the $101.00 level.
The Fed revealed in the minutes of its June meeting released Wednesday that it has decided to end its asset-purchase program in October if the economy stays on track. According to the new plan, the Fed will make a $15 billion final reduction at its October meeting, after cutting it by $10 billion at each meeting up to that point. Fed officials said that members of the public had asked them if the Fed would end the program in October or with a final $5 billion reduction in December. Most Fed officials said that the exact end of the tapering issue will have no bearing on the timing of the first rate hike. The Fed has said that rates would remain near zero for a “considerable time” after the Fed halts its program of bond purchases. An end of the asset purchases will set the clock on eventual tightening which could start as soon as March 2015. The minutes also revealed that Fed officials had a lengthy discussion of its exit strategy. The central bankers generally agreed to keep reinvesting the proceeds of securities that mature on its balance sheet until after it had hiked interest rates. Fed officials also agreed that the rate of interest on excess reserves would play a “central role” in moving rates higher when the time comes. It will have an overnight reverse-repo facility. A reverse repo is when the Fed accepts cash from counter parties such as banks and money-market funds on an overnight basis in return for a security. Responding to some criticism that the Fed’s overnight repo facility might become too large and drown out private market participants, the central bankers discussed some design features that might limit its size. Several Fed officials said that they don’t think the facility will become a permanent policy tool.
Friday, June 27, 2014 4:10
The market was looking like it would end the week on a sour note wit the Dow seeing lows of -70.00 points, S&P 500 -5.00 points and the Nasdaq -10.00 points but a final hour push brought it back at the close with the Dow up by +6.00 points to 16,851.00, S&P 500 +4.00 points to about 1961.00, S&P 100 +2.00 points to 867.00 and the Nasdaq Composite +19.00 points to about 4397.00 to end the week mostly flat to down. Oil closed down -$.35 right around the $106.00 level.
The market was looking like it was going to have a really bad week because it was reported that the economy contracted by -2.9% in the first quarter, making it the biggest decline since early 2009 when the Great Recession was winding down. It was previously estimated to have fallen -1% in the first three months of the year, a period marked by unusually harsh winter weather which kept many workers home. This was the largest decline in GDP during a period of economic expansion since 1956!! The even sharper decline in gross domestic product largely stems from lower consumer spending, mainly on health care. The government marked down the increase in consumer spending, the main engine of economic activity to a measly +1% in the first quarter from +3.1%. Final sales of produced goods and services, meanwhile, was revised down to show a -1.3% decline instead of a +0.6% increase. This being one of the worst 25 reports since 1949 indicates that there will for sure be a recession hit sometime this year which is interesting. Strangely the market originally fell on the news Wednesday but bounced back by the close to finish the day higher. Gotta thank the Fed for all of its free cash infusion helping to hold up the continuous pressure that is mounting on this market to fall. Eventually those supports will fail and we’ll see an actual correction occur I’m sure!!
Tuesday, June 24, 2014 4:10
The market has been marching to new highs every day this past week and even today saw the S&P 500 set a new intraday high at the 1968 level with the Dow seeing highs of +40.00 points, S&P 500 +9.00 points and the Nasdaq +35.00 points. Strangely plain old profit taking took hold midday and the final hour saw lows on the Dow of -140.00 points, S&P 500 -15.00 points and the Nasdaq -30.00 points. At the close the Dow was down by -120.00 points to 16,818.00, S&P 500 -13.00 points to about 1950.00, S&P 100 -6.00 points to 861.00 and the Nasdaq Composite -18.00 points to about 4350.00. Oil closed down -$.35 right around the $106.00 level.
The market is at an interesting crossroads as it has had this continuous momentum to the upside on waning volume and internal technicals continuing to worsen. Even fundamentals are getting bad as Q1 saw $154.5 billion in share buybacks. This has only been topped twice and that was in Q2 & Q3 of 2007, the peak of the last major bubble. Strip-out share buybacks and there was no earrings growth in Q1 2014 vs Q1 2013. Indeed there has been virtually no earnings growth for the past 2.5 years when adjusted for share buybacks. Then if you take a 2-quarter average of insider selling, and shift it back 1 quarter, you’ll see an interesting correlation. While corporate managers were frantically buying-up expensively priced shares (with company money) to keep earnings per share elevated as long as possible in 2007, they were dumping the same shares they owned personally. The same thing happened before the crash in 2011 and is happening now. Something to think about!
Home prices rose in April as the spring selling season got underway, even as annual growth fell, dropping to the slowest pace in more than a year, according to data released this morning. S&P/Case-Shiller’s price barometer tracking 20 cities showed that year-over-year price growth hit +10.8% in April, a fast pace but down sharply from annual growth of +12.4% in March and a recent peak of +13.7% in November. Limited inventories have been exerting upward pressure on prices over the past year. But a tough winter, as well as expanding inventories and dropping affordability, are all putting a damper on California’s ultra-hot markets and elsewhere. Among the 20 cities, 19 saw annual growth taper in April. Also, Case-Shiller reported that its monthly gauge of home prices rose +1.1% in April, a second consecutive gain as the spring selling season got underway, with all 20 tracked cities posting higher prices. After seasonal adjustments, home prices among the 20 cities rose +0.2% in April, compared with +1.2% in March.
New homes sold at an annual rate of 504,000 in May to mark the highest level in six years. Yet the surprising gain, economists expected a 440,000 increase was led by a huge surge in the Northeast. The region typically has the fewest sales and the seasonally adjusted numbers can be particularly volatile. Just a month before in April, for instance, sales in the Northeast were the smallest in almost two years. Meanwhile, sales climbed 34% in the West and 14.2% in the South. A bounce back after a winter-induced lull may have boosted sales in the warmer spring months Sales rose just +1.4% in the Midwest, however. The median price of new homes rose +4.6% to $282,000 last month. The supply of new homes on the market dropped to 4.5 months at the current sales pace from 5.3 months in April. New home sales were +16.9% higher in May compared to one year ago. In April, however, they were -6% lower, showing how erratic the report on new home sales can be.
A gauge of consumer confidence rose to 85.2% in June, the highest level since January 2008, from 82.2% in May. Economists had expected a June reading of 83.5%, compared with an original estimate of 83% in May. Both the present situation and expectations indexes rose in June. Consumers were more optimistic about the labor market.
Yesterday it was reported that rising for a second month, sales of existing homes grew +4.9% in May to a seasonally adjusted annual rate of 4.89 million. A strengthening labor market, expanding inventories and recent drops in mortgage rates are supporting sales, said Lawrence Yun, NAR's chief economist. Economists had expected a May sales rate of 4.75 million, compared with an originally reported April rate of 4.65 million. The NAR revised April's rate to 4.66 million. The median sales price of used homes hit $213,400 in May, up +5.1% from the year-earlier period. May's inventory was 2.28 million existing homes for sale, a 5.6-month supply at the current sales pace. Despite May's increase, the pace of sales was down -5% from a year earlier, hit by affordability that had trended down since the summer of 2013, among other factors. But recent economic improvements signal that sales rates may continue to pick up.
Thursday, June 12, 2014 4:10
Looks like the middle east is back in the news as al-qaeda-affiliated militants continue to move across northern Iraq. The move by Kurdish forces comes after Sunni militants took nearby Mosul, Iraq’s second-largest city, earlier this week. They’ve threatened Baghdad and have vowed to march on two cities held sacred by Shiite Muslims. Western parts of Kirkuk province are reportedly still under the control of other militants from an al qaeda offshoot called the Islamic State of Iraq and Al-Sham, or ISIS. The militants have vowed to advance on Karbala and Najaf, two cities revered by Shiite Muslims, who make up 60% of Iraq’s population and dominate the Iraqi government. This caused oil to jump +2% to 106.00 per barrel today.
Iraq is the eighth largest producer of oil and ranks #2 in OPEC just behind Saudi Arabia. once again. Production has been on the comeback since the height of the Iraq war hitting 3.6 million barrels a day in February, its highest level in more than 30 years but strangely even though oil is abundant around the world the price of it has barely gone down. Iraq’s production growth has been a welcome development for oil consumers as Libya struggles to come back online amid persistent violence. Now all this fighting casts big doubts over the government’s aim to boost output to 4 million barrels a day by the end of this year and to 7 million barrels a day by 2016. A sustained surge in oil prices would be unwelcome though as the global economy struggles to build some momentum and the reality is that a $20 a barrel spike in crude prices could be enough to stop or at least slow the global economic recovery. For the stock market this may be the excuse I was talking about the other day for a correction to start which would make a lot of sense.
The lows on the Dow were hit in the final hour -150.00 points, S&P 500 -18.00 points and the Nasdaq -50.00 points. At the close the Dow was down by -110.00 points to 16,734.00, S&P 500 -14.00 points to about 1930.00, S&P 100 -7.00 points to 855.00 and the Nasdaq Composite -34.00 points to about 4298.00. Oil closed up +$1.74 right around the $106.10 level.
It was reported today that Retail sales rose last month on strong demand for cars, trucks and home-improvement products, but spending tapered off at most other retailers after a big bump in demand in April. Despite the mixed report, the pace of sales in April and May taken together reflect an economy growing at a moderate pace in the spring after the sharp contraction in the first quarter. Retail sales account for about one-third of consumer spending, the main engine of economic activity. In May, retail sales rose a seasonally adjusted +0.3%. While the increase was smaller than the +0.7% forecast of economists, sales in April were revised to show a solid +0.5% gain instead of +0.1% as originally reported. Factoring in the April revision, the increase in sales in May was actually a bit larger than expected. With employment rising and many sectors of the economy on an upswing, analysts expect consumers to boost spending and help generate faster growth in the second quarter and beyond. Economists predict gross domestic product will accelerate to +3.7% in April-to-June period after an estimated +1% decline in the first quarter.
There were plenty of soft spots though, with sales falling in virtually every major category except autos and building materials. Sales declined at groceries, bars and restaurants, clothing outlets, electronic and appliance sellers, department stores and companies that sell sporting goods and hobby items. The May data show broad weakness outside of the jump in auto sales. Over the past three months, retail sales are up +4.3% compared to the same period in 2013. Yet retail sales have historically grown about +6% a year, a sign the economy is still not expanding as fast as it’s capable.
Jobless claims rose by +4000 to a seasonally adjusted 317,000 while economists had expected claims to total 310,000. The average of new claims over the past month climbed by +4,750 to 315,250, one week after falling to a seven-year low. The monthly figure smooths out the volatility in the weekly data and offers a better look at underlying labor-market trends. Initial jobless claims are a gauge of whether layoffs are rising or falling and changes in the number of people seeking benefits tend to correlate over time with how many jobs the economy is producing. Layoffs have fallen to the lowest level in years and job openings recently reached a post-recession high, suggesting that more work is available for the jobless but a lot of that is because so many people have fallen off the unemployment list. Continuing claims increased by +11,000 to a seasonally adjusted 2.61 million. Continuing claims reflect the number of people already receiving benefits and are reported with a one-week delay. Initial claims from two weeks ago, meanwhile, were revised up by +1,000 to 313,000.
Friday, June 6, 2014 4:10
The market finished the day at new record levels for the Dow and S&P 500 but couldn’t hold the highs of the day at the close. The Dow saw highs of +50.00 points, S&P 500 +6.00 points and the Nasdaq +25.00 points. At the close the Dow was up by +20.00 points to 16,943.00, S&P 500 +1.80 points to about 1951.00, S&P 100 +1.30 points to 864.00 and the Nasdaq Composite +14.00 points to about 4336.00. Oil closed up +$1.85 right around the $104.50 level.
The market continues to push higher on lower and lower volume and sentiment and technicals are at extreme levels. The overbought condition wouldn’t be to bad if volume was following along but its not so it indicates that one little thing could upset the apple cart. The question of course is what could that be but there's generally always something that could start some type of correction in the near term so we’ll see what happens this week.
On Friday it was reported that there were +217,000 jobs added in May and the unemployment rate held steady at 6.3%, suggesting that there is some type of economic expansion. Economists had expected an increase of +210,000 jobs. Employment gains for April and March were little changed. In May, professional services, health care, bars and restaurants and transportation added the most new jobs. Two key sectors that pay well, manufacturing and construction, only gained a combined +16,000 jobs however. Average hourly wages, meanwhile, rose +0.2% to $24.38, and they are up +2.1% over the past 12 months. The average workweek was unchanged at 34.5 hours. The labor-force participation rate was also unchanged at 62.8%, which matches a 36-year low and is terrible. The government said +282,000 new jobs were created in April, down slightly from a preliminary +288,00. March's gain of 203,000 was unchanged. So far in 2014 the economy has gained an average of +214,000 jobs a month, about 10% above the 2013 pace of +194,000 however it begs the question why President Obamas approval rating is now only 40%.
Monday, June 2, 2014 4:10
The market started the week on a mixed note after ending last weeks slightly on the upside. The Dow and S&P made new all time highs today on weakening volume as summer trading is starting to set in. The Dow saw highs of +30.00 points, S&P 500 +2.00 points and the Nasdaq +10.00 points. At the close the Dow was up by +27.00 points to 16,743.00, S&P 500 +1.50 points to about 1925.00, S&P 100 -.30 points to 852.00 and the Nasdaq Composite -5.00 points to about 4237.00. Oil closed down -$.27 remaining right around the $102.00 level.
Hmmm maybe things are getting worse as it appears retail is dying!! Wal-Mart Profit Plunges By $220 Million as US Store Traffic Declines by 1.4%, Target Profit Plunges by $80 Million, 16% Lower Than 2013, as Store Traffic Declines by 2.3%, Sears Loses $358 Million in First Quarter as Comparable Store Sales at Sears Plunge by 7.8% and Sales at Kmart Plunge by 5.1%, JC Penney Thrilled With Loss of Only $358 Million For the Quarter, Kohl’s Operating Income Plunges by 17% as Comparable Sales Decline by 3.4%, Costco Profit Declines by $84 Million as Comp Store Sales Only Increase by 2%, Staples Profit Plunges by 44% as Sales Collapse and Closing Hundreds of Stores, Gap Income Drops 22% as Same Store Sales Fall, American Eagle Profits Tumble 86%, Will Close 150 Stores, Aeropostale Losses $77 Million as Sales Collapse by 12%, Best Buy Sales Decline by $300 Million as Margins Decline and Comparable Store Sales Decline by 1.3%, Macy’s Profit Flat as Comparable Store Sales decline by 1.4%, Dollar General Profit Plummets by 40% as Comp Store Sales Decline by 3.8%, Urban Outfitters Earnings Collapse by 20% as Sales Stagnate, McDonalds Earnings Fall by $66 Million as US Comp Sales Fall by 1.7%, Darden Profit Collapses by 30% as Same Restaurant Sales Plunge by 5.6% and Company Selling Red Lobster, TJX Misses Earnings Expectations as Sales & Earnings Flat, Dick’s Misses Earnings Expectations as Golf Store Sales Plummet, Home Depot Misses Earnings Expectations as Customer Traffic Only Rises by 2.2%, Lowes Misses Earnings Expectations as Customer Traffic was flat.
This is very telling as there was record credit expansion last year which the government obviously thought would help consumer spending to skyrocket but instead only stock prices went up. Consumer spending has been ok and a bit stronger, but perhaps the growth rate caused some disappointment as it still didn't match 2007 or 2011 highs!!! Blame colder winter? It has been a tough environment for the retail sector. Retail sector stocks in the S&P 500 are down -5.3% year to date, which compares to positive +3.2% gain for the index as a whole in that same time period. Meanwhile retail may be down because New Home Sales for April's 433,000 is the second weakest rate of the last seven months while the mortgage applications index fell -3% in the May 16th week with the year-on-year at a very steep minus -12%.
This coincides with reports last week that the economy contracted in the first quarter for the first time in three years, hampered by harsh weather that disrupted business and slowed construction,,,supposedly!! The good news is that there are a few signs that growth has accelerated in the spring. Gross domestic product, the sum of all goods and services produced by the economy, shrank by annual pace of -1% in the first three months of 2014. Initially the government had reported last month that GDP rose at a seasonally adjusted +0.1% rate.
Either way things aren’t robust in any way right now and are looking to continue to remain slow through the summer but we’ll see. One thing that is also dying is volatility as the VIX, volatility index closed below 11.50 for the first time in 12 months last week. That has happened three other times on 3/14/2013, 12/22/2004 and 01/25/1993. In all three cases, the market continued to be in a low volume environment with not much progress on the upside and limited corrections on the downside. I’m thinking that this case may be very similar to the others for the summer and that will be great for out style of trading.
Thursday, May 22, 2014 4:10
So far the markets been up all week rallying today once again with the Dow seeing highs of +40.00 points, S&P 500 +9.00 points and the Nasdaq +40.00 points. At the close the Dow was up by +10.00 points to 16,543.00, S&P 500 +5.00 points to about 1893.00, S&P 100 +2.00 points to 840.00 and the Nasdaq Composite +23.00 points to about 4154.00. Oil closed down -$.25 remaining right around the $104.00 level.
The market has been up all week but still less than +!% as it continues to move in a sideways pattern on dwindling volume. The only thing keeping it up is the fact that volume is so low. At the same time the volatility index is also just coming off of new lows which can be a sign indicating it could heat up in the next little bit. As we approach the end of the month or the start of the new month with the employment report coming out we could see a sharp correction start if its not good news. The next couple of weeks could be very interesting in the market.
Friday, May 16, 2014 4:10
The market had an interesting end to the week! After hitting new highs on Tuesday, Wednesday was lower and yesterday it tanked with the Dow seeing lows of -210.00 points, S&P 500 -26.00 points and the Nasdaq -70.00 points and made little up at the close. Today it was lower once again but expiration related trading helped it to come back to see the Dow close up by +45.00 points to 16,491.00, S&P 500 +7.00 points to about 1878.00, S&P 100 +3.00 points to 832.00 and the Nasdaq Composite +21.00 points to about 4130.00. Oil closed up +$.65 remaining right around the $102.00 level.
Surprisingly, the market ended the week slightly higher but basically flat which is always a nice thing in our type of trading. The market continues to struggle at this upper level and will likely do so for a while to come as earnings aren’t that great, geo politics continue to be in the background and the economy is continually slowing sluggish times are ahead. We’re also entering the summer period of trading and “sell in May and go away” takes effect this could come true this year because the dwindling volume we also saw this week will likely get even worse!! Soooo, a sideways we will go which is perfect for us!!!
Tuesday, May 13, 2014 4:10
Today the Dow made an all time high and the S&P 500 moved over the 1900 level making a new intraday high for the year. The Nasdaq and small cap Russell stocks meanwhile have been falling of late as many big name companies such as Facebook, Tesla, Apple and even Google have struggled a bit. At the close the Dow was up by +20.00 points to 16,715.00, S&P 500 +.80 points to about 1897.00, S&P 100 +1.00 points to 841.00 and the Nasdaq Composite -14.00 points to about 4130.00. Oil closed up +$1.00 remaining right around the $102.00 level. Although were seeing new highs the problem is the entire market isn’t participating and volume is worse then during Christmas holidays along with advancing issues over decliners indicating there are fewer and fewer stocks holding it up. This to me says that we’ll continue this sideways action that started at the beginning of March likely through the rest of spring.
Small business sentiment in May rose to the highest level in more than six years, the National Federation of Independent Business said. Its small-business optimism index rose 1.8 points to 95.2%, the first time it’s surpassed the 95% level since Oct. 2007. There were gains in seven of the 10 components, notably a 9-point jump in those who expect the economy to improve. Nonetheless, NFIB Chief Economist Bill Dunkelberg said the reading “can only be characterized as a high-end recession reading.” Mark Vitner, senior economist at Wells Fargo Securities, said the 9-point gain “was likely influenced by the bounce back from unusually severe winter weather earlier this year.” The single-most important problem, at 22%, was taxes, followed by government regulations and red tape at 20%, and poor sales at 15%.
Consumers barely increased spending at retail stores in April after splurging in March following a brutally cold winter. Sales at retailers rose a small +0.1% in April. Consumer spending is the main source of economic activity and retail sales account for about one-third of the purchases. Yet sales in March were revised up to +1.5% from +1.1%, marking the biggest gain in four years. February sales were also slightly higher than originally reported. Americans boosted spending in March and February after harsh weather kept them mostly indoors during January and December. As a result, economists expected sales to slow in April. Yet the slowdown in sales was even sharper than expected. Economists had predicted a seasonally adjusted +0.4% increase. Sales at Internet retailers fell sharply for the second time in four months, down -0.9%. Internet sales have been one of the strongest retail sectors over the past decade, so the decline comes as a bit of a surprise.
Friday, May 2, 2014 4:10
It was an interesting end to the week as the market started the week strongly but then ended lower the past two days with a weekly gain of about +1%. It was surprising that the market closed down Friday as economic data revealed there were a strong +288,000 jobs created last month. The likely reason being is that it means the Fed will continue its tapering stance on free money so its on its own and with earnings coming in so so we’ll likely see sideways action for a while longer!! At the close the Dow was down by -46.00 points to 16,513.00, S&P 500 -3.00 points to about 1881.00, S&P 100 -2.00 points to 834.00 and the Nasdaq Composite -4.00 points to about 4124.00. Oil closed up +$.55 remaining right around the $100.00 level.
The trick is if you look past the headlines you can also see that a whopping -806,000 left the job market in April!! This is the main reason the unemployment rate fell sharply to 6.3% from 6.7% in March. The consensus forecast 6.6%. A low participation rate contributed to the rate decline. And the real underemployment rate declined to 12.3% from 12.7% in March. The labor market is showing improvement but a key question is how much is catch up from adverse weather. Total employment increased +288,000 in April after a +203,000 gain in March and a +222,000 increase in February. The net revision for the prior two months was up +36,000. Expectations for April were for +215,000. The other key number which is scary is that the labor-force participation rate sank to 62.8% from 63.2%, matching a 35-year low.
Nonetheless, the increase in hiring was widespread, with almost every major industry adding jobs. Professional jobs surged by +75,000 and retail, bars and restaurants and construction all posted big gains. Average hourly wages, meanwhile, were unchanged at $24.31 and the average workweek rose a tick to 34.5 hours, matching a post-recession high. So far in 2014 the economy has gained an average of 214,000 jobs a month, well ahead of the 2013 pace of 194,000. The economy was widely expected to show a faster pace of job creation in April, as warmer temperatures induced firms to add workers they might have hired earlier in the year if not for extremely harsh winter. What’s less clear is whether the momentum will continue as the spring back in hiring after the end of winter fades
Monday, April 28, 2014 1:05 p.m est.
Last week the market ended the week virtually where it started as it had continued the rally that started the week before but going into Wednesday with 6 straight days of gains volatility to the downside erased a lot of the gains. Friday the Dow saw lows of -170.00 points, S&P 500 -20.00 points and -80.00 points on the Nasdaq. At the close the Dow was down by -140.00 points to 16,361.00, S&P 500 -15.00 points to about 1863.00, S&P 100 -6.00 points to 825.00 and the Nasdaq Composite -73.00 points to about 4076.00. Oil closed down -$1.25 around the $100.70 level.
Once again this week looks no different for the market as earnings are still just ok, geo politics with Russia and Ukraine remain high and now the market is overbought in the short/intermediate term. Momentum is also waning as the market this morning tried to pop higher as it is the end of the month window dressing time when managers like to make the books look good so the Dow saw highs of +150.00 points, S&P 500 +14.00 points and the Nasdaq +40.00 points. Going into lunch time though the Dow cut its gains more than in half and the S&P 500 has been down as much as -2.00 points and the Nasdaq -40.00 points.
One of the things that started the market selling off last week was that sales of New single-family homes plunged last month, hitting the slowest pace since July. Sales of new single-family homes fell -14.5% to a seasonally adjusted annual rate of 384,000 last month, hitting the lowest level since July, with drops in three of four regions. Economists had expected a March sales pace of 450,000, compared with an originally estimated rate of 440,000 in February. New-home sales in March were down -13.3% from the year-earlier period, the first annual contraction since September 2011. Home sales have been restrained over the past year by rising mortgage rates and home prices, as well as low inventory. In recent months harsh weather likely also played a role, economists say. The Mortgage Bankers Association show that mortgage applications for home purchase remain lower, suggesting that higher interest rates and earlier price increases are having an impact on individual demand for homes, and also highlighting the fact that speculative demand continues to be the main driver of growth in the existing home market. Economists caution over reading too much into a single monthly home-sales report. In March, the confidence interval for sales was plus or minus -12.9%. Median home prices continued to climb, hitting $290,000 in March, up +12.6% from the year-earlier period. The supply of new homes on the market rose to 6 months at the March sales pace from 5 months in February also. For context, the average monthly sales pace reached almost 1.1 million over the five years leading up to the 2005 bubble peak. Also out earlier in the week was that Existing Home Sales showed that the sales pace ticked down in March to the slowest rate since July 2012, exhibiting weakness in the early spring sales season, though underlying trends signalled a firming in market fundamentals.
Today it was reported that A gauge of pending home sales rose +3.4% in March, the first gain in nine months, signaling that sales of existing homes may pick up. The index of pending home sales hit 97.4% in March, the highest reading since November compared with 94.2% in February. Despite March's gain, the gauge was down -7.9% from a year earlier. Low inventory, declining affordability and poor weather have hit the housing market in recent months. By region, March's gauge of pending home sales rose +5.7% in the West, +5.6% in the South and +1.4% in the Northeast. Meanwhile, the gauge declined -0.8% in the Midwest. Starting off with a weak first quarter, 2014's sales of existing homes will likely reach about 4.9 million, falling short of 5.1 million sales last year, according to NAR's forecast. Pending sales typically close within two months. An index reading of 100 equals 2001's average contract activity level.
Monday, April 14, 2014 4:10
Last week the market finished on a sour note being down about -1.5% for the week as volatility kicked up due to geopolitics with Russia and Ukraine, earnings forecasts were lowered and economic data was soft. Because of this there were many calls over the weekend for a huge sell off starting Monday but we know how those generally turn out. If everyone is going one way usually the opposite happens and today was no different as Citibank and a few other banking stocks had decent earnings so that was enough of an excuse to rally the market! The Dow saw quick highs of +160.00 points, S&P 500 +20.00 points and the Nasdaq +60.00 points but midday selling took hold and the Dow saw slight lows of -5.00 points, S&P 500 -1.00 points and once again tech stocks down quite a bit off -15.00 points on the Nasdaq. At the close the Dow was up by +147.00 points to 16,173.00, S&P 500 +15.00 points to about 1831.00, S&P 100 +7.00 points to 811.00 and the Nasdaq Composite +23.00 points to about 4023.00. Oil closed down -$.15 around the $103.50 level. This week looks no different for the market as these things still remain and it is an expiration traded week along with only a four day trading week so there are lots of reasons to move it back and forth.
Thursday, April 10, 2014 4:10
The market gave up all its gains from yesterday and made it a bad looking week as it sold off strongly today following poor economic data out of China. Lofty tech stocks also sold off hard with the Dow seeing lows of -190.00 points, S&P 500 -42.00 points and the Nasdaq -150.00 points and held it to finish the day. At the close the Dow down by -267.00 points to 16,170.00, S&P 500 -39.00 points to about 1833.00, S&P 100 -14.00 points to 815.00 and the Nasdaq Composite -130.00 points to about 4054.00. Oil closed down -$.30 around the $103.00 level. Looks like volatility is here to stay for a bit as the market has seen huge swings so far this week and will likely remain for a while to come.
Jobless Claims fell to the lowest level in almost seven years, perhaps a sign the labor market is experiencing a spring revival. Jobless claims sank by -32,000 to a seasonally adjusted 300,000. That’s the lowest level since May 2007, six months before the Great Recession began and a steeper drop than economists had expected. Initial claims are now almost -14% lower compared to one year ago and they are down -21% compared to the same week two years earlier. Economists expected claims to total 320,000. The level of claims in the last week of March was revised up to 332,000 from 326,000. The average of new claims over the past month declined by a smaller -4,750 to 316,250, marking the second lowest reading since the end of the recession. The monthly figure smooths out the jumpiness in the weekly data and offers a better look underlying labor-market trends. Continuing jobless claims decreased by -62,000 to a seasonally adjusted 2.78 million in the week ended March 29th. Continuing claims reflect the number of people already receiving benefits and are reported with a one-week delay.
Wednesday, April 9, 2014 4:10
The market started the week on the downside over -1%, but the past two days has rallied with strong gains today after the Fed said that they had a secret video conference call in early March and reached a general consensus that the 6.5% unemployment rate threshold for the first rate hike was outdated. The Dow saw highs of +190.00 points, S&P 500 +21.00 points and the Nasdaq +75.00 points and held it to finish the day. At the close the Dow up by +180.00 points to 16,437.00, S&P 500 +20.00 points to about 1872.00, S&P 100 +9.00 points to 829.00 and the Nasdaq Composite +71.00 points to about 4184.00. Oil closed up +$.80 around the $103.00 level.
The central bankers were clearly worried that changing the forward guidance would impact markets. They noted that, going into the video conference, the central bank and the markets were on the same page about the outlook for short-term interest rates. The minutes of the March 18-19th meeting also reveal that there was concern that the markets would read too much into the “dot plot,” which showed an upward shift in the Fed’s expectations for short-term rates. The so-called dot plot reflects where each Fed official expects interest rates. The “dot plot” showed the Fed’s median forecast of the fed funds rate rose by a quarter of one percentage point to 1% for 2015 and by a half a percentage point to 2.25% by the end of 2016, according to Barclays. Fed chairwoman Janet Yellen said afterwards not to pay attention to it. She stressed in their statement that the guidance shift did not indicate any change in the Fed’s policy intentions. Officials also spelled out in much greater detail the headwinds that would keep short-term rates low even after the first rate hike. These headwinds included higher precautionary savings by consumers, higher levels of savings around the globe, demographics and credit restraints.
After the meeting, the Fed policy committee statement took out any reference to an unemployment rate of 6.5% as a possible threshold to consider raising short term rates. Instead, the Fed said it will “take into account a wide range of information, including measures of labor market conditions, indicators of inflation pressures and inflation expectations, and readings on financial developments” before deciding to raise short-term rates.
Friday, April 4, 2014 4:10
The market started the day higher on mediocre news about Employment because it meant that the Fed may have to stick around longer with the Dow seeing highs of +70.00 points, S&P 500 +9.00 points and the Nasdaq +40.00 points. When thoughts of poor earnings coming out starting next week the market started to fall though, and the Dow saw lows of -180.00, S&P 500 -26.00 and the Nasdaq the worst at -120.00 points as stocks such as Facebook, Tesla, Google and Amazon fell hard. At the close the Dow down by -160.00 points to 16,412.00, S&P 500 -24.00 points to about 1865.00, S&P 100 -10.00 points to 825.00 and the Nasdaq Composite -110.00 points to about 4128.00. Oil closed up +$.85 around the $101.15 level. This made for an interesting end to the week as we only finished with a slight gain overall and it looks like next week may turn out interesting as tech stocks were crushed today.
There were +192,000 jobs created in March and the unemployment rate remained unchanged at 6.7%, the result of more than a half-million people joining the labor force in search of work. Economists expected an increase of +200,000 jobs. In March, hiring was strongest in the professional ranks, bars and restaurants. Manufacturing lost -1,000 jobs but was the only sector to do so. Average hourly wages, meanwhile, fell -1 cent to $24.30 after several strong gains. And the average workweek jumped +0.2 hours to 34.5 hours, matching a post-recession high. The labor-force participation rate moved up to 63.2% from 63%, as 503,000 people searched for work, a sign that they think more jobs are available. Employment gains for February and January were revised higher by a combined +37,000. The number of new jobs created in February was raised to +197,000 from +175,000, while January's figure was increased to +144,000 from +129,000.
Yesterday it was reported that the trade deficit climbed +7.7% to $42.3 billion in February to mark a five-month high, mainly because the nation exported less petroleum, commercial jets and industrial supplies. Economists had expected the deficit to rise to $39.7 billion from a slightly revised $39.3 billion in January. Exports fell -1.1% to $190.4 billion while imports edged up +0.4% to $232.7 billion. The trade gap with China dropped to an unadjusted $20.9 billion from $27.8 billion in January, the lowest level in nearly one year. The deficit with Mexico increased to $4 billion from $2.8 billion.
Tuesday, April 1, 2014 4:10
The market was up again today on low volume but did make slight new highs with the Dow seeing highs of +120.00 points, S&P 500 +15.00 points and the Nasdaq +70.00 points. It pulled back going into the close though to finish the quarter with the Dow up by +75.00 points to 16,533.00, S&P 500 +13.00 points to about 1886.00, S&P 100 +5.00 points to 833.00 and the Nasdaq Composite +69.00 points to about 4268.00. Oil closed down hard -$2.20 around the $99.30 level. With the all important employment report coming out this coming Friday this surge higher smells of a buy the rumor sell the fact type of week.
Today is the first day of the second quarter and means we just finished five straight positive quarters for the market. In the past, five straight positive quarters has been bad for the market and indicates that volatility will remain in place. Four of the five times the next quarter was lower, ending the streak at five. One year after, the market has averaged a loss of about -4% and this correlates with the +30% yearly gains stats that at least indicate a smaller gain and lots of volatility. There was one time it was positive, though, and that was when the quarterly win streak lasted for the next two years! That streak went all the way until the second quarter of 1998, reaching 14 consecutive positive quarters. Unfortunately this was when the dot.com bubble started and this aint no tech bubble by far!
Monday, March 31, 2014 4:10
The market shot out of the gate this morning after Fed Chairwoman Janet Yellen said that the recovery still feels like a recession to many people, which is why the central bank will keep its “extraordinary” support for the economy for “some time to come.” The Dow saw highs of +160.00 points, S&P 500 +17.00 points and the Nasdaq +55.00 points. It pulled back going into the close though to finish the quarter with the Dow up by +135.00 points to 16,457.00, S&P 500 +15.00 points to about 1872.00, S&P 100 +6.00 points to 828.00 and the Nasdaq Composite +43.00 points to about 4199.00. Oil closed up +$.20 around the $101.40 level.
In a speech to a Chicago community reinvestment conference, Yellen also provided evidence why there’s still slack in the jobs market, and weighed in on the hot issue of why the participation rate is so low. Yellen expanded on the reasons she believes there are significant more people willing and capable to filling a job than there are jobs for them. She also provided three real-life examples of people impacted by the jobs crisis, and emphasized that “although we work through financial markets, our goal is to help Main Street, not Wall Street.” Even she noted there are 7 million people working part time but who would like a full-time job. “This number is much larger than we would expect at 6.7% unemployment, based on past experience, and the existence of such a large pool of ‘partly unemployed’ workers is a sign that labor conditions are worse than indicated by the unemployment rate.” More like 16% is the real number. Further, the number of people who voluntarily quit their jobs “is noticeably below levels before the recession.” Yellen also said that the decline in unemployment has not helped raise wages for workers as in past recoveries — saying it’s averaging only a little more than +2% a year since the recession. “The low rate of wage growth is, to me, another sign that the Fed’s job is not yet done,” Yellen said.
Friday, March 28, 2014 4:10
The market was volatile this week closing up, then down the next day and in the end it ended the week with a slight loss. Today was looking good early on with the Dow seeing highs of +150.00 points, S&P 500 +19.00 points and the Nasdaq +60.00 points but as the weekend approached it started to sell off and almost went into the red before recovering at the close. At the close the Dow was up by +59.00 points to 16,323.00, S&P 500 +9.00 points to about 1858.00, S&P 100 +3.00 points to 822.00 and the Nasdaq Composite +5.00 points to about 4156.00. Oil closed up +$.30 around the $102.00 level.
Consumer spending rose in February at the fastest rate since November as people spent more on services such as health care and utilities, but in a negative sign, purchases of big-ticket items such as new cars fell for the third straight month.
Spending climbed +0.3% last month on a seasonally adjusted basis. This is the first cycle where not for one single quarter has the business sector allowed its ratio of capex-to-cash flow to rise above 100%.
Partly offsetting the acceleration in spending last month was a reduction in rate of outlays in January. Spending increased at a +0.2% clip in the first month of the year instead of +0.4% as previously reported. What’s more, spending on durable goods fell for the third straight month. Consumers typically buy big-ticket items when they feel more confident about the economy and their own job security. Household increased purchases of a variety of services, however, such as health care, education and financial advice. They also spent more on clothes.for the first time in four months.
Consumer spending has been lackluster since the recession ended in mid-2009 as people worked to pay down debt and rebuild their savings. Consumption accounts for as much as 70% of the economy activity. Many economists predict spending will speed up in 2014 owing to steady gains in hiring, rising stock prices, higher home values and a temporary truce in Washington after several years of debilitating budget battles. Yet growth has gotten off to a slow start in no small part because of unusually harsh winter weather, so investors will watch closely to see if there’s a spring snapback that puts the economy on a sounder footing.
In a more positive sign, disposable income adjusted for inflation rose +0.3% last month to mark the biggest advance in five months. Disposable income is the money leftover after people pay taxes. Higher disposable income typically foreshadows an increase in consumer spending, but it only rose +0.7% in 2013 after a +2% gain in 2012. The personal savings rate, meanwhile, edged up to a four-month high of +4.3% from +4.2% in January. Also, inflation as gauged by the core PCE price index increased +0.1% in February, and it’s up just +1.1% over the past 12 months. The core rate excludes food and energy. The overall PCE index also rose +0.1% last month and its climbed +0.9% in the past year. The low rate of inflation gives the Fed more cushion to remove stimulus from the economy at a leisurely pace and wait longer until it raises interest rates. The Fed targets inflation of 2% to 2.5%.
Consumer sentiment declined to a final March reading of 80%, the lowest level since November from a final February level of 81.6% according to a report on a gauge from the University of Michigan and Thomson Reuters. A preliminary March reading pegged the level at 79.9%. Economists had expected a final March level of 81%. Economists watch sentiment levels to get a feeling for the direction of consumer spending.
Yesterday it was reported that Slumping for an eighth month, a gauge of pending home sales fell -0.8% in February to the lowest level in more than two years, signaling that upcoming activity may slow. The index of pending home sales hit 93.9% in February - the lowest reading since October 2011, compared with 94.7% in January. Low inventory, declining affordability and poor weather have hit the housing market in recent months. By region, February's gauge of pending home sales fell -4% in the South and -2.4% in the Northeast. Meanwhile, the barometer rose +2.8% in the Midwest and +2.3% in the West. Pending sales typically close within two months. An index reading of 100% equals 2001's average contract activity level.
The economy’s growth in the final three months of 2013 was bumped up to a +2.6% annual pace from +2.4%, mainly because of higher spending on health care. The bigger gain in gross domestic product, however, offers few clues on the current path of the economy. Analysts expect GDP to taper off to +1.6% in the first quarter, partly on the view that companies will stockpile inventories at a slower rate after a record surge in the second half of 2014. Unusually harsh winter weather has also cast a chill on the economy. This is the first cycle where not for one single quarter has the business sector allowed its ratio of capex-to-cash flow to rise above 100%. GDP reflects the total value of all goods and services produced by the economy. The U.S. has expanded at an average pace of +3.3% since 1929, but growth has slowed to a +2.3% rate in the first four full years since the Great Recession ended. Many economists believe growth will accelerate in 2014 and perhaps even top 3% annually for the first time since 2005, but the slow start will make it harder to achieve that goal. And so far there’s evidence of a big rebound in growth in the offing.
Wednesday, March 26, 2014 4:10
Going into trading today the market was basically flat for the week but started the day higher with the Dow seeing highs of +140.00 points, S&P 500 +14.00 points and the Nasdaq +25.00 points. Midday it turned lower after a very disappointing 5-year bond auction plus worries about Ukraine and weak Chinese economic data came home started to take hold. The Dow saw lows at the finish of the day of -100.00 points, S&P 500 -13.00 points and the Nasdaq Composite -65.00 points. The market is looking like it wants to go down as volatility is kicking up. For the past week every high of the day has been sold so we’ll likely continue to see it move down until it can get decently oversold.
At the close the Dow was down by -99.00 points to 16,269.00, S&P 500 -13.00 points to about 1853.00, S&P 100 -5.00 points to 822.00 and the Nasdaq Composite -61.00 points to about 4174.00. Oil closed up +$1.00 around the $100.30 level.
Yesterday it was reported that New Home sales were at an annual rate of 440,000 in February, down -3.3% from January's one-year high. Economists forecast sales to total a seasonally adjusted 440,000 last month. Sales climbed +37% in the Midwest after plunging in January, while sales fell in the Northeast, South and West. The median price of new homes edged up +0.4% to $261,800 last month. The supply of new homes on the market rose to 5.2 months at the current sales pace from 5.0 months in January. New home sales are -1.1% lower compared to one year ago, reflecting weaker demand because of higher mortgage rates and home prices as well as a bitterly cold winter.
Tuesday, March 18, 2014 4:10
The rally continued on today with news that Russia once again announced that Russia has gotten the part of Ukraine they want so they’re done. The Dow saw highs of +120.00 points, S&P 500 +14.00 points and the Nasdaq +50.00 points but volume continues to drop. As we start to move into the midpoint part of the week for expiration, volatility will likely for sure start to increase and especially with Janet Yellen making her first Fed speech as chair after the Fed’s two day meeting. At the close the Dow was up by +89.00 points to 16,336.00, S&P 500 +14.00 points to about 1872.00, S&P 100 +6.00 points to 824.00 and the Nasdaq Composite up +53.00 points to about 4333.00. Oil closed up +$1.50 around the $99.60 level.
Monday, March 17, 2014 4:10
The market rallied today on pathetic volume but not surprising as the market was oversold in the short term. This is an expiration traded week so volatility will likely remain and today had the markings of a relief rally. Everyone really knew that Crimea would vote to join Russia and break away from Ukraine in a disputed referendum. The Dow saw highs of +220.00 points, S&P 500 +22.00 points and the Nasdaq +65.00 points. When President Obama came out along with the European Union doing the bare minimum imposing sanctions on a small group of Russian and Ukrainian politicians the market fell back a bit but held most of its gains for the day. The sanctions sent a political message that the West is most seriously displeased with Russia’s aggression in Crimea, but the economic impact of the sanctions is barely discernible. The sanctions amount to a slap on the wrist and not a very hard slap, either. The West can seize assets owned by these people, and prevent Western banks from doing business with them but they don’t touch the flow of trade and investment between Russia and the West.
At the close the Dow was up by +182.00 points to 16,247.00, S&P 500 +18.00 points to about 1859.00, S&P 100 +8.00 points to 818.00 and the Nasdaq Composite up +35.00 points to about 4280.00. Oil closed down -$.85 around the $98.00 level.
A gauge of confidence among home builders moved up in March, but remained close to the lowest level since May and signaled that builders, generally, are pessimistic about sales trends, according to data released today. The National Association of Home Builders/Wells Fargo housing-market index rose one point to 47% this month. "Builders continued to be affected by poor weather and difficulties in finding lots and labor," said Kevin Kelly, NAHB's chairman. March is the second consecutive month that the index has been below a key reading of 50%, readings under 50% signal that builders, generally, are pessimistic. Economists had expected March's reading to climb to 50% after plunging in February to 46%. The builder-confidence gauge hit a recent peak of 58% in August, which was the highest level since 2005.
Industrial production climbed +0.6% in February, the Fed reported today, the fastest monthly growth rate since August as output recovered after the unusually rough weather to start the year. The rise topped the economist consensus for +0.2% growth. The gain in February came as manufacturing output grew 0.8% and as mining output grew 0.3%, while utilities output eased -0.2% after a +3.8% surge in January. In addition, January's industrial production was revised to a +0.2% fall from an initially reported -0.3% drop, though there were revisions to November's and December's numbers as well. Capacity utilization rose to 78.8% from 78.5%.
Friday, March 14, 2014 4:10
The market once again tried to rally this morning with the Dow seeing highs of +60.00 points, S&P 500 +6.00 points and the Nasdaq +15.00 points but because there is the possibility that countries from all around the world will place sanctions on Russia if Ukraine votes to rejoin Russia Sunday, the market fell with the Dow seeing lows of -50.00 points, S&P 500 -7.00 points and the Nasdaq -20.00 points. At the close the Dow was down by -231.00 points to 16,109.00, S&P 500 -22.00 points to about 1846.00, S&P 100 -10.00 points to 813.00 and the Nasdaq Composite was down -63.00 points to about 4260.00. Oil closed up +$.75 around the $99.00 level. The market is likely overreacting to the news and any type of good news will likely see it bounce a little because its getting quite oversold in the short term. Next week is also expiration related so volatility will likely be key with the market ending the week mostly unchanged. With Geo politics heating up it makes it interesting.
Producer prices fell in February for the first time in three months in another sign that inflationary pressures remain well contained. The producer price index fell -0.1% on a seasonally adjusted basis. The price of goods rose +0.4% last month, but the cost of services fell -0.3%. Economists had expected the PPI to increase by +0.2%, but the index underwent a major overhaul this year for the first time since 1978, and that’s made it more difficult to forecast early on. The decline last month was largely attributed to lower profit margins for clothing retailers and a -1.1% drop in the cost of gasoline. Yet the wholesale cost of food rose +0.6% and natural gas jumped +4.6% as demand grew during a particularly cold month. The PPI has risen just +0.9% over the past 12 months, down from +1.2% in January.
Thursday, March 13, 2014 4:10
The market started the day higher with the Dow seeing highs of +70.00 points, S&P 500 +7.00 points and the Nasdaq +20.00 points but when it was announced that Russian forces were conducting new military operations near the Ukrainian border the market started to fall. That plus China continuing to show signs of slowing the Dow saw lows of -260.00 points, S&P 500 -27.00 points and the Nasdaq -85.00 points before rallying slightly before the close! At the close the Dow was down by -231.00 points to 16,109.00, S&P 500 -22.00 points to about 1846.00, S&P 100 -10.00 points to 813.00 and the Nasdaq Composite was down -63.00 points to about 4260.00. Oil closed up +$.25 around the $98.00 level.
From the looks of things the volatility has started as the world deals with a possible slowdown and problems in Russia and the Ukraine are heating up again. The continued buildup of both military hardware and personnel indicates Russia will annex Crimea and possibly other parts of Ukraine. The G7 is warning of consequences and calling such a move a violation of international law. Russia maintains the push is to protect its Russian-speaking population, but the reality is it’s not the Ukrainians attacking their ethnic Russian-speaking minority; it’s the other way around. The G7 continues to urge the Russians to return to their bases ahead of Sunday’s referendum, but barring some miracle agreement that seems highly unlikely. This weekend’s vote is already a foregone conclusion. The question is will the world be able to do anything about it, and this is why volatility will remain.
Retail sales rose in February for the first time in three months as shoppers increased online purchases and bought more autos, clothing, sporting goods and drug-store items. Retail sales rose a seasonally adjusted +0.3% last month. Economists had forecast retail sales to rise +0.2%. Sales minus the large auto sector also rose +0.3% in February. Retail sales account for about one-third of consumer spending, the main engine of economic growth. Yet spending for January and December were both were revised lower. The decline in spending in January was changed to +0.6% from +0.4% and the sales drop for December was revised to +0.3% from +0.1%. Over the past year, retail sales have risen by a modest +1.5%.
Jobless Claims fell by -9,000 to 315,000, marking the lowest level since the end of November. Economists expected claims to total 330,000 on a seasonally adjusted basis. The average of new claims over the past month, a more reliable gauge than the volatile weekly number, declined by -6,250 to 330,500. That's the lowest level since early December. Also, the government said continuing claims fell by -48,000 to a seasonally adjusted 2.86 million in the week ended March 1st. Continuing claims reflect the number of people already receiving benefits. Initial claims from two weeks ago, meanwhile, were revised up to 324,000 from 323,000.
Monday, March 10, 2014 4:10
As we hit a five year high last week this morning Chinas Shanghai index hit a five year low as Chines exports were reported with a loss -18.1% year-on-year in February. Economists had been expecting growth of +5%. This started the sell off in world markets and the Dow saw lows of -120.00 points, S&P 500 -12.00 points and the Nasdaq -30.00 points! Of course it came back on pathetic volume to close the day with just slight losses. At the close the Dow was down by -34.00 points to 16,419.00, S&P 500 -1.00 points to about 1877.00, S&P 100 +.40 points to 827.00 and the Nasdaq Composite was down -2.00 points to about 4334.00. Oil closed up +$1.00 around the $102.65 level.
The report from Chinas economy slowing so much isn’t a good sign and with our own warnings signs such as sentiment ratios recently well over 4 bulls to 1 bear with the only time higher 1987 and blown out at the 2000, and 2007 tops is bad. Indexes setting record highs with the slim number of prior bull markets, 3 to be exact, that have lasted past this point mean that time is running out at least for the next 6 months. Especially important is the record high levels of margin debt, or borrowings to finance stock buys because when you can’t buy any more what usually happens is people start to take profits. Then valuations that are close to levels when stocks last peaked and China making it seem that valuations may need to be changed plus you add in the geo political situation with Russia and Ukraine and it provides an indication that at least volatility will return. Any bad news will shake the market similar to last Monday and eventually it will stick. In the short and intermediate term the market is also quite overbought so at the least I think it will test the gap it made last Tuesday in the next little while to start.
Friday, February 28, 2014 4:10
The market was higher this morning with the Dow up +130.00 points, S&P 500 +16.00 points and the Nasdaq +25.00 points. It then turned down midday after it was announced that Ukraine officials accused Russia of sending troops into the Crimea region. The Dow was off -60.00 points, S&P 500 -6.00 points, -40.00 points. But because it was month end the market back and at the close the Dow was up by +49.00 points to 16,322.00, S&P 500 +5.00 points to about 1859.00, S&P 100 +3.00 points to 818.00 and the Nasdaq Composite was down -10.00 points to about 4318.00. Oil closed down +$.20 around the $102.60 level.
The economy expanded at a +2.4% annual pace in the fourth quarter instead of +3.2% as originally reported, mainly because consumers did not spend quite as much as expected. The revised figure matched forecasts. The increase in consumer spending was lowered to 2.6% from 3.3%, mostly because Americans spent less than initially calculated on big-ticket items such as autos, appliances and electronics. Reduced estimates for export growth and inventory spending and a sharper decline in government spending also contributed to the downward revision in gross domestic product. Exports rose +9.4% instead of +11.4% and inventories climbed $117.4 billion and not $127.2 billion as previously reported. Government spending fell a stiffer -5.6% instead of 4.9% because states and local governments actually cut outlays instead of increasing them. Excluding inventories, final sales of American-made goods and services was trimmed to +2.3% from +2.8%. Yet company spending on equipment - a key signal of improved business conditions was revised up to show a +10.6% gain versus +6.9%. Inflation as measured by the PCE index was little changed, rising at a +1% annual pace or by +1.3% excluding food and energy.
A gauge of pending home sales ticked up +0.1% in January, but remained near a two-year low, signaling that upcoming activity may be slow. The index of pending home sales was 95% in January, compared with 94.9% in December, which was the lowest reading since November 2011. Low inventory, declining affordability and poor weather are hitting results, NAR said. By region, the gauge of pending home sales in January rose +3.5% in the South and +2.3% in the Northeast, while falling -4.8% in the West and -2.5% in the Midwest. Pending sales typically close within two months. An index reading of 100 equals 2001's average contract activity level.
Thursday, February 27, 2014 4:10
The market was lower to start the day a bit but as the day wore on it moved higher with the Dow up +80.00 points, S&P 500 +10.00 points and the Nasdaq +35.00 points. At the close the Dow was up by +74.00 points to 16,272.00, S&P 500 +9.00 points to about 1854.00, S&P 100 +3.00 points to 814.00 and the Nasdaq Composite +27.00 points to about 4318.00. Oil closed down -$.33 around the $102.00 level.
Orders for Durable goods fell -1.0% in January as demand tapered off for most big-ticket items except military hardware. Economists had expected orders to fall -2.5%. Aircraft orders sank -20.2% on fewer Boeing bookings and autos were down -2.2%. Stripping out the volatile transportation sector, orders rose +1.1%Military orders snapped back after a big decline in December to undergird the increase. Yet orders fell in virtually every other major category. In one good sign, orders for core capital goods - a stand-in for business investment - jumped +1.7% after falling by a similar amount in December. Yet shipments of core capital goods, a category used to calculate quarterly economic growth, dropped 0.8% in January. Orders for December, meanwhile, were revised to show a -5.3% decline.
Jobless Claims jumped by +14,000 to 348,000 last week to match a five-week high. Economists expected claims to total 335,000 on a seasonally adjusted basis. The average of new claims over the past month, a more reliable gauge than the volatile weekly number, was unchanged at 338,250. Continuing claims increased by +8,000 to a seasonally adjusted 2.96 million. Continuing claims reflect the number of people already receiving benefits. Initial claims from two weeks ago, meanwhile, were revised down to 334,000 from an original read of 336,000.
Wednesday, February 26, 2014 4:10
The markets really done nothing so far this week after rallying on Monday with yesterday down a bit and today flat. We started the day higher with the Dow up +70.00 points, S&P 500 +4.00 points and the Nasdaq +20.00 points but as the day wore on momentum started to turn and by lunch it was at its lows with the Dow seeing lows of -30.00 points, S&P 500 -4.00 points and the Nasdaq -10.00 points. At the close the Dow was up by +19.00 points to 16,198.00, S&P 500 +.04 points to about 1845.00, S&P 100 +.20 points to 811.00 and the Nasdaq Composite +5.00 points to about 4292.00. Oil closed up +$.75 around the $103.00 level. Volume continues to shrink here so at the least I would think volatility is going to increase as we finish off the week. The market is lacking momentum and there are to many questions out there right now about direction so were likely to see more sideways action for awhile.
Sales of new single-family homes started 2014 with surprising strength, rising +9.6% in January to a seasonally adjusted annual rate of 468,000, the fastest pace in more than five years. Economists had expected a January sales rate of 405,000, compared with an originally estimated pace of 414,000 in December. On Wednesday, the government upwardly revised December's pace to 427,000. Home sales in January were up +2.2% from the year-earlier period. The show of resiliency is in the face of home prices and mortgage rates that have trended higher over the past year. Economists had also expected unusually cold winter weather to hit recent sales of new homes. The median sales price of new homes fell -2.2% in January to $260,100, but was up +3.4% from the year-earlier period. The supply of new homes on the market fell to 4.7 months in January at the current sales pace from 5.2 months in December.
Yesterday it was reported that home prices ticked down -0.1% in December, declining for a second month, with 11 of 20 tracked cities posting drops. After seasonal adjustments, home prices in December rose +0.8%, down a bit from +0.9% in November, according to S&P/Case-Shiller's 20-city composite index. "Gains are slowing from month-to-month and the strongest part of the recovery in home values may be over," said David Blitzer, chairman of the index committee at S&P Dow Jones Indices. "The seasonally adjusted data also exhibit some softness and loss of momentum." On a year-over-year basis, home prices rose +13.4% in December, the fastest calendar-year growth since 2005, supported by a low inventory of homes available for sale. Including December, prices remained about 20% below a 2006 peak, though certain cities, such as Dallas and Denver, recently posted fresh record highs.
Monday, February 24, 2014 4:10
The market flew out of the gates this morning and climbed until the final hour with the Dow seeing highs of +200.00 points, S&P 500 +23.00 points and the Nasdaq +50.00 points. Profit taking set in the final hour however and gains were cut in half with the Dow closing up by +104.00 points to 16,207.00, S&P 500 +11.00 points to about 1848.00, S&P 100 +5.00 points to 812.00 and the Nasdaq Composite +30.00 points to about 4293.00. Oil closed up +$.60 around the $102.00 level. Intraday the market hit new highs on thin volume but when the selling started there was big volume. Tomorrow could be key for the week to indicate if a new uptrend has started but technically it is unlikely as short term indicators are screaming overbought so volatility is likely the outcome!!
Thursday, February 20, 2014 4:10
As we go into the “real” expiration tomorrow lol, the market is back on the upside. In this shortened trading week due to the holiday the market was flat on Tuesday and sold off strongly yesterday after an early higher day after Fed minutes were released with Fed officials agreeing unanimously to continue to slowly reduce the pace of the central’s asset-purchase program by another $10 billion to $65 billion per month and to pledge to keep rates low until “well past” the point where the unemployment rate will fall below a 6.5% threshold. This was the first unanimous statement since 2011. However, minutes revealed little consensus over short-term rates and some doubts about whether the central bank should continue to reduce the pace of asset purchases. The other thing that took the market down was that before the release of minutes there were a bunch of speeches from district Fed Presidents such as Atlanta’s Fed President Dennis Lockhart saying he expects a mid-2015 interest-rate hike.
Today it looked like the market was going to continue lower but expiration seemed to have an affect as it turned around midday with likely due to expiration tomorrow with the Dow seeing highs of +130.00 points, S&P 500 +14.00 points and the Nasdaq +35.00 points. At the close the Dow was up by +93.00 points to 16,133.00, S&P 500 +11.00 points to about 1840.00, S&P 100 +4.00 points to 810.00 and the Nasdaq Composite +30.00 points to about 4268.00. Oil was flat closing down -$.15 around the $103.00 level.
Today it was reported that the Philadelphia Fed's manufacturing index dropped sharply to a reading of negative -6.3% in February from a +9.4% reading in January, well below economists forecast of +7.3%. The index had been in positive territory for eight months. The new-orders components dropped to negative -5.2% from +5.1% in the prior month, while shipments fell to negative -9.9% from +12.1%.
Jobless claims dropped by -3,000 to a seasonally adjusted 336,000. Economists had expected claims to total 335,000. The number of people seeking benefits each week is seen as a good gauge of how many layoffs are taking place in the economy.
The average of new claims over the past month, usually a more reliable gauge than the erratic weekly number, rose by +1,750 to 338,500. That’s the highest amount in six weeks, but just slightly above the six-month average. Claims appear to have fallen into a holding pattern after a steady decline in 2013. Unusually harsh weather early in the new year may have stifled new hiring, and it’s also sidelined some workers in certain industries such as construction and manufacturing. What’s unclear is whether the weather-induced weakness in the labor market is temporary or if it is masking a slowdown in job creation. The last two monthly employment reports have been soft and economists aren’t expecting much improvement in February. Meanwhile, the government said continuing jobless claims increased by +37,000 to a seasonally adjusted 2.98 million in the week ended February. 8th. Continuing claims are reported with a one-week delay and reflect the number of people already receiving benefits.
An early gauge of manufacturing jumped to its highest level in almost four years in February from the prior month. The Purchasing Managers index rose to 56.7% in February, up from January level of 53.7%, which was a three-month low. This is the fastest overall improvement in conditions since May 2010. Readings above 50% indicate expansion, with higher readings signaling faster expansions. He noted that there was the largest rise in backlogs of work seen since prior to the financial crisis, as well as a steep fall in inventories.
Yesterday producer prices rose a seasonally adjusted +0.2% in January under the government's new formula for measuring wholesale inflation. Excluding the volatile categories of food and energy, core prices for wholesale goods rose +0.4%. A new index that tracks prices of goods and services meant to be sold to consumers increased +0.2%. Over the past year, wholesale prices have risen an unadjusted +1.2%, little changed from December but the highest level in three months. The new PPI will include the wholesale cost of goods, as usual, and add services, construction, government and exports for the very first time. Services such as retail, finance, education and health care now represent a much bigger slice of the economy than goods-producing industries.
Construction on new U.S. homes fell -16% in January to a seasonally adjusted annual rate of 880,000, with drops for single-family homes and apartments, according to government data. Particularly poor weather hit construction last month, according to economists, who had forecast a starts rate of 945,000 for January, compared with an originally estimated rate of 999,000 for December. The starts rate fell in three of four regions last month, plunging -68% in the Midwest and falling -17% in the West and -13% in the South. Meanwhile, the starts rate rose +62% in the Northeast. Construction on new homes has pulled back since soaring in November to the fastest pace since 2008. Residential projects delayed during a particularly tough winter could show up in the spring, economists say. However, the government also reported that building permits, a sign of future demand, fell -5.4% to an annual rate of 937,000, the lowest since August. Permits dropped for single-family homes and apartments.
Confidence among home builders also crashed in February, dropping to the lowest level in nine months, led by weaker views on present sales of single-family homes. The housing-market index dropped to 46% this month, signaling that builders, generally, are pessimistic about sales trends, according to the National Association of Home Builders/Wells Fargo, which cited "unusually severe weather conditions," among other factors. February's reading is down from 56% in January, and is the first period since May that the index has been below a key reading of 50%, readings over 50% signal that builders, generally, are optimistic). Economists had expected a February level of 56%. The builder-confidence gauge hit a recent peak of 58% in August, which was the highest level since 2005. Other recently released weak reports on upcoming home sales and retail sales may have also been hit by poor weather, economists say.
Thursday again........
For some reason my brain went dead on me when I was writing my commentary today because I knew expiration wasn't tomorrow, its next Friday!! Sorry if I caused any confusion!!
Thursday, February 13, 2014 4:10
The market started the day on the downside this morning pretty hard with the Dow seeing lows of -100.00 points, S&P 500 -10.00 points and the Nasdaq -30.00 points out of the gate. This made it appear that it was going to be an ugly day but then buying came back in and it began to rally but on incredibly low volume. This indicated that it was mostly because of expiration that starts tomorrow morning with the S&P 500 cash options going off the board. The Dow saw highs of +80.00 points, S&P 500 +12.00 points and the Nasdaq +45.00 points. At the close the Dow was up by +64.00 points to 16,027.00, S&P 500 +11.00 points to about 1830.00, S&P 100 +4.00 points to 808.00 and the Nasdaq Composite +39.00 points to about 4241.00. Oil was flat closing +$.05 around the $100.50 level.
Sales at Retailers fell sharply in January and December and turned out to be worse than initially reported, offering more evidence the economy may have softened toward the end of the year. Sales dropped a seasonally adjusted -0.4%. Economists had expected a -0.1% decline. Unusually cold and snowy weather in January appeared to cool the desire of people to shop, get it haha!! But the weak retail report also suggested that poor conditions were not the only thing holding consumers back. One example: Sales at Internet stores, which should not be affected by the weather, fell -0.6% in January. What’s more, sales in December and November were both revised lower. December’s originally reported +0.2% increase was cut to an outright decline of +0.1%. Sales fell in most categories, led by autos. Sales at car dealers fell -2.1%. In January, auto sales slipped to an annual pace of 15.2 million in January from 15.3 million in December and 16.3 million in November. Sales also declined at clothing stores, home-furnishing outlets, pharmacies, bars, restaurants and department stores. Consumers are the main source of economic growth and retail sales account for a large slice of their spending. The drop in sales in January and December suggests consumers still aren’t willing to splurge, a troublesome sign for businesses and the broader economy. Companies stocked up heavily on goods in the third and fourth quarters in anticipation of stronger demand. If they can’t sell everything, they will have to reduce prices and accept lower profit margins. That would hurt first-quarter growth.
Jobless Claims rose last week and remained somewhat elevated, perhaps a sign the labor market is not getting better as fast as it was toward the end of 2013. Jobless claims climbed by +8,000 to a seasonally adjusted 339,000. Economists had expected claims to total 330,000. The four week average, usually a more reliable gauge than the weekly number, increased by +3,500 to 336,750. The number of people seeking benefits is seen as a good gauge of how many layoffs are occurring in the economy. Until recently, jobless claims had been on a downward slope amid a steady increase in hiring and a gradual decline in the unemployment rate. Over the past six months they have averaged about 335,000 a week, touching post recession lows several times. Yet the decline in claims appears to have halted in early 2014, potentially signaling a slowdown in hiring. The indirect link between the level of claims and the pace of hiring, however, does not appear to be as strong as it was in the past. Unemployment is much higher now at 6.6% compared to the last time the level of claims was this low in 2006 and early 2007, when the jobless rate was under 5%.
Wednesday, February 12, 2014 4:10
The market got volatile today with it starting the day higher but quickly turned down with the Dow seeing lows of -70.00 points, S&P 500 -5.00 points and the Nasdaq -5.00 points midday. At the close the Dow was down by -31.00 points to 15,964.00, S&P 500 -.50 points to about 1819.00, S&P 100 -1.00 point to 805.00 and the Nasdaq Composite +10.00 points to about 4201.00. Oil was up closing +$.30 around the $100.50 level.
Were midweek now and as we move into expiration on Friday, volatility may get even a bit more extreme but we’ll see. The good thing is this has been the second volatile cycle with really good profits on both sides and I think this type of action will occur all year!!
Tuesday, February 11, 2014 4:10
Yesterday the market was mostly flat to closing slightly up but today with the new Fed chief Janet Yellen basically confirming everything that Bernanke said, it rallied today with the Dow seeing highs of +240.00 points, S&P 500 +25.00 points and the Nasdaq +50.00 points going into the final hour. At the close the Dow was up by +193.00 points to 15,995.00, S&P 500 +20.00 points to about 1820.00, S&P 100 +10.00 point to 806.00 and the Nasdaq Composite +43.00 points to about 4191.00. Oil was up closing +$3.60 around the $100.00 level.
The market is now up four days in a row and almost +5%, the problem, on lower and lower volume! Now that Yellen is walking in Bernankes shoes doing the same thing this should give reason for the market to rally however whether or not the Fed continues to taper a few tens of billions of dollars here and there in their outright QE, nothing much has really changed in regards to all those trillions of dollars that the government is continuing to inject into the economy annually and getting nothing for it. Earnings are starting to peak and fall a bit here so if the Fed does continue to pull back what will drive the market is the question. To me this means that volatility is here to stay so it will be interesting to see how the market finishes out this expiration traded week.
Recent weak employment reports haven't been enough to sway the Federal Reserve from reducing the pace of its monthly stimulus program, Chair Janet Yellen said today. In her first public remarks, delivered to the House Financial Services Committee, Yellen said the central bank does not look at economic reports in a vacuum when determining its policy course. "We have to very careful not to jump to conclusions interpreting what those reports mean," she said. "There were weather factors. We've had unseasonably cold temperatures that may be affecting economic activity in this job market and elsewhere. "The (Open Market) Committee will meet in March. We will have a broad range of data on the economy to look at, including an additional job report," Yellen added. "I think it's important for us to take our time to assess what the significance of this is."
Yellen said she believes the economy is in a sustainable economic recovery, though she noted she was "surprised" by the weak jobs data. Yellen defended the central bank's policy course, saying the central bank was trying to be as consistent as possible considering the difficulty of the task at hand. Recent job market weakness, Yellen said, hasn't been enough to sway the Fed from its course in reducing the pace of its monthly asset purchase program. In her first public comments since taking the Fed's top position, Yellen told the House Financial Services Committee that the times have called for unusual policy moves. "I have always been in favor of predictable monetary policy that responds in a systematic way to shifts in economic variables," she said. Yellen called herself a "sensible central banker" but called the economic circumstances since the financial crisis "very unusual times." "We are attempting through our forward guidance to be a systematic and predictable as we can possibly be," she said. Yellen delivered her first public remarks to Congress on Tuesday, earlier pledging a steady course in which the central bank would continue unwinding its stimulus program so long as economic progress allowed.
Friday, February 7, 2014 4:10
The market rallied today even though we saw another poor employment report out this morning. Obviously traders are anticipating that new Fed chief Yellen will continue with the Fed’s free money printing press when she speaks before Congress next Tuesday and Thursday! The market saw highs just before the close but again on weaker volume with the Dow seeing highs of +170.00 points, S&P 500 +25.00 points and the Nasdaq +70.00 points in the final hour. At the close the Dow was up by +166.00 points to 15,794.00, S&P 500 +24.00 points to about 1797.00, S&P 100 +10.00 point to 795.00 and the Nasdaq Composite +69.00 points to about 4125.00. Oil was up closing +$2.20 around the $100.00 level.
The economy added just +113,000 jobs in January, a small improvement over December’s disappointing report but not nearly enough to signal a much-needed rebound in the increasingly unpredictable labor market. The number of jobs created fell well below forecasters’ predictions of +185,000 new jobs. The headline unemployment rate was 6.6%, down from 6.7% in the prior month. The labor participation rate, a key gauge of the percentage of working-age Americans currently employed, was 63%, up from 62.8% in December but still at a record low. Despite the tick higher last month, the rate remains at its lowest level in four decades. Strangely most of the job growth in January occurred in construction even though there was pathetic weather. There were also gains in manufacturing, wholesale trade and mining.
The weak December report, which revealed the addition of a lousy +74,000 jobs, well below forecasts, was blamed on severe weather throughout much of the country. The December figure was revised higher to +75,000. After gaining an average of +194,000 new jobs per month in 2013, it’s unclear how the loss of momentum in job growth might impact future monetary policy set by the Fed. But with so many people literally falling off the labor force every month we need to see an average +350,000 per month to break even. The number of long-term unemployed, or those who’ve been out of work for 27 weeks or more, declined by -232,000 to 3.6 million, according to the Labor Department. This category accounted for 35.8% of the unemployed.
The strengthening jobs market late last year prompted the Fed last month to begin scaling back its easy-money policies initiated five years ago in the wake of the 2008 financial crisis. But since then, economic data has been mixed. For instance, data released this week showed that the number of Americans filing new claims for unemployment benefits fell more than expected last week, a positive sign for labor markets but another report showed that exports fell in December, which is poor for the key manufacturing sector.
In January, the Fed continued to gradually scale back its stimulus policies, voting to cut its bond purchases by another $10 billion per month despite the poor December jobs report, other volatile data and an outbreak of turbulence in emerging markets. Fed policy makers have vowed to take a cautious approach to so-called tapering, fearing that dialing back its bond purchases too quickly could backfire if the economy shows signs of stalling again. The Fed doesn’t meet again until March so policy makers will have the February jobs report to digest in addition to the January numbers. In any case, the Fed seems to be relying less on labor market indicators for their decisions on future policy and more on broader economic barometers such as GDP and inflation levels.
Thursday, February 6, 2014 4:10
It was rally time for the market today as it started the day higher and continued throughout with the Dow seeing highs of +195.00 points, S&P 500 +23.00 points and the Nasdaq +60.00 points in the final hour. At the close the Dow was up by +188.00 points to 15,629.00, S&P 500 +22.00 points to about 1773.00, S&P 100 +9.00 point to 785.00 and the Nasdaq Composite +46.00 points to about 4057.00. Oil was up closing +$.50 around the $97.90 level. The big test to come is how well the market reacts to the most important economic indicator, employment, which comes out tomorrow morning before the open. Volume on this rally was a little scarce so we’ll see how the week turns out. This could be a good intermediate term turn for the market to at least challenge recent highs depending on how good the rally is otherwise we’ll just continue to chop around for a while longer.
Announced layoffs soared in January from a 13-year low in December, led by job cuts from retailers who saw weak holiday sales, according to data released by outplacement consultancy Challenger, Gray & Christmas. Total layoffs announced last month rose to more than +45,000, up from about +31,000 in December and +40,000 in January 2013. "The post-holiday job-letting in the [retail] sector was inevitable," said Chief Executive John Challenger.
Productivity in the fourth quarter grew at a +3.2% annual rate but economists had forecast productivity to rise +3.4% compared to an upwardly revised +3.6% gain in the third quarter. The gains in productivity over the past two quarters were the highest since the second half of 2009 when America was emerging from recession. Output of goods and services jumped +4.9% in the fourth quarter, while hours worked rose +1.7%. Unit-labor costs fell -1.6%. Hourly wages of American workers advanced at a +1.5% annual rate in the final three months of 2013. Adjusted for inflation, they rose a smaller +0.6%. In the manufacturing sector, productivity increased by +2.0%. For all of 2013, productivity rose +0.6%.
The trade deficit climbed +12% to in December, reversing the sharp drop in November. The deficit rose to a seasonally adjusted $38.7 billion from a slightly revised $34.6 billion in November. Economists forecast a deficit of $36 billion. A larger trade deficit, generally a negative for the economy, results when the U.S. buys more goods from trading partners and sells less to them. U.S. exports fell -2.2% in December to $191.3 billion while imports rose +1.6% to $230 billion. Companies sold less industrial supplies, business equipment and autos.
Jobless Claims fell by -20,000 to 331,000, a sign the labor market continues to gradually improve. Economists expected claims to drop to 337,000 on a seasonally adjusted basis. The average of new claims over the past month, a more reliable gauge than the volatile weekly number, edged down by -250 to 334,000. Also, the government said continuing claims rose by +15,000 to a seasonally adjusted 2.96 million in the week ended Jan 25th. Continuing claims reflect the number of people already receiving benefits. Initial claims from two weeks ago, meanwhile, were revised up to 351,000 from an original reading of 348,000, based on more complete data.
Wednesday, February 5, 2014 4:10
The market was looking as if it was going to go down pretty hard this morning once again as the Dow saw quick lows of -110.00 points, S&P 500 -18.00 points and the Nasdaq -60.00 points. Traders couldn’t keep up the pressure though as it came back and midday became mixed with the Dow seeing highs of +40.00 points, S&P 500 +2.00 points and the Nasdaq remained down but only by -5.00 points. At the close the Dow was down by -5.00 points to 15,440.00, S&P 500 -4.00 points to about 1752.00, S&P 100 -1.00 point to 776.00 and the Nasdaq Composite -20.00 points to about 4012.00. Oil was up closing +$.10 around the $97.40 level. Volatility seems to be back and the market is now nicely tradable on both sides. What is telling this week is how will the employment report be on Friday as that will tell if the market will continue to see pressure or will continue to rally!
If this any indication the report could be worse than expected as Private-sector-employment gains slowed down in January, as employers added ojnly +175,000 jobs. Economists had forecast that private-sector hiring slowed down last month, with employers adding +189,000 jobs, compared with an originally estimated December increase of +238,000. ADP revised December's gain to +227,000. Economists use ADP's data to get a feeling for the employment report out on Friday, and covers government jobs in addition to the private sector. Economists expect the government's report to show that non-farm employment rose by +190,000 jobs last month, high enough for a disappointment. Last months was after a meager gain of +74,000 jobs in December, when there was unusually harsh weather.
Tuesday, February 4, 2014 4:10
The market did rebound today although it almost went into the red after the first thirty minutes of trading as the Dow dipped into the red. Traders were able to pick it back up though and going into the final hour highs were hit with the Dow seeing +120.00 points, S&P 500 +16.00 points and the Nasdaq +60.00 points. At the close the Dow was up by +72.00 points to 15,445.00, S&P 500 +13.00 points to about 1755.00, S&P 100 +5.00 points to 777.00 and the Nasdaq Composite +35.00 points to about 4032.00. Oil was up closing +$.90 around the $97.30 level. The rally was pretty good today but now the real test will start because the short term oversold position has been relieved. Globex futures sold off quite a bit after the close so unless its made up in the overnight session were likely to at least see a down open tomorrow morning.
Monday, February 3, 2014 4:10
The market started the day on a sour note as economic data wasn’t that great this morning and earnings have only been average so it saw lows going into the final hour then visited them again just before the close with the Dow seeing -340.00 points, S&P 500 -43.00 points and the Nasdaq -120.00 points. At the close the Dow was down by -326.00 points to 15,373.00, S&P 500 -41.00 points to about 1742.00, S&P 100 -17.00 points to 772.00 and the Nasdaq Composite -109.00 points to about 3997.00. Oil was down closing -$.80 now around the $96.80 level.
The sell off this past month has been great for the market and in my opinion think it is using this as a test for our new Fed chief Yellen. It may start lower tomorrow but I think she's going to get back in control, I suspect before it goes down to far. The market never goes straight down from a new high anyhow before bouncing back. Besides that in the short term the market is getting quite oversold so a bounce into Friday’s employment report is a possibility before it may start to fall once again.
Manufacturers expanded in January at the slowest rate in eight months as the pace of new orders sharply slowed, according to the closely followed Institute for Supply Management, ISM index. The index fell to 51.3% from 56.5% in December. That's the lowest level since last May and economists had expected the index to drop to 56%. Still, any reading over 50% indicate more manufacturers are expanding instead of contracting. The ISM's new-orders gauge plunged -13.2% points to 51.2%, which was also the lowest level since May. And the employment gauge, a signal of hiring intentions fell -3.5% points to 52.3%.
Outlays for Construction projects rose +0.1% in December to a seasonally adjusted annual rate $930.5 billion, led by private projects, the Commerce Department reported. Economists had expected a +0.4% increase in December. Private-construction spending rose +1% in December, with a +2.6% increase for residential projects and a -0.7% decline for nonresidential projects. Mxeanwhile, public-construction spending fell 2.3% in December.
Friday, January 31, 2014 4:10
Well the end of this week has been interesting as the market kept whipsawing back and forth with the Dow for example seeing three of the days in triple digit closes. For the week though overall were only down about half a percent. It was however the worst January since 2010 being down about -3.5%! This is great for trading as premium is eaten up and especially for short term trading as it leaves indecision out there. I don’t see much changing for next week but we are getting a bit oversold on the downside so it could be an up week in the end. The Dow saw lows early on today of -240.00 points, S&P 500 -23.00 points and the Nasdaq -60.00 points almost out of the gate but bounced midday to almost getting back into the green before falling at the close once again.
At the close the Dow was down by -150.00 points to 15,699.00, S&P 500 -12.00 points to about 1783.00, S&P 100 -6.00 points to 790.00 and the Nasdaq Composite -19.00 points to about 4104.00. Oil was down closing -$.70 now around the $98.00 level.
Consumers boosted spending in December for the second straight month by dining out more and paying for other services, but they had to dip into their savings because of stagnant incomes. December consumer spending rose a seasonally adjusted +0.4%, Economists had forecast a +0.2% gain. The increase in December follows an upwardly revised +0.6% gain in November. The pace of spending in the last two months of the year marked the strongest back-to-back increase since the first two months of 2012. In December, Americans spent more on services, but they bought fewer long-lasting items like cars and appliances. Purchases of durable goods fell -1.4%, the first drop in three months. Weaker October spending dampened the impact of the fourth-quarter’s increase. The gain in that month was reduced to +0.1% from +0.4%. Consumer spending is the main engine of growth for the economy. People have generally been cautious spenders since the end of the recession, but a gradually improving economy, rising home values, higher stock prices and a steady increase in job creation may be encouraging them to spend a bit more freely.
The Chicago PMI fell in January to a still-strong 59.6% from 60.8% in December, but employment weakened for the second straight month. Economists had expected the index, formally known the Chicago business barometer, to decline to 59.8%. Readings above 50% indicate expansion.
Yesterday it was reported that the economy expanded rapidly in the final three months of 2013, as consumers shrugged off the government shutdown. The total value of all goods and services produced by the economy, known as gross domestic product, grew at a +3.2% annual pace in the fourth quarter. Economists had forecast a +3.3% gain. Leading the way was the biggest burst of consumer spending in three years and a snap-back in business investment. Sharply improved exports also added. The only major blip in the GDP report was the softest patch of spending in the housing market in 14 quarters. Builders turned a bit cautious in the waning months of 2013 as rising home prices and higher mortgage rates put off would-be buyers. And rates could rise even more in the months ahead. In any case, the economy’s strong year-end performance follows on the heels of a +4.1% growth rate in the third quarter. Taken together, the two periods combined to post the biggest back-to-back increase in growth since end of 2011 and start of 2012. It will be interesting to see the release of employment gains for the first month of 2014 next Friday. The January jobs report should help determine if the small +74,000 increase in December was a fluke. The average economy cannot truly catch fire until businesses step up their pace of hiring and put back to work the millions of Americans who still cannot find jobs. For the full year the U.S. economy grew +1.9% compared with +2.8% in 2012.
Tuesday, January 28, 2014 4:10
The market finally saw an up day after the Dow has seen 5 straight down days. The Dow saw highs of +120.00 points, S&P 500 +13.00 points and the Nasdaq +20.00 points mainly because Apple was down -8% all day. At the close the Dow was up by +91.00 points to 15,929.00, S&P 500 +14.00 points to about 1793.00, S&P 100 +3.00 points to 796.00 and the Nasdaq Composite +15.00 points to about 4098.00. Oil was up closing +$1.50 now around the $97.20 level. The big question now is if there will be any follow through tomorrow or if this was just to relieve the short term technical oversold condition. It is getting slightly oversold in the mid term but not quite enough to call a bottom as of yet.
Consumer confidence climbed in January, with assessments of both the present situation and expectations improving, The confidence index rose to 80.7% in January from 77.5% in December, topping the 77.1% poll. Consumers assessment of the present situation continues to improve, with both business conditions and the job market rated more favorably. Looking ahead six months, consumers expect the economy and their earnings to improve, but were somewhat mixed regarding the outlook for jobs. All in all, confidence appears to be back on track and rising expectations suggest the economy may pick up some momentum in the months ahead.
Orders for big-ticket items fell -4.3% in December and posted the biggest drop since midsummer, largely because of fewer bookings for autos, large aircraft and military hardware. Business investment outside of transportation and defense also softened and the increase in orders for November was trimmed. The report was disappointing as economists expected a +1.8% increase in orders. This could lead to a reduction in forecasts for fourth-quarter gross domestic product. Economists had predicted a +3.3% increase in GDP which will be released Thursday. Orders for large aircraft which we all need fell -17.5% in December and demand for autos fell -5.8%. Stripping out the volatile transportation sector, orders fell a smaller -1.6%.
Home prices fell -0.1% in November, the first decline in a year, with nine of 20 tracked cities posting price drops as winter approached. After seasonal adjustments, home prices in November rose +0.9% according to S&P/Case-Shiller's 20-city composite index. On a year-over-year basis, home prices rose +13.7% in November, the fastest growth in more than seven years. Pent-up demand and low inventories of homes for sale have been supporting price growth. Including November's results, prices remain about 20% below a 2006 peak, though certain cities, such as Dallas, have recently posted fresh record highs.
Monday, January 27, 2014 4:10
The market bounced out of the gate this morning surprisingly as traders made an attempt at trying to make up for Fridays losses but they failed as it turned into the red midday with the Dow seeing lows of -110.00 points, S&P 500 -17.00 points and the Nasdaq -70.00 points with the market selling into the end of the day. In the short term it is starting to get oversold so a bounce could start anytime here but it may not be the bottom this time around like it always was last year. That will be the question for sure but time will reveal that after month end.
At the close the Dow was down by -41.00 points to 15,838.00, S&P 500 -9.00 points to about 1782.00, S&P 100 -4.00 points to 793.00 and the Nasdaq Composite -45.00 points to about 4083.00. Oil was down closing -$1.00 now around the $95.50 level.
Sales of new single-family homes fell in December, but the whole of 2013 saw the highest sales level in five years. Sales of new single-family homes dropped -7% in December to a seasonally adjusted annual rate of 414,000, but were up +4.5% from a year earlier. For all of 2013, new-home sales hit 428,000, the most since 2008. Despite growth over 2013, sales remain far below a peak rate of almost 1.4 million in 2005. Economists had expected unseasonably harsh weather to hit December's results, forecasting an annual rate of 455,000, compared with an originally estimated November rate of 464,000. The median price of new homes rose +0.6% in December to $270,200. For 2013, the median price hit $265,800, up +8.4% from the prior year, the strongest annual growth since 2005. The supply of new homes on the market rose to 5 months in December at the current sales pace from 4.7 months in November.
Friday, January 24, 2014 4:10
The market continued under pressure overnight as it started the day on the downside once again with the Dow seeing quick lows of -180.00 points, S&P 500 -24.00 points and the Nasdaq -60.00 points and that continued all day as it ended the day right at its news lows of the day, never a good sign for the next trading day. It appears that the party of 2013 is now over as the market has been under pressure since the start of the year and volatility has taken over. Futures closed much lower than the cash market too so unless they make it up when the Asian markets open Sunday night it looks like we could see some more selling pressure come on line!!
At the close the Dow was down by -318.00 points to 15,879.00, S&P 500 -38.00 points to about 1790.00, S&P 100 -16.00 points to 796.00 and the Nasdaq Composite -91.00 points to about 4128.00. Oil was down closing -$.71 now around the $96.50 level.
Thursday, January 23, 2014 4:10
The market started this shortened trading week mixed as the Dow has been down but the S&P and Nasdaq have been slightly higher. Today it all fell apart on poor earnings reports and that China reported economic data that revealed a contraction though and the Dow saw lows of -240.00 points, S&P 500 -25.00 points and the Nasdaq -55.00 points midday but the final hour saw a bit of a bounce. One thing for sure it appears that volatility is kicking up and now the question is will the market correct enough before moving higher again. That will be a good test of a trend change in the market so we’ll see how this week ends!!
At the close the Dow was down by -176.00 points to 16,197.00, S&P 500 -24.00 point to about 1828.00, S&P 100 -6.00 points to 812.00 and the Nasdaq Composite -24.00 points to about 4219.00. Oil was up closing +$.65 now around the $97.00 level.
The pace of existing-home sales rose in December, pushing 2013’s tally to the highest level in seven years as an improving economy and pent-up demand boosted results. The seasonally adjusted annual rate of sales rose +1% in December to 4.87 million and for all of 2013 sales hit 5.09 million, the most since 2006, and up +9.1% from the prior year. Economists had expected a December sales rate of 4.9 million, matching NAR’s prior estimate for November. On Thursday NAR revised November’s sales rate to 4.82 million. The home-sales report echoes other recent data showing that the housing market had a strong 2013, though results sputtered toward the end of the year as mortgage rates rose. Low inventory levels have been supporting price growth. At the end of December, inventory was 1.86 million existing homes for sale, a 4.6-month supply at the current sales pace. Home buyers and sellers face a variety of challenges in 2014. Mortgage rates are expected to continue to rise, which could curb some purchase plans. Also, lenders and borrowers face new mortgage rules. But there’s also reason for optimism. There’s plenty of pent-up demand, and 2014 may see more young adults move out of their parents’ place. To support demand from young families and others, sufficient job growth is key, enabling more buyers to make a first-time purchase or trade up. Banks, who saw refinancing applications plunge last year as mortgage rates rose, could also support more home sales this year as they look to make more purchase loans.
Monday, January 13, 2014 4:10
On Friday after a dismal employment report saw an initial slide in the market it came back to close mixed completely ignoring the data. Today seemed to see the delayed action as the market started slightly lower but then sold off strongly as the day went on because traders started to remember that the Fed is cutting back, the economy is “okay” and future earnings are a little lofty pushing price/earnings a little high. The Dow saw lows of -200.00 points, S&P 500 -27.00 points and the Nasdaq -80.00 points in the final hour.
At the close the Dow was down by -179.00 points to 16,258.00, S&P 500 -23.00 point to about 1819.00, S&P 100 -9.00 points to 809.00 and the Nasdaq Composite -61.00 points to about 4113.00. Oil was down closing -$1.10 now around the $92.00 level and this could be another indication that the economy may not be as strong as people think. So far the volatility in the market has been nice! Were almost half way through the month and its down about -1.5%. Because of all the questions out there after a strong 2013 I think this is the way it will be for the year and that will be very profitable!!
There were just +74,000 jobs added in December to mark the smallest increase since the start of 2011, suggesting that the nation entered 2014 with less momentum than a raft of other economic indicators had signaled. The unemployment rate, meanwhile, fell to 6.7% from 7.0%, the lowest level since October 2008 but was only because more people dropped out of the labor force, -347,000 to be exact. Economists expected an increase of +193,000, with unemployment holding steady at 7.0% in December. Retailers posted the biggest increase in hiring in December, adding +55,000 jobs, and manufacturers also increased employment. Yet hiring was weak across most other sectors, reversing the broad gains seen in November. Average hourly wages, meanwhile, rose +2 cents to $24.17 while the average workweek fell -0.1 hour to 34.4 hours. The civilian participation rate fell two ticks to 62.8%, matching a 35-year low. The employment gain in November, meanwhile, was bumped up to 241,000 from a first read of 203,000. October's gain was unchanged at 200,000. Employment ended the year adding roughly the same number of workers as it did in 2012, based on the preliminary numbers.
Wednesday, January 8, 2014 8:10
The market so far this week has been mixed closing down again on Monday but then rallying from a short term oversold zone yesterday. Today it started off really bad with the Dow seeing quick lows of -120.00 points, S&P 500 -7.00 points and the Nasdaq -10.00 points but was able to recoup them to become mixed with tech stocks higher. However when the Fed released its minutes from its last meeting at 2:15 est. saying that officials agreed in December to begin winding down their asset-purchase program, the market fell back to lows again. They said that most believed that the benefits of the controversial policy were eroding as time passed. “A majority of participants judged that the marginal efficacy of purchases was likely declining as purchases continue.” By a 9-to-1 vote, the Fed decided to trim its asset-purchase program by $10 billion to $75 billion per month starting in January. Now that Yellen will be taking the reigns from Bernanke that could change but unlikely as the economy albeit slight is improving and the asset purchases are doing little to help all but the banks.
At the close the Dow was down by -68.00 points to 16,463.00, S&P 500 -.40 point to about 1837.00, S&P 100 -2.00 points to 818.00 and the Nasdaq Composite +12.00 points to about 4166.00. Oil was down again closing -$1.60 now around the $92.00 level and this could be an indication that the economy may not be as strong as we suspect in the future.
Private-sector employers added the most jobs in more than a year in December, with gains across a variety of business sizes and sectors, according to data. Private employers added +238,000 jobs last month, the most since November 2012. Trends also show improvement: Private employers added an average of +224,000 jobs per month in the fourth quarter, slightly up from an average of 211,000 during the year-earlier period. “It appears that businesses are growing more confident and increasing their hiring,” said Mark Zandi, chief economist of Moody’s Analytics, which prepares the report using ADP’s data. Notably, ADP’s private-employment showed that goods producers added +69,000 jobs in December, the most since 2006, supported by the housing market’s recovery.
The improving data on private-sector jobs has been echoed by a variety of other recent labor-market reports. Recent signs from firms show hiring is picking up, and businesses are increasing investment in durable goods, reflecting their confidence in the economy. Even workers are feeling secure enough to leave their jobs, with a recent report showing that quitting is on the rise, strangely that's a good sign. Its the quality of jobs that is in question though. Economists expect the government’s report this Friday to reflect that unusually bad weather conditions dampened hiring in December, with nonfarm employment rising by +190,000 jobs, compared with an increase of +203,000 last month.
Thursday, January 2, 2014 4:10
Well surprisingly the market started the year on a down note after it finished the year with an average +30% yearly gain. The Dow saw lows of -170.00 points, S&P 500 -21.00 points and the Nasdaq -55.00 points. It didn’t come back very much after that either with the Dow closing down by -135.00 points to 16,441.00, S&P 500 -16.00 point to about 1832.00, S&P 100 -7.00 points to 817.00 and the Nasdaq Composite -34.00 points to about 4143.00. Oil was flat closing up +$0.2 around the $95.50 level. This is a good example of how volatility is likely to kick up in the coming year which should make for a nice year of trading. Outside of the 5-year period when the Internet was invented from 1995 to 1999 and the market rose about +30% the first year then followed with +20% gains, every other time there was this large a rise the next year was up but by only about +10% and volatility kicked up a lot. Cycle wise this also makes sense as this bull run is getting old and will soon match the 1995 to 1999 run and 2003 to 2008! I think in the end this is going to be a properly functioning market once again with both up and down periods which will be nice to see once again!
Jobless Claims fell by -2,000 to 339,000. Economists expected claims a rough proxy for layoffs to total 342,000 on a seasonally adjusted basis. The average of new claims over the past month, usually a more reliable gauge than the volatile weekly number, rose by +8,500 to 357,250. That's the highest level since late October, but the increase likely reflects a temporary holiday-season spike that will fade over the next few weeks. Also, continuing claims fell by -98,000 to a seasonally adjusted 2.83 million in the week ended Dec. 21st. Continuing claims reflect the number of people already receiving regular unemployment benefits, which last 26 weeks in most states. Initial claims from two weeks ago, meanwhile, were revised up to 341,000 from an original read of 338,000, based on more complete data.
Manufacturing companies expanded at a slightly slower but still-healthy pace in December compared to the prior month, according to the closely followed ISM index. The index slipped to 57% from a two-and-a-half year high of 57.3% in November. Economists had expected the index to drop to 56.6%. Reading over 50 indicate more manufacturers are expanding instead of contracting.
Friday, December 27, 2013 4:10
First off, I want to say I’m sorry I've been kind of silent the past week and a half but I have been dealing with the unexpected death of a very close friend.
Since the Fed decided it would at least start to taper by $10 billion per month the market has rallied all week with the holiday and this was the first day it closed slightly lower. At the close the Dow was down by -2.00 points to 16,478.00, S&P 500 -.60 point to about 1841.00, S&P 100 -.20 points to 821.00 and the Nasdaq Composite -11.00 points to about 4157.00. Oil was up +$.60 around the $100.00 level. There are two days left in the year and the market is pushing a gain of almost +30% for the year on lower and lower volume which is unhealthy at the least. One thing for sure if we do close at these levels history indicates that volatility kicks up the following year although the market generally has gains once again but of only +10%. I’ll have more about that after we finish the year, I hope you all have a good weekend!
Monday, December 16, 2013 4:10
Last week the market was down about -1.5%, only up last Monday as the strong economic data and the possibility of the Fed starting to taper at their meeting this Wednesday started to take hold. Today it started the day strong as it is oversold in the short term with the Dow seeing highs of +180.00 points, S&P 500 +17.00 points and the Nasdaq +45.00 points but as the day went on the rally faded.
The final hour saw the market change very little with the Dow up by +129.00 points to 15,885.00, S&P 500 +11.00 points to about 1787.00, S&P 100 +5.00 points to 797.00 and the Nasdaq Composite +29.00 points to about 4030.00. Oil was up +$.72 around the $97.30 level.
This morning strength continued with manufacturing conditions in the New York area recovered slightly in December after a surprise negative reading in the prior month. But the improvement was below expectations and suggested that factory activity was treading water in the region. The Empire State’s general business conditions index rose to +1% in December from negative -2.2% in November. The recovery was less than expected. Economists expected a positive +5% reading. The so-called internals were generally disappointing: the new-orders component remained a negative -3.5% from negative -5.5% and labor market indicators remained weak. One bright spot was the shipment component, which improved to +7.7% in December from negative -0.5% in the prior month. The Empire State index is the first of several regional manufacturing gauges to be released. They can frequently be volatile from month to month but taken together they present one of the timeliest reads on a critically cyclical sector.
Companies and workers were the most productive in the third quarter in nearly four years, but the number wasn’t that great! Productivity was up +3% at an annual rate from July to September, up from a preliminary read of +1.9%. This is the fastest rate since the final months of 2009, when productivity jumped +4.7%. Productivity is not something most people think a lot about aside from executives and economists but it’s really what makes a country rich. Faster productivity growth leads to better wages for workers, higher profits for companies and all kinds of good things. Think of it as the rising tide that lifts all or most boats. The problem is, productivity has slowed dramatically in the aftermath of the last recession (December 2007 to June 2009.) It’s averaged a meager +0.3% increase over the past four quarters and it’s running at a roughly +1% clip in the last eight quarters. By contrast, the growth in productivity averaged a +2.4% increase from 1990 to 2007. The decline in productivity poses a problem because as productivity wanes, businesses hire more employees to keep up with an increase in demand for goods and services. After all, their current workforce simply can’t keep up. Yet so far companies do not appear to have hired as many workers as the drop in productivity growth would suggest based on the historical record. And that’s the biggest reason why worker wages are growing so slowly (1.6% annual rate), acting as another drag on the economy. There’s still too many people seeking too few jobs. What’s unclear is whether the slowdown in productivity is temporary or part of a longer-term trend so the answer may have implications. A speed-up in productivity-growth trends would ease the economic problems of the past six years but slower increases in productivity would mean that we have to get used to a higher jobless rate, weaker growth and less economic opportunity in the years to come.
Monday, December 9, 2013 4:10
The market decided after four straight down days due to strong economic data that it was time to turn around on Friday even though the Employment report came out way better than expected. The market closed up about +1% on the day. Data that had come out earlier in the week had hurt the market. Today however saw the market mostly flat but still to the upside with the Dow seeing highs of +50.00 points, S&P 500 +7.00 points and the Nasdaq +20.00 points early on. The final hour saw the market turn mixed however but held it together enough in the end with the Dow up by +5.00 points to 16,025.00, S&P 500 +3.00 points to about 1808.00, S&P 100 +2.00 points to 807.00 and the Nasdaq Composite +6.00 points to about 4068.00. Oil was down -$.40 around the $97.00 level.
The markets bullishness has now hit an extreme as there is no one out there that thinks this market will ever go down. It continues to be overbought in the intermediate term also and volume continues to shrink. The move on Friday was also met with low volume. Because volume is so low the plan may be to hold the market around here until the end of the year and then start fresh with a new year. This coming week could be very telling actually.
The economy produced +203,000 jobs in November and the unemployment rate fell to 7.0% from 7.3%. The drop in unemployment largely reflects the return of federal workers though. The jobless rate is now at the lowest level since November 2008. It does offer further proof that hiring picked up in the fall after a midsummer slowdown, suggesting the U.S. economy will continue to grow at a moderate pace. Economists had expected a gain of +180,000. Hiring in November was strong in most industries, including transportation and warehousing, professional and business services, manufacturing, health care, construction and retail. The federal government cut employment again and has lost -92,000 jobs in the past 12 months. Average hourly wages, meanwhile, rose +4 cents to $24.15 while the average workweek edged up 0.1 hour to 34.5 hours. The civilian participation rate rose to 63% from 62.8%. Employment gains for October and September, meanwhile, were little changed overall. The number of new jobs created in October was trimmed to +200,000 from +204,000, while September's figure was raised to +175,000 from +163,000.
Thursday, December 5, 2013 4:10
The market continues to be under pressure this week as economic data continues to point to strength. The market has been lower every day and today, was no exception. Taper talk is back again so the Dow saw lows of -80.00 points, S&P 500 -10.00 points and the Nasdaq -15.00 points. For the fifth day on the row the market has been down with the Dow down by -68.00 points to 15,822, S&P 500 -8.00 points to about 1785.00, S&P 100 -4.00 points to 797.00 and the Nasdaq Composite -5.00 points to about 4033.00. Oil was up +$.10 around the $97.00 level. Tomorrow the most important economic report of the month comes out with economists expecting the government’s report to show that nonfarm employment rose by +180,000 jobs in November, compared with an increase of +204,000 in October. Markets are searching the jobs data this week for clues about when the Fed will deem the economy healthy enough to start paring its massive asset-purchase program, which officials crafted to stimulate growth by keeping downward pressure on long-term interest rates.
One of the reasons the market has been down is economic data has been pretty strong of late and this morning it was reported that the economy expanded by a +3.6% annual pace in the third quarter to mark the fastest increase in a year and a half, but the revised gain was fueled by a huge buildup in inventories that’s likely to prove temporary. This was the largest increase in inventories since 1998, and such large increases are usually followed by slower inventory growth in the following quarter. Most economists expect a slowdown in the final three months of 2013 that would’ve dragged GDP below +2%. The +3.6% annualized growth rate is the fastest since the first quarter of 2012. Economists had expected gross domestic product to be revised up to +3.2% from an initial reading of +2.8%. Consumer spending, the main engine of the economy, was trimmed to a +1.4% increase from +1.5%. Also, final sales of U.S produced goods and services was cut to +1.9% from an original estimate of +2.0%.
Jobless Claims fell by -23,000 last week to 298,000, but the decline may have been skewed by difficulties in making seasonal adjustments during the holidays. The average of new claims over the past month, a more reliable gauge than the volatile weekly number, fell by -10,750 to 322,250. That’s also the lowest level since September. continuing claims decreased by -21,000 to a seasonally adjusted 2.74 million. Continuing claims reflect the number of people already receiving benefits.
Initial claims from two weeks ago were revised up to 321,000 from an original reading of 316,000, based on more complete data collected at the state level. Economists expected claims to rise to 325,000.
Yesterday it was reported that Private-sector hiring in November was the hottest in a year, as +215,000 jobs were added, according to ADP. The result blew past the consensus economist forecast, which had expected a November result of +178,000 new private jobs, up from an originally estimated gain of 130,000 in October, when the government shutdown hit the labor market. On Wednesday, ADP revised October’s gain to +184,000. “The job market remained surprisingly resilient to the government shutdown and brinkmanship over the Treasury debt limit. Employers across all industries and company sizes looked through the political battle in Washington. If anything, job growth appears to be picking up,” said Mark Zandi, chief economist of Moody’s Analytics, which prepares the report with ADP’s data. The official U.S. Labor Department’s employment report, which will be released Friday and which includes government jobs in addition to the private sector.
People looking to buy newly built homes evidently brushed off concerns about the government shutdown in October, pushing up sales to their highest level in fourth months on the lure of lower prices. New homes sold at an annual rate of 444,000 in October, up +25.4% from 354,000 in September. Economists forecast sales to total a seasonally adjusted 419,000 in October. The collection of sales data for both months was delayed by the fed shutdown, prompting the government to release the information on the same day. Demand in October was strong across the country, with double-digit percent gains in all four major regions. Part of what drove sales was a decline in prices and more demand for lower-prices homes, a trend that typically emerges in the colder months. The median price of new homes fell -5.3% to $245,800 in October. That's the lowest level since November 2012. The supply of new homes on the market, meanwhile, sank to 4.9 months in October at the current sales pace from 6.4 months in September. New home sales are +21.6% higher compared to one year ago.
Monday, December 2, 2013 4:10
Interesting fact: Just to put this in perspective, the total sales of adult diapers in Japan is about to exceed that of baby diapers. Another thing is that they are about to promote the use of nursing care robots to meet expected increases in demand in the face of Japan’s rapidly aging population.
The market finished the shortened-holiday week with another gain, up for eight consecutive weeks and the S&P 500 set its longest winning streak in nearly 10 years, while it was the Dow's longest consecutive weekly increase in three years. Both indexes are up just under +7%, in that period which in itself is outstanding. However, although its been said before and hard to believe it won’t last forever.
This has been a year of an anomaly because the market doesn’t go up +26% every year as the usual average is +8% to 10%. Since the 1900s, December is the best month for the Dow, and second-best month for the S&P 500 and Nasdaq. Historically, all three indexes have gained on average between +1% and 2%, respectively. The trend holds in recent times as well. In the past 20 years, the S&P finished positive 80% of the time, while the Dow rose 75% of the time but it drops to only 55% of the time for the Nasdaq. The real outlier, however, has been the Russell 2000 index, which posted a gain 85% of the time, up on average +3%. Small-caps outperformed large caps by a large margin in 2013, rising 35% compared with an increase of 27%t for the S&P. It's shaping out to be the best year for the Russell since 2003, and the best for the S&P since 1998.
This may mean the market will hold up this year but it may end up being a flat month to finish the year with these decent gains just because we’ve been up for 8 straight weeks. What I’m trying to focus on now is what will it be next year that will become exciting because I’m sure volatility will kick up for sure as fundamentals and technicals are revealing that. The only time the market has continued with heady gains like this the following years was just after the internet was invented by Al Gore, (little poke there). There is nothing like that happening right now and even just looking at margin debt hitting another new record high in October, institutional and corporate insider selling, plus earnings estimates for companies getting a little pricey, we see that were sure to see volatility at the least will likely start next year which will be great for trading.
Today was mostly a mixed day but the final hour saw selling for the market and by the close the Dow was down by -78.00 points to 16,009, S&P 500 -5.00 points to about 1801.00, S&P 100 -3.00 points to 804.00 and the Nasdaq Composite -15.00 points to about 4045.00. Oil was up +$1.00 around the $94.00 level.
Manufacturing conditions improved in November to their best level in more than two years. The Institute for Supply Management’s manufacturing index climbed to 57.3% from 56.4% in October, reaching the highest level since April 2011. The reading topped the 55% expected. The new-orders index increased in November by 3 percentage points to 63.6%, and the production index increased by 2 percentage points to 62.8%. Readings in the so-called diffusion index above 50% indicate expansion. Similar surveys taken across the globe saw generally stronger conditions, with multi-year highs in Germany, Japan and the U.K. Even hard-hit Greece saw reason for optimism, with its first rise in output in more than four years. These surveys tend to have a strong correlation with actual output, and their timeliness make them a closely scrutinized indicator. But in recent months, they have run a bit hotter than actual production would suggest.
Wednesday, November 27, 2013 4:10
With this being the final full trading of the week because of Thanksgiving tomorrow, the market started higher with the Dow seeing highs of +40.00 points, S&P 500 +6.00 points and the Nasdaq +20.00 points. Midday, gains were lost and the Dow and S&P actually turned negative but by the close the buyers came back to hold the market up for the week on ever declining volume.
At the close the Dow was up by +25.00 points to 16,097.00, S&P 500 +4.50 points to about 1807.00, S&P 100 +2.10 points to 806.00 and the Nasdaq Composite +27.00 points to about 4045.00. Oil was mostly down by -$1.35 around the $92.00 level.
Jobless Claims fell by -10,000 to 316,000, the lowest level since the last week of September, though claims are often volatile during the holiday season and harder to decipher as an indicator of labor-market trends. Economists expected claims to rise to 330,000 on a seasonally adjusted basis. The average of new claims over the past month, a more reliable gauge than the volatile weekly number, declined by -7,500 to 331,750, the lowest level in nearly two months. Also, the government said continuing claims fell by -91,000 to a seasonally adjusted 2.78 million. Continuing claims reflect the number of people already receiving benefits. Initial claims from two weeks ago, meanwhile, were revised up to 326,000 from an original reading of 323,000, based on more complete data collected at the state level.
Orders for big-ticket items fell -2% in October, largely because of fewer contracts for jumbo jets, but business investment was soft in most major industries. Economists had expected durable-goods orders to drop -2.2%. Stripping out the volatile transportation sector, orders fell a smaller -0.1%. Orders for core capital goods, a proxy for business investment, dropped -1.2% to mark the third decline in five months. Shipments of core capital goods, a category used to calculate quarterly economic growth, dipped -0.2% in October to match the decline in September. Total durable-goods orders for September, meanwhile, were revised up to show a +4.1% gain vs. a prior reading of +3.8%. In the first 10 months of 2013, orders for durable goods have risen a lackluster +4.8% compared to the year-earlier period. Core orders are up +4.1% in the same span.
A gauge of Chicago-area businesses somewhat pulled back in November, after rising in October to the strongest level since March 2011, but still beat the consensus estimate from analysts, according to data released Wednesday. The Chicago purchasing managers index fell to 63% in November, led by new orders, production and order backlogs. Economists surveyed by MarketWatch had expected a November index reading of 59, compared with 65.9% in October. Results over 50% indicate an expansion from the prior month.
A gauge of consumer sentiment rose to a final reading of 75.1% in November from 73.2% in October. Economists had expected a final November reading of 73%, compared with a preliminary monthly reading of 72%, which was the lowest since December 2011.
Tuesday, November 26, 2013 4:10
The Dow and S&P 500 made need new highs last week with the Dow seeing 16,000 and the S&P 500 1800.00. Today tech stocks completed it with the Nasdaq clearing 4000. These are new highs for the Dow and S&P but the Nasdaq is still a little over 1000 points away. Today and yesterday the market made nice new intraday highs but by the close it pulled back. Today was most interesting because volume finally picked up but mostly because selling took hold. This is strange being a holiday trading week with Thanksgiving on Thursday and only a half day of trading Friday! The Dow saw highs of +60.00 points, S&P 500 +7.00 points and the Nasdaq +40.00 points.
At the close the Dow was up by +.26 points to 16,073.00, S&P 500 +.27 points to about 1803.00, S&P 100 -.10 points to 804.00 and the Nasdaq Composite +23.00 points to about 4018.00. Oil was mostly down by -$.50 around the $93.00 level.
The consumer confidence index fell in November to 70.4% from 71.2% from in October, as people grew somewhat more worried about future employment and income prospects. Economists had expected the index to rise to 72.4%. The future expectations index slipped to 69.3% from 72.2%, while the present situation index dipped to 72% from 72.6%. "When looking ahead six months, consumers expressed greater concern about future job and earning prospects, but remain neutral about economic conditions," said Lynn Franco, director of economic indicators at the Conference Board. "All in all, with such uncertainly prevailing, this could be a challenging holiday season for retailers."
The pace of pending home sales fell in October for the fifth straight month, reflecting higher mortgage rates, a low number of properties for sale and effects from the government shutdown. The pending home sales index fell -0.6% to 102.1% and dropped to its lowest level since last December. One year earlier, the index stood at 103.8%. "The government shutdown in the first half of last month sidelined some potential buyers. In a survey, 17% of realtors reported delays in October, mostly from waiting for IRS income verification for mortgage approval," said Lawrence Yun, NAR's chief economist. Yun said sales could pick up a bit going forward, but probably not much given all the headwinds. A sale is listed as pending when the contract has been signed. Sales are typically finalized within one or two months of signing.
Wednesday, November 20, 2013 4:10
The market started the day higher after Ben Bernanke became very dovish last night in his farewell speech saying that even after unemployment drops to below 6.5% the Fed may continue its stimulus packages every month. Unemployment right now is at 7.3%.
He may be right though as the the broader U6 unemployment rate is still more like 14% and ShadowStats calculates the actual unemployment rate of actual people who want jobs but don't have them or people who want them and have crap jobs is more like 24%. No wonder over 89% of all people in the U.S hate their jobs!!
The Dow saw highs of +50.00 points, S&P 500 +6.00 points and the Nasdaq +20.00 points but when the Fed released their minutes at 2:00 p.m est with the slightest hint that tapering may start in the next couple of months the market started to fall with the Dow seeing lows of -100.00 points, S&P 500 -11.00 points and the Nasdaq Composite -20.00 points in the final hour. At the close the Dow was down by -66.00 points to 15,901.00, S&P 500 -6.50 points to about 1791.00, S&P 100 -3.00 points to 796.00 and the Nasdaq Composite -10.00 points to about 3921.00. Oil was mostly flat by -$.01 around the $93.00 level.
Minutes from the October 29-30th meeting showed that officials considered reducing the size of the asset-purchase program even “before an unambiguous further improvement in the labor-market outlook was apparent.” And “many members” by members, the Fed is referring to voters — “stressed the data-dependent nature of the current asset purchase program, and some pointed out that, if economic conditions warranted, the committee could decide to slow the pace of purchases at one of its next few meetings.”
Sales of existing homes fell -3.2% in October to a seasonally adjusted annual rate of 5.12 million, a second month of declines, as rising mortgage rates and prices cut affordability. October's rate, the slowest pace in four months, just about matched the estimate from economists, who had expected a sales pace of 5.1 million, with sales pulling back after buyers rushed over the summer to lock in low mortgage rates. The sales pace in October was up 6% from the year-earlier period, a sharp drop from annual growth of more than 10% in September. The median sales price of used homes hit $199,500 in October, up +12.8% from the year-earlier period, supported by low inventory. October's inventory was 2.13 million existing homes for sale, a five-month supply at the current sales pace, up +0.9% from the year-earlier period.
Monday, November 18, 2013 4:10
Interestingly the market was higher this morning with the Dow moving over the 16,000 level and the S&P 500 1800 with the Dow seeing highs of +80.00 points, S&P 500 +6.00 points and the Nasdaq +15.00 points but when Carl Icahn made some comments that the market was due for some type of correction it started to fall with the Dow seeing lows of -40.00 points, S&P 500 -11.00 points and the Nasdaq Composite -45.00 points in the final hour. Of course the dip buyers came back in so at the close the Dow was up by +14.00 points to 15,976.00, S&P 500 -7.00 points to about 1792.00, S&P 100 -2.00 points to 800.00 and the Nasdaq Composite -37.00 points to about 3949.00. Oil was down again by -$.85 around the $93.00 level.
Another negative has come out that you don’t hear about in the market. Major institutional investors are unloading shares in equities on to private investors and you see a similar situation unfolding through data from Lipper. One of the best ways to track small mom-and-pop investors is through mutual fund inflows. This data captures a lot of the activity in retirement funds. From 2007 until the end of 2012, investors pulled over $405 billion out of stock-based mutual funds. 2012 saw more than $90 billion pulled out alone in the largest withdrawal since 2008. According to research by the Leuthold Group, between the March 2009 and May 2012, when the S&P 500 had gained +107%, just nine of those 38 months saw net inflows.
So far the Fed has changed this this year as they have finally tricked investors to move into stocks this year, and now small investors are going all in. They have poured $277 billion into stock mutual funds in 2013. In the last five weeks alone, investors have invested $45.5 billion. However, last week, ETFs that are largely owned by institutional investors saw massive outflows: The SPDR S&P 500 ETF Trust lost $4.6 billion of investor money. The iShares Russell 2000 ETF saw $2.6 billion walk out the door. Meanwhile, small investors kept piling in, with $3 billion added to mutual funds. At this pace, we'll see the largest allocation of investor money to stock-based mutual funds since 2000, when investors put $324 billion into stocks,,,,,, just before the tech bubble burst as a result of wildly overvalued stocks. Basically, In the three months leading up to the Nasdaq's peak in March 2000, investors put more than $138 billion into equity mutual funds and ETFs, nearly half of what was invested in stocks for that entire year. Market sentiment, when divided between institutional investors and small retail investors, shows a disturbing trend because right as the market tops it seems small investors buy in, as the big players take gains, leaving the little guys holding shares as they fall.
Right now its simple,, QE infinite = bubble with no end....easy but also wrong. The laughable injection of money that has been printed in order to buy bonds and keep interests low, has obviously driven the investment funds towards equities pumping this apparently perpetual bubble. The result is a Ponzi scheme where valuations of stocks are not linked to their earnings but simply to the fact that the money entering the stock market is higher than the money leaving it. As any other Ponzi scheme this one also will collapse as soon as the herd leaving the stock market will surpass the one entering it. And whatever the cause is enough for that to happen when the stock market is highly unstable like it actually is. When that happens whatever amount of money Yellen will drive towards bonds won' t be enough to save the stock market that will collapse under its weight of unreal PE's which is now on the high side on current levels.
Thursday, November 14, 2013 4:10
Going into yesterday we were seeing the market volatile but when Janet Yellen the new upcoming Fed chief released her notes before her confirmation hearing today, the market rallied and now giving it a +1% gain for the week. It continued higher today with the Dow seeing highs of +70.00 points, S&P 500 +10.00 points and the Nasdaq +15.00 points in the final hour on the ever dwindling volume and a very poor advance/decline line. As we go into expiration tomorrow there's a good chance of sharp breakdown as the hourly charts are at nose bleed levels along with other indicators so it could be an interesting expiration day.
At the close the Dow was up by +54.00 points to 15,876.00, S&P 500 +7.00 points to about 1791.00, S&P 100 +3.00 points to 798.00 and the Nasdaq Composite +7.00 points to about 3973.00. Oil was up slightly by +$.25 around the $94.00 level.
Friday, November 8, 2013 4:10
Okay now you know the market is crazy!! We get good economic data indicating the economy is getting better but the market sells off because it means the free money from the Fed may come to an end! People might actually have to work to increase their stock valuations!! Just like our society has fallen victim to free money so has the stock market. When it was reported before the open that employment added +204,000 jobs Globex futures sold off and bond yields backed up. It wasn’t to bad at the open though so the dip buyers came back in to push the market up with the Dow seeing highs of +175.00 points, S&P 500 +24.00 points and the Nasdaq +65.00 points in the final hour on dwindling volume, regaining what it lost yesterday. The question now is will the dip buyers be correct or not as volume fell off again and remarkably the advance/decline ration was only about +150 going into the final hour. This morning it was also reported by another sentiment reading from Investors Intelligence that they only had 15.6% bears, the lowest level since 1988! With it being an expiration traded week it should be interesting!!
At the close the Dow was up by +167.00 points to 15,762.00, S&P 500 +23.00 points to about 1771.00, S&P 100 +9.00 points to 790.00 and the Nasdaq Composite +62.00 points to about 3919.00. Oil was up slightly by +$.25 around the $94.50 level.
The economy added +204,000 jobs in October, double the forecast and despite the government shutdown. It was expected to put a damper on hiring. And hiring for September and August were revised up by a combined +60,000. The unemployment rate, meanwhile, ticked up to 7.3% from 7.2% in what was likely a residue of the shutdown. Federal workers would have been classified as unemployed under the government's method for calculating the unemployment rate. The largest slice of hiring in October took place at retailers, bars and restaurants, lower-paying establishments that tend to boost hiring temporarily for the holiday season. Yet almost every industry aside from government added workers. The surprising increase in jobs raises questions about whether the shutdown distorted the government's normal process of collecting the data, but Labor officials said the response rate to its surveys appeared normal. The upwardly revised gains in August and September suggest the economy might more strength than it appears. Economists expected an increase of +100,000 jobs in October. The number of new jobs created in September was raised to +163,000 from +148,000, while August's figure was upped to 238,000 from 193,000. Average hourly wages, meanwhile, edged up +2 cents to $24.10 while the average workweek was unchanged at 34.4 hours.
Spending by consumers tapered off slightly in September, the government reported. Consumer spending rose +0.2% in September, down from an unrevised +0.3% gain in August. Personal incomes rose a seasonally adjusted +0.5%, boosted by renewed payments to federal workers who had lost money due to furloughs. Economists had forecast a +0.3% advance in both spending and personal income. Since incomes rose faster than spending, the personal savings rate climbed to 4.9% from 4.7%, marking the highest level since last December. Meanwhile, inflation as gauged by the PCE price index increased +0.1%, with the core rate excluding food and energy rising by the same amount. Over the past 12 months the PCE index has risen +0.9% overall or by +1.2% on a core basis. Yet the rise in consumer incomes is barely outpacing inflation. The release of the spending report was delayed by more than a week because of the government shutdown in October.
Thursday, November 7, 2013 4:10
So far the market this week has been mixed but the meager 500 million shares traded yesterday was one of the first warning signs that it may not hold and the fact that tech stocks closed a lot lower on the day while the rest of the market was higher. No one right now is talking about volume but when you’ve gone from 2.5 billion per day in 2000 and 13 years later your not even seeing a quarter of that, you should be shaking your head! Plus the fact that bullish sentiment overall from newsletter writers hit its highest level since the 2011 level top makes you think. This is an interesting indicator that in the past 16 years has only hit 7 extreme readings and afterward has seen the market see a decent correction occur, or at the least a few times a consolidation. With margin debt also hitting extremes and the market up about +24% for the year, and depressing snow starting to appear on the hillsides, it was no wonder we were down today.
Actually, the day was looking to be a lot stronger as the market hit new highs early on as the ECB announced that they would lower interest rates to keep things going and may even go negative to keep the party alive. Globex futures rallied on the news but when Gross domestic product was reported just before the open, rising at an annual rate of +2.8% in the third quarter, up from 2.5% in the prior quarter, the open was much less then expected. When selling really took hold the market sold off. The Dow saw lows of -170.00 points, S&P 500 -25.00 points and the Nasdaq -80.00 points. At the close the Dow was down by -153.00 points to 15,594.00, S&P 500 -23.00 points to about 1747.00, S&P 100 -10.00 points to 781.00 and the Nasdaq Composite -75.00 points to about 3857.00. Oil was down again today by -$.75 around the $94.00 level.
This could be the start of some volatility kicking in. You have to go back a decade to find a rally that was twice as long as the one were currently in without a -10% correction from March 2003 to October 2007. It is interesting that the market’s year-to-date returns since January 1st have never dipped into the red. One thing for sure is that the regular pullbacks of years past fool you into thinking that we have to have one this time cause the Fed is still feeding beast! The market loves its quantitative easing punch bowl. And while some strongly believe that the Fed has an obligation to end the party before things get too sloppy, economic data like today indicate it could end sooner than later!
Friday, November 1, 2013 4:10
As we end the week we see the market finishing mostly flat from the start of the week as the last couple of days have seen it fall on worries that maybe the Fed may begin to taper someday after all! Earlier in the week there were rumors flying around that the new upcoming Fed chief Yellen would increase QE to $100 billion per month from $85. After the Feds statement on Wednesday indicating mixed thoughts on stopping the tapering, the market started to sell off. Today the market was mostly flat to down until the final hour when the Dow saw highs of +80.00 points, S&P 500 +6.00 points and the Nasdaq +10.00 points. At the close the Dow was up by +70.00 points to 15,616.00, S&P 500 +5.00 points to about 1762.00, S&P 100 +2.00 points to 786.00 and the Nasdaq Composite +2.00 points to about 3922.00. Oil was down again today by -$1.80 around the $95.00 level.
Now that October is done it has always been considered one of the worst months of the year for the stock market but this time around we see that this one has been up just about +5%. We also saw that September gains were positive and having back to back gains has only happened four other times in the last 30 years. This makes it noteworthy because September historically has been the worst month of the year, and in those few years in which September is unexpectedly strong, October is usually down. Not this year, however and what's interesting is that the market in the past has performed poorly following those prior occasions in which we saw back-to-back returns in both September and October. One such occasion was in 2007, at the top of the 2002-2007 bull market, right before the Great Recession and the terrible 2007-2009 bear market. Of course it could continue higher but the odds are at the least pointing to a slowdown in the advance and we could see a correction in November so its wise to be aware!
Monday, October 28, 2013 4:10
Interesting look at debt:
Last week saw a one day explosion of $328 billion to the U.S. debt load smashed the previous record of $238 billion in one day, set two years ago and the debt clock moved over the $17 trillion mark. These types of explosions upward in the amount of debt, are figures that would normally be seen in banana republics. Think about it, you have QE of $500 billion a month, or a $1 trillion a month, certainly are not out of the realm of possibility at this rate of deficit spending. In 7 years the American debt load more than doubled from $8 trillion to more than $17 trillion. Prior to that it took 14 years to double from $4 trillion to $8 trillion. The debt growth is now a mathematical function called exponential, which means plotted on a log curve, we are truly going parabolic so it is highly likely the debt will double yet again in 3.5 years or roughly by sometime in 2017.
Last week saw the market volatile closing up and down just about every day and in the end was up about +1% for the week. Today the market started the day a bit lower but going into the final hour the Dow saw highs of +30.00 points, S&P 500 +6.00 points and the Nasdaq +10.00 points. At the close the Dow was up by -2.00 points to 15,569.00, S&P 500 +2.00 points to about 1762.00, S&P 100 +2.00 points to 785.00 and the Nasdaq Composite -3.00 points to about 3940.00. Oil closed down again for the week below $100.00 but was up today +$.80 around the $99.00 level. Now that expiration is finished, the budget/debt ceiling impasse will be forgotten for awhile, this week could be interesting for the market as it is incredibly overbought in the short term and earnings will really start coming out and so far they haven’t been that great and aren’t expected to get any better. The Fed is also meeting and of late traders have been really paying attention to what they have to say.
Late this summer it was reported that margin debt for borrowing money to invest hit record highs of $384 billion. New data that just came out for September shows another record high of $400 billion now or 300% margin growth. That available cash figure now stands at negative $92.2 billion. The only time period in history that exceeds this amount were the months between December 1999 through September 2000. Net margin debt (calculated as a difference of debt in margin accounts and all credit balances) also reached a high level of $106 billion, and the pace of net margin debt increase YTD ($87bn) was the highest on record. Today it was reported by JP Morgan that their proprietary measure of excess liquidity in the financial system has reached a record high never been seen before! To analyze the relationship between S&P 500 prices and margin debt we look at their historical levels over the last 15 years. Peaks in margin debt are usually followed with a sharp market correction. So far the market has just continued higher so you can see we are walking a fine line here.
That being said it makes one think if margin debt is that high is the market fundamentally sound for earnings? I read this very interesting commentary today that was a different look at the condition of the market. "It is really going to end badly," is the ominous warning that Damien Cleusix has issued to his clients as he believes we are now reaching the top of the secular bull market. Crucially, he sees the markets as "grossly over-valued" but that it is hidden from most people's perceptions because (just as in 2000 and 2007) there are marginal sectors that make the 'aggregate' seem reasonable (not to mention the dreams of forward earnings.) His approach of a point-in-time Price-to-Sales comp shows the median valuation its highest in 23 years.. and Alan Greenspan's infamous "exuberance" valuations in 1996 were 40% below current levels of elation. Today, the big difference with 2000 and 2007 is that government and central banks have already spend a lot of firing power to "make believe" that everything is fine again. He concludes, "there will be no place to hide when the tide turns." The markets are more overvalued now than in 2007. There will be no place to hide when the tide turns. This with margin debt so high is indicating that the best value managers will lose is a lot of money, factors which have historically worked well will suffer a lot too small caps will be crushed and could lose more than 60% from current levels, high dividend paying and shareholder yield stocks too as they are expensive relative to an expensive markets, quality stocks will outperform but not by much and given the concentration of hedge fund investors in some of them, they will be liquidated without mercy when blood will run in the street.
A gauge of upcoming home sales dropped in September to the lowest level in nine months, a sign that higher prices and rates are slowing down the housing market's rebound, according to data by the National Association of Realtors. Pending-home sales fell -5.6% in September, a fourth month of declines to hit the lowest level since December. Pending sales of homes were down across the country in September, with a monthly decline of -9.6% in the Northeast, -9% in the West, -8.3% in the Midwest and -0.4% in the South. September is the first period in more than two years that pending sales weren't higher than year-earlier levels, and home sales could be lower in the fourth quarter, said Lawrence Yun, NAR's chief economist. However, NAR expects this year's sales of existing homes to be up +10% from last year. A sale is listed as pending when the contract has been signed. Sales are typically finalized within one or two months of signing.
Friday, October 18, 2013 4:10
New highs were hit today in the market as we ended the October expiration cycle. Strangely being an expiration day volume was quite weak. The market has seen a huge rally this week as the budget and debt ceiling problems were postponed for a few more months and strangely thats good news for the market. Somehow I think not, but the Fed’s consistent pumping has postponed any type of real correction to occur. The Dow saw highs of +40.00 points, S&P 500 +13.00 points and the Nasdaq +55.00 points. At the close the Dow was up by +28.00 points to 15,400.00, S&P 500 +11.00 points to about 1745.00, S&P 100 +5.00 points to 776.00 and the Nasdaq Composite +51.00 points to about 3914.00. Oil closed up +$.10 around the $101.00 level. Now that expiration is finished, the budget/debt ceiling impasse will be forgotten for awhile, next week could be interesting for the market as it is incredibly overbought in the short term and earnings will really start coming out and so far they haven’t been that great and aren’t expected to get any better.
Wednesday, October 16, 2013 4:10
The market took off today as a deal was made so the government won’t default and a budget will be made. The Dow saw highs of +220.00 points, S&P 500 +24.00 points and the Nasdaq +50.00 points. At the close the Dow was up by +206.00 points to 15,374.00, S&P 500 +23.00 points to about 1722.00, S&P 100 +10.00 points to 767.00 and the Nasdaq Composite +45.00 points to about 3839.00. Oil closed up +$1.40 around the $102.00 level.
Senate leaders on announced a deal to reopen the government and raise the nation’s borrowing limit, with the Treasury’s deadline for lifting the debt ceiling just a day away. Speaking on the Senate floor, Majority Leader Harry Reid and Minority Leader Mitch McConnell outlined the agreement, struck after a competing House plan blew up late Tuesday night. Significantly, Sen. Ted Cruz, the tea-party-backed Texas Republican, said he wouldn’t block a vote. That paves the way for a smooth process in the Senate, though Congress must now race to meet Treasury’s deadline. The deal would finance the federal government until Jan. 15th, keeping “sequester” spending levels something McConnell said was a “top priority” for Republicans. The borrowing limit would be raised until Feb. 7th.
Confidence among home builders declined in October to the lowest level in four months, with mortgage-rate volatility and Washington's impasse over the debt ceiling hurting builders' views on sales. The National Association of Home Builders/Wells Fargo housing-market index fell to 55% in October from 57% in September. A prior September estimate pegged the level at 58, which matched the highest reading since 2005. Results above 50% signal that builders, generally, are optimistic about sales trends. Economists polled by MarketWatch had expected an October reading of 58%. Despite the recent decline, pent-up demand is supporting builder sentiment, which has increased 34% over the past year, outpacing home-construction growth. " Interest rates remain near historic lows and we don't expect the level of rates to have a major impact on sales and starts going forward," said David Crowe, NAHB's chief economist. "Once this government impasse is resolved, we expect builder and consumer optimism will bounce back."
Tuesday, October 15, 2013 4:10
The market continued higher to start the week yesterday and after a down open it turned into the green by mid-day, but when Fitch Ratings placed the United States triple ‘AAA’ credit rating on negative watch in the last hour because of all the back-and-forth negotiations among policymakers about how to raise the nation’s borrowing limit before Thursday’s deadline, the market tanked with the Dow seeing lows of -140.00 points, S&P 500 -15.00 points and the Nasdaq -30.00 points. The volatility that the market is seeing isn’t surprising but it was also starting to get a bit overbought so it wasn’t surprising to see it fall. I’m sure in the end some type of deal will be made but then the market will start looking at earnings which aren’t expected to be that great this quarter so were likely in store for more sideways action.
At the close the Dow was down by -133.00 points to 15,168.00, S&P 500 -12.00 points to about 1698.00, S&P 100 -5.00 points to 756.00 and the Nasdaq Composite -21.00 points to about 3794.00. Oil closed down -$1.00 around the $101.00 level.
In a statement, the ratings company said the ratings of all outstanding U.S. debt securities are also on negative watch. “Fitch expects to resolve the (ratings watch negative) by the end of the (first quarter of 2014) at the latest, although timing would necessarily reflect developments and events, including the duration of any agreement to raise the debt ceiling,” the ratings service said.
Fitch said the decision to put the U.S. credit rating on negative watch was driven by a number of key factors including the inability of Congress to come to an agreement on how to deal with runaway spending and mounting debt in a “timely manner” before the U.S. Treasury Department exhausts its extraordinary measures by October 17th.
“Although Fitch continues to believe that the debt ceiling will be raised soon, the political brinkmanship and reduced financing flexibility could increase the risk of a U.S. default,” Fitch said.
The ratings service noted though Treasury could use its cash reserves to make payments after Thursday, but it would be “exposed to volatile revenue and expenditure flows.” Further, it said it’s unclear whether the department could even have the legal authority to prioritize debt payments and the risk of delayed payments would damage the U.S. economic reputation and creditworthiness. Fitch said it still believes the U.S. to be “more dynamic and resilient to shocks than its high-grade rating peers,” and affirms the credit rate at a platinum ‘AAA.’ Further, it forecasts the economy will grow 1.6% this year and 2.6% in 2014. “Nevertheless, public debt stabilization at such elevated levels still render the US economy and public finances vulnerable to adverse shocks and in the absence of additional spending reform and revenue measures, deficits and debt will begin to rise again at the end of the decade,” Fitch said in a statement.
Thursday, October 10, 2013 4:10
The market rallied hard today as there was an announcement that House Republican leaders offered President Obama a “good faith” proposal to temporarily increase the nation’s debt ceiling and negotiate a budget deal, with the government remaining shut for a tenth straight day. The Dow saw highs of +330.00 points, S&P 500 +38.00 points and the Nasdaq +90.00 points. At the close the Dow was up by +323.00 points to 15,126.00, S&P 500 +36.00 points to about 1693.00, S&P 100 +14.00 points to 752.00 and the Nasdaq Composite +83.00 points to about 3761.00. Oil closed up +$1.40 around the $103.00 level. This was a reactionary rally so the real test will come tomorrow to see if there is any follow through. Even if we see it just move sideways that may be an indication that the market may need to correct more!!
Jobless Claims surged to 374,000 in the first week of October - the highest level in six months - because of ongoing application-processing snafus in California and government shutdown-related layoffs. The +66,000 increase in seasonally adjusted claims for the week marked the biggest spike since last November. Economists had expected claims to rise to 312,000 from an unrevised 308,000 in the prior week. The leap in claims largely reflects recurrent computer problems in California, a Labor spokesman said, but some states also reported higher layoffs in private-sector industries such as defense that rely heavily on federal contracts. California's switchover to a new computer system in early September has resulted in prolonged delays in working through claims applications. The latest claims report, however, does not include furloughed government employees. The four week average jumped +20,000 to 325,000 and continuing claims fell by +16,000 to a seasonally adjusted 2.91 million.
Tuesday, October 8, 2013 4:10
The market started the week lower yesterday with the Dow seeing triple digit losses and today it continued to fall with the Dow seeing lows of -170.00 points, S&P 500 -21.00 points and the Nasdaq -80.00 points because parts of the government remain closed over budget battles and the fact that the debt ceiling decision must be made by October 17th or the government will default on on all of its trillions of dollars of debt. Two days into trading this week and the market is already off -2%. At the close the Dow was down by -160.00 points to 14,777.00, S&P 500 -21.00 points to about 1655.00, S&P 100 -9.00 points to 736.00 and the Nasdaq Composite -76.00 points to about 3695.00. Oil closed up +$.35 around the $103.00 level. Although the situation looks bleak it is also all political as the Republican party is self destructing within itself so this type of problem is helping to bring them together. Interesting a poll taken by a news agency revealed that 70% of the public doesn’t want the debt ceiling raised again. The U.S already owes $16.7 trillion dollars, a record amount so what's a few more dollars!!! Somehow I’m sure this will get resolved in some fashion and the market is getting quite oversold in the short term so I wouldn’t be surprised if there was some type of a bounce coming soon.
Tuesday, October 1, 2013 4:10
The market sold off pretty good yesterday as investors faced down the possibility of a government shutdown. Congress failed to agree on a new budget over the weekend, while the threat of new elections out of Italy and a report showing that China's manufacturing sector grew at a slower pace than expected also weighed on sentiment. Another factor was that Spain decided to place a 7% tax on peoples savings account. The market fell hard at the open with the Dow seeing lows of -170.00 points, S&P 500 -17.00 points and the Nasdaq -50.00 points. It came back pretty well in the final hour which helped it to rally today even though its looking like a government shutdown is imminent. The Dow today saw highs of +85.00 points, S&P 500 +16.00 points and the Nasdaq +50.00 points, The Fed’s $3 billion worth of purchases today seemed to help that and the fact that its the first day of trading for the month!!
At the close the Dow was up by +62.00 points to 15,192.00, S&P 500 +14.00 points to about 1695.00, S&P 100 +6.00 points to 754.00 and the Nasdaq Composite +47.00 points to about 3818.00. Oil closed down -$.25 around the $102.00 level.
Today was the start of the fourth quarter and so far its been a good year with market up about +17%. The fourth quarter is historically when stocks do best and usually sees about a +3% gain in the fourth quarter and has been positive 74% of the time. October being higher or lower is generally the most volatile month of the year and averages a respectable +0.61% in the month, the standard deviation of returns is quite high at 5.94%. December, on the other hand, has an impressive return of +1.53%, and the standard deviation in December is almost half that of October. In fact, out of all 12 months, October has the highest standard deviation, and December has the lowest.
Home prices, including distressed sales, rose about +0.9% in August and were up +12.4% from a year earlier. Excluding short sales and other distressed properties, prices rose 1% in August, and were up +11.2% from the year-earlier period, also hitting the fastest annual pace since February 2006. The housing market in Nevada, where prices crashed during the housing crisis and remain far below peak levels, saw the largest year-over-year price growth in August. Including distressed properties, annual home-price growth in Nevada reached +26%. Despite that growth, prices in Nevada in August were about +42% below peak. Meanwhile, the state with the lowest annual price growth, including distressed properties, was New Mexico, where prices were up +1.5%. Including August’s increase and distressed sales, home prices were about +17% below a 2006 peak. Although mortgage rates have trended higher in recent months, they remain relatively low, and economists expect the housing market to continue to rebound this year. And mortgage rates are only one factor that would-be home buyers consider when making purchase decisions. Other key factors are career and income prospects, as well as the changing needs of a buyer’s family.
A measure of manufacturing activity nationally accelerated in September to the highest point of the year, continuing a series of mostly strong readings from the factory sector. The Institute of Supply Management said its purchasing managers index rose to 56.2% from 55.7% in August, topping the 55% expected by economists. New orders fell -2.7% points to a still-strong 60.5%, while production edged up +0.2% points to 62.6% and employment rose +2.1% points to 55.4%. Any reading above 50 indicates expansion.
Friday, September 27, 2013 4:10
The market fell once again today as worries about a government shutdown over the weekend persisted with the Dow down to lows of -120.00 points, S&P 500 -12.00 points and the Nasdaq -30.00 points. It came back a little as the day wore on but still closed with losses. At the close the Dow was down by -70.00 points to 15,258.00, S&P 500 -7.00 points to about 1692.00, S&P 100 -3.00 points to 753.00 and the Nasdaq Composite -6.00 points to about 3781.00. Oil closed down -$.01 around the $103.00 level.
Consumers opened up their wallets in August and spent more in July than previously reported, suggesting that growth might not soften quite as much in the third quarter as economists had forecast. Consumer spending rose a seasonally adjusted +0.3% last month, marking the third-fastest increase of the year and spending in July rose twice as fast as initially estimated, +0.2% instead of +0.1%. The rise in spending was aided by the biggest increase in worker earnings in six months. Personal income jumped +0.4% in August. Economists had forecast a +0.3% increase in consumer spending and a +0.4% rise in personal income. The larger increase in incomes allowed people to put away a bit more cash. The savings rate of Americans rose to +4.6% from +4.5%. The savings rate, however, hasn’t topped 5% since late last year.
Consumer spending represents as much as 70% of the economy and is the biggest influence on growth. The bounce-back in spending could generate faster growth in the third quarter than economists had been expecting. Gross domestic product is forecast to rise +1.9%, down from +2.5% in the second quarter, according to the latest estimates. Consumers pushed purchases of autos in August to the highest rate in more than six years, and the month is always big for back-to-school purchases. Americans spent more on durable goods and services, but purchases of everyday items was basically unchanged.
A gauge of consumer sentiment fell to a final September reading of 77.5%, the lowest final level since April from 82.1% in August. Economists had expected a final September level of 78% for the University of Michigan/Thomson Reuters consumer-sentiment index, compared with a preliminary reading of 76.8%.
Thursday, September 26, 2013 4:10
Not surprisingly the market rallied this morning with the Dow up +120.00 points, S&P 500 +12.00 points and the Nasdaq +40.00 points as the market was short term oversold. As the disputes about the upcoming government shutdown came back, the debt ceiling being hit and finally the time of when the Fed will start tapering returned, it caused gains to slowly erode. At the close the Dow was up by +55.00 points to 15,328.00, S&P 500 +6.00 points to about 1699.00, S&P 100 +1.00 points to 756.00 and the Nasdaq Composite +26.00 points to about 3787.00. Oil closed up +$.30 around the $103.00 level.
In reality since 1976, there have been seventeen different government shutdowns. The longest was in 1995-1996 and lasted three weeks and six shutdowns in the 1970s and all lasted more than a week while the shutdown in 1982 lasted only one day. What makes the current situation seem so interesting is that the leadership of both parties seems to have limited influence over the rank and file and this makes a deal more difficult to achieve. Various polls show that while voters may not be enthusiastic supporters of the Affordable Care Act, (Obama Care), do not want to see a closure of the government over its funding. The “crisis of the moment” as we enter the fourth quarter is the debt ceiling and budget battle. Of course, there is no risk of an actual default on Federal debt, since tax revenues easily cover debt payments and existing debt can be rolled over but that’s not to say that there won’t be a government shutdown to some extent.
Also worrying the market is that the Fed decided last week to opt out of starting to taper or slow its quantitative easing program lol, (i.e., buying of Treasuries and mortgage-backed securities), primarily for two reasons. First, rapidly rising long-term interest rates were already starting to hurt the recovering housing market thus the false psychological wealth effect and second, the fragile economy still faces extreme challenges, not the least of which as to do with the dysfunctional congress. Peter Schiff of Euro Pacific Capital thinks that QE has been like a drug in that it feels good while you’re taking it, but does real long-term damage that is only realized when you stop taking it because there’s no more free cash. He thinks the question isn’t when to begin tapering, but whether QE should exist at all. Its never Long-term, we would be much healthier without it, but the short-term pain would be too great for most people or at least the rich lol.
The main point though is that QE has had no real effect on the economy, as banks remain reluctant to lend their massive storehouses of cash. The irony is that as the yield curve steepens with rising long-term rates as QE tapers, the credit spread will widen and banks should have increasing motivation to lend but they don’t.
Sales contracts on homes fell -1.6% in August a third month of declines led by drops in three of four U.S. regions. Higher interest rates and prices, among other factors caused this. The NAR says that "Moving forward, we expect lower levels of existing-home sales, but tight inventory in many markets will continue to push up home prices in the months ahead," said Lawrence Yun, NAR's chief economist. Despite the recent drop, the pending-home sales gauge in August was up +5.8% from the year-earlier period. By region, pending home sales in August fell -3.5% in the South, -1.6% in the West and -1.4% in the Midwest. Meanwhile, pending sales rose +4% in the Northeast. A sale is listed as pending when the contract has been signed. Sales are typically finalized within one or two months of signing.
GDP was unrevised at +2.5% in the April-to-June period. GDP is the broadest measure of an economy’s health, reflecting the value of all the goods and services a nation produces. Economists expected GDP growth to be revised up to +2.7%. The report does nothing to alter the current view of the economy four years after the Great Recession ended. The U.S. has been expanding at a roughly +2% rate over the past several years and there’s little reason to expect a big growth spurt anytime soon. Growth is forecast to slow to a +1.9% pace in the third quarter. The main driver of the economy, consumer spending was unchanged in the second quarter. It rose +1.8%. Yet sales of U.S. made goods and services, which include exports, was revised up to +2.1% from +1.9%. Exports also grew somewhat slower, at +8% compared to a prior reading of +8.6%. And the increase in business inventories was reduced to $56.6 billion from $62.6 billion. Inflation as measured by the PCE index was revised down a notch to show a -0.1% decline. That’s the first drop since the last quarter of the Great Recession. Core PCE, viewed by the Fed as a more accurate inflation gauge, rose at a scant 0.6% annual rate. The increase in corporate profits last quarter, adjusted for special factors, was trimmed to +3.3% from +3.9%. Adjusted profits rose $66.8 billion after a $26.6 billion decline in the first quarter. Most other aspects of the GDP report were little changed.
Jobless claims fell again last week and hovered just above a six-year low, but it’s unclear whether the decline stems from a pickup in hiring or is the residue of processing delays earlier in the month. Claims dropped by -5,000 to a seasonally adjusted 305,000. Economists had expected claims to rise to 327,000 on the assumption that California would catch up on a backlog of claims. The average of new claims over the past month, a more reliable gauge than the volatile weekly number, fell by -7,000 to 305,000 and the lowest level since June 2007. Continuing claims in the week ended Sept. 7th increased by +35,000 to a seasonally adjusted 2.82 million. Continuing claims reflect the number of people already receiving benefits.
Wednesday, September 25, 2013 4:10
The market saw its fifth down day in a row today, something I can’t remember the last time it happened. So far the correction has only been -2% however. The market started the day a bit lower but after hitting lows it rallied with the Dow up +50.00 points, S&P 500 +6.00 points and the Nasdaq +15.00 points. Selling came back in the final hour though as traders are starting to worry about the government going broke unless the debt ceiling is increased so the Dow saw lows of -90.00 points, S&P 500 -6.00 points and the Nasdaq -15.00 points. There was little recovery going into the close with the Dow finishing down by -60.00 points to 15,273.00, S&P 500 -5.00 points to about 1693.00, S&P 100 -3.00 points to 754.00 and the Nasdaq Composite -7.00 points to about 3761.00. Oil closed down -$.75 around the $102.40 level.
The market continues to remain near highs even though there is nothing going on in the economy, its basically dead, the recovery has been a joke and all this despite the Feds stuffing the pockets of the 5% or so of asset owners with money. The other 95% of the population is broke, unemployed, and desperate. The record highs in the market are a big joke as expectations are too high. Profit growth is non-existent and with market internals rotten to the core we could see more of a correction to come.
Sales of new homes rose +7.9% to a seasonally adjusted annual rate of 421,000 in August, rebounding after a large drop in July, as three of four regions posted gains, according to government data. That +7.9% growth was the fastest sales pace since January. Economists had expected sales to climb higher in August to a rate of 420,000, compared with an original July estimate that pegged the rate at 394,000 while July's numbers were revised to 390,000. Pent-up demand and relatively low interest rates are supporting sales, though there's concern that rising mortgage rates are cutting into the housing market's recovery. Looking longer-term, new-home sales in August were up +12.6% from the year-earlier period. The median price of new homes was $254,600 last month, up +0.6% from the year-earlier period. The supply of new homes on the market fell to five months at the current sales pace from 5.2 months in July
Yesterday it was reported that Home prices increased +1.8% in July, the smallest monthly gain since March, as 15 of 20 cities tracked by a gauge from S&P/Case-Shiller saw slower growth, according to data released. "The rate of increase may have peaked," said David Blitzer, index committee chairman at S&P Dow Jones Indices, noting that rising mortgage rates may be hitting the housing market. However, on a year-over-year basis, home prices grew +12.4% in July, the fastest annual pace since 2006. Home prices in July were about +21% below a 2006 peak.
Consumer confidence index fell to 79.7% in September from a revised 81.8%. in August on renewed worries about stagnant wages and the availability of jobs. Economists had projected the index to drop to 79.5%. Consumers were less optimistic about the health of the economy over the next six months. The expectations index dropped to 84.1% from 89%, although the present situation index rose to 73.2% from 70.9%. Consumer confidence decreased in September as concerns about the short-term outlook for both jobs and earnings resurfaced, while expectations for future business conditions were little changed.
Friday, September 20, 2013 4:10
Today was a quadruple witch expiration for stock options, indexes, futures options and the September futures contract. It was basically a flat open though after digesting the gains it made yesterday after it rallied because it seemed the Fed would never end its $85 billion monthly stimulus package. Today however after the open a couple of Fed Committee members said the Fed could curb stimulus next month and another was critical of the decision not to taper in September. The Dow kept going down and hit lows basically at the close with the Dow seeing -190.00 points, S&P 500 -15.00 points and the Nasdaq -20.00 points. At the close the Dow was down by -185.00 points to 15,451.00, S&P 500 -13.00 points to about 1710.00, S&P 100 -6.00 points to 763.00 and the Nasdaq Composite -15.00 points to about 3774.00. Oil closed down -$1.70 around the $105.00 level. It will be interesting to see what happens next week as the market remains quite overbought and indecision remains about what the Fed will do.
Thursday, September 19, 2013 4:10
The market pulled back today digesting the gains it made yesterday with the Dow seeing lows of -60.00 points, S&P 500 -6.00 points and the Nasdaq -5.00 points. Unfortunately it came back but it was only the Nasdaq that made it into the green with highs of +15.00 points.
At the close the Dow was down by -40.00 points to 15,637.00, S&P 500 -3.00 points to about 1722.00, S&P 100 -1.00 points to 769.00 and the Nasdaq Composite +6.00 points to about 3789.00. Oil closed down -$2.00 around the $106.00 level.
Right now the market is up +21% for the year. A very nice gain I must say. The Dow has gone from 14,700 to 15,700, +7% in just 3 weeks. At this pace, we'll be at 19,000 by December 31st and over 20,000 in January and 32,000 at the end of next year! Wow, that is so normal, right? No,,, right now it is so extremely overbought its amazing and were hitting upper trend lines so it wouldn’t be surprising to see a pullback start in here. We are now moving into the volatile October session anyhow.
It was reported this morning that Existing-home sales rose +1.7% in August to a seasonally adjusted annual rate of 5.48 million, the highest level in more than six years, as buyers rushed to lock in mortgage rates before they increased any further. Economists had expected an August sales rate of 5.2 million, compared with an unrevised rate of 5.39 million in July. Looking forward, rates that continue to rise will eventually pull back home purchases, NAR added. Mortgage rates started increasing in early May on speculation about the Federal Reserve tapering its massive asset-purchase program. The median price of a home was $212,100 in August, up +14.7% from the year-earlier level, the largest growth since October 2005, as pricier homes saw large annual sales growth. Inventories rose +0.4% to 2.25 million homes available for sale, representing a 4.9-month supply at current sales rates. NAR added that all-cash deals remained high in August, while there were relatively few first-time buyers and distressed sales.
Jobless Claims climbed above 300,000 again and could rise a bit more in the next few weeks as a pair of states work through a backlog of claims stemming from the Labor Day holiday and updates to their computer systems. Initial claims climbed by +15,000 from a slightly revised 294,000 in the prior week. Economists had expected claims to jump to 338,000 on a seasonally adjusted basis. A Labor official said California and Nevada made changes to their computer systems at the start of September that resulted in processing delays of some claims applications. Those applications could show up in the next few weeks and possibly push new claims higher. The current level of jobless claims is the lowest since the fall of 2007. The average of new claims over the past month, a more reliable gauge than the volatile weekly number, dropped by -7,000 to 314,750. That's the lowest level since October 2007. Also, continuing claims decreased by -28,000 to a seasonally adjusted 2.79 million. Continuing claims reflect the number of people already receiving benefits. Initial claims from two weeks ago, meanwhile, were revised up slightly from an original reading of 292,000, based on more complete data collected at the state level.
The Philadelphia Fed's manufacturing index jumped to a reading of 22.3% in September from 9.3% in August. That's the highest reading since March 2011. Economists had anticipated a reading of 11%.
The leading economic index rose +0.7% in August to 96.6%. That was slightly higher than the +0.6% increase expected by economists. "The latest reading points to more pep in the pace of economic activity in the near term," said Ken Goldstein, economist at the board. The coincident index, which measures current conditions, rose +0.2% in August, while the lagging index advanced by +0.3%. In July, the increase in the index was revised down a notch to +0.5%.
Wednesday, September 18, 2013 4:10
The market started the day on the downside today as everyone awaited the Feds decision on interest rates and if they would announce if they were going to taper their buying habits or not. The Dow saw lows of -60.00 points, S&P 500 -4.00 points and the Nasdaq -10.00 points. Before the Fed’s announcement at 2:00 p.m est the market was just off of lows but then after they announced that there wouldn’t be any cut backs in their bond purchases the market popped with the Dow seeing highs of +180.00 points, S&P 500 +26.00 points and the Nasdaq +40.00 points.
The Fed cut its growth forecast for the third time this year, saying the economy is likely to expand between +2% to +2.3% in 2013 instead of its original estimate of +2.3% to +2.8%. By 2016, the central bank predicts growth will accelerate to a range of +2.5% to +3.3%, with short-term interest rates rising from zero to an average of about +2.25%. The central bank also trimmed its growth projection for 2014 and kept its estimate for 2015 largely intact, according to its "central-tendency" forecast. Inflation as measured by the PCE index is not expected to exceed +2% for at least four years. The Fed predicts an inflation rate of no higher than +1.2% in 2013, rising to a range of +1.7% to +2% by 2016. The unemployment rate, meanwhile, is forecast to fall to as low as 7.1% at the end of 2013, 6.4% in 2014, 5.9% in 2015 and 5.4% in 2016. In light of these predictions, the vast majority of Fed policymakers predict the bank will not raise the short-term fed funds interest rates until 2015. By 2016, the fed funds rate could move to a range of 1.75% to 2.25%.
At the close the Dow was up by +147.00 points to 15,677.00, S&P 500 +21.00 points to about 1726.00, S&P 100 +9.00 points to 770.00 and the Nasdaq Composite +38.00 points to about 3784.00. Oil closed up +$2.50 around the $108.00 level.
Tuesday, September 17, 2013 4:10
The market was up again today but on ever decreasing volume as everyone is interpreting what the Fed will do with its accommodation policy. The Dow saw highs of +60.00 points, S&P 500 +9.00 points and the Nasdaq +30.00 points. From there it drifted again to close a little off of highs. Tomorrow the Fed will be finished its two day meeting to decide about interest rates and maybe announce how much of their $85 billion influx of money per month they will cut. At the close the Dow was up by +35.00 points to 15,530.00, S&P 500 +7.00 points to about 1705.00, S&P 100 +3.00 points to 761.00 and the Nasdaq Composite +28.00 points to about 3746.00. Oil closed down -$1.00 around the $10550 level.
Consumer prices rose a seasonally adjusted +0.1% in August, mainly because of higher costs of housing and medical care. Energy prices fell -0.3% to mark the first decline since April, while food prices edged up +0.1%. The core CPI, which excludes volatile food and energy costs, because there not really important also advanced +0.1%. Economists forecast a +0.1% increase in both the overall index and in the core rate. Consumer prices have risen an unadjusted +1.5% over the past 12 months, down sharply from +2% in July. The core rate has risen a somewhat larger +1.8% during the same span. Real or inflation-adjusted hourly wages, meanwhile, ticked up +0.1% in August. Real wages have risen just +0.7% in the past 12 months, however.
Confidence among home builders in September remained at the highest level in almost eight years, despite rising mortgage rates, according to a report released today. The National Association of Home Builders/Wells Fargo housing-market index remained at 58% in September. Readings above 50% signal that builders, generally, are optimistic about sales trends. August's confidence level was revised to 58% from a prior estimate of 59%. Economists had expected a reading of 59% for September. The component measuring views on current sales conditions remained at 62% in September, while a gauge of prospective-buyer traffic ticked up to 47% from 46% in August, and a component measuring sales expectations fell to 65% from 68%. "Following a solid run up in builder confidence over the past year, we are seeing a pause in the momentum as consumers wait to see where interest rates settle and as the headwinds of tight credit, shrinking supplies of lots for development and increasing labor costs continue," said David Crowe, NAHB's chief economist.
Monday, September 16, 2013 4:10
Last week the market rallied to end nicely higher and today it started the week up after former Treasury Secretary Lawrence Summers withdrew consideration for the top job at the Fed. Summers called President Obama on Sunday to say he was withdrawing his name for consideration for Federal Reserve chairman, saying he has “reluctantly concluded that any possible confirmation process for me would be acrimonious.” Of course Globex futures popped over +1% higher on the news and it continued in the morning with the Dow seeing highs of +160.00 points, S&P 500 +16.00 points and the Nasdaq +40.00 points. As the day wore on and the market realized that really it made little difference at this point in the game it started to pull back and the final hour even saw the Nasdaq turn into the red.
At the close the Dow was up by +119.00 points to 15,495.00, S&P 500 +10.00 points to about 1698.00, S&P 100 +4.00 points to 758.00 and the Nasdaq Composite -5.00 points to about 3718.00. Oil closed down because Syria didn’t get attacked today down -$2.00 around the $107.00 level.
It was reported this morning that Industrial production rose +0.4% in August, the largest monthly change since February, the Fed reported. The gain matched forecasts. Manufacturing output rose +0.7%, mining output added +0.3%, while utilities output fell -1.5%. Compared to Aug. 2012, production is up +2.7%. Capacity utilization edged up to 77.8% from 77.6%.
On Friday it was reported that Retail sales rose +0.2% in August, less than expected but sales were higher in July and June than initially believed. The increase in retail sales last month, the smallest since April, was led by autos, electronics and home furnishings. Excluding then auto sector, sales rose by a seasonally adjusted +0.1%. Economists had forecast retail sales to climb by +0.5% overall or by +0.3% minus autos. Stripping out gasoline stations, retail sales rose +0.2%. The slow pace of sales growth in August, however, was offset by faster sales in the prior two months. The increase in sales for July was revised up to +0.4% from +0.2% and the gain in June was raised to +0.7% from +0.6%. Retail sales account for about one-third of consumer spending, the main propeller of economic growth. In the past 12 months, retail sales have risen a modest +4.7%, unadjusted for inflation.
Wholesale prices jumped a seasonally adjusted +0.3% in August on higher fuel and food costs, the Labor Department said Friday. Excluding the volatile categories of food and energy, core wholesale prices were unchanged. Economists had predicted a +0.2% increase in the overall producer price index and a +0.1% rise in core PPI. Energy prices climbed +0.8% and the wholesale cost of food moved up +0.6%, spurred by a spike in vegetables. Over the past year, wholesale prices have risen an unadjusted +1.4% overall and by +1.1% on a core basis.
Wednesday, September 11, 2013 4:10
First off today is 9/11 and a very sad day in our history so I wanted to say my heart goes out to those who lost love ones that day. To me it is still like yesterday as it had such a huge effect on so many financial people. A day we should never forget...
Monday and Tuesday and now Wednesday saw the Dow make triple digit gains with the overall market up about +2%. The S&P 500 has now been up 7 days in a row. The market was quite oversold and with news indicating that that there wasn’t going to be any attacks on Syria it was a good reason for the market to rally. It is getting pretty overbought now though so we’ll see how it holds up for the rest of the week. Today it opened mixed with tech stocks being heavy as traders didn’t seem to like Apples announcement about its new phones so their stock was sold strongly. The market is now getting quite overbought on poor volume and breadth so it will be interesting to see if the rally starts to lose some steam here.
At the open the Dow saw highs of +40.00 points, but the S&P 500 was only able to be down -1.00 point and the Nasdaq -20.00 points. It did turn around though with the Dow up +140.00 points, S&P 500 +6.00 points and the Nasdaq -2.00 points midday. At the close the Dow was up by +136.00 points to 15,327.00, S&P 500 +5.00 points to about 1689.00, S&P 100 +2.00 points to 754.00 and the Nasdaq Composite -5.00 points to about 3725.00. Oil closed up +$.40 around the $108.00 level.
Friday, September 6, 2013 4:10
The market strangely opened higher this morning on news that employment was really bad with the Dow up +60.00 points, S&P 500 +8.00 and the Nasdaq +20.00 points. When news came out that there may be an attack on Syria the market sank however with the Dow seeing lows of -140.00 points, S&P 500 -13.00 points and the Nasdaq -40.00 points midday. It came back once again moving into the green but the final hour saw selling take hold one again so it closed mixed. At the close the Dow was down by -15.00 points to 14,922.00, S&P 500 +.10 points to about 1655.00, S&P 100 -.30 points to 740.00 and the Nasdaq Composite +1.00 points to about 3660.00. Oil closed up strong +$2.00 around the $111.00 level. It was another week of slogging for the market which is great for trades but incredibly boring. Volume is non-existent and we're around the neutral area for technicals so the only question out there is how will the whole Syrian news affect the market but it could be a long drawn out affair that only time will tell. As we are now entering the fall trading season we could see this continue until everyone figures out what's going on with the economy and if the Fed will actually start tapering their $85 billion dollar monthly cash infusion. With the employment report this morning it doesn’t seem like it so we’ll likely continue this sideways action with some small shocks if we actually do attack Syria.
The economy added a mere +169,000 jobs in August, but more people dropped out of the labor force and the number of positions created in July was cut way back, the government reported. Economists expected an increase of +173,000 jobs last month. The unemployment rate, meanwhile, ticked down to 7.3% from 7.4%, but that was because fewer people were looking for work. The labor force participation rate fell to 63.2%, the lowest level since the summer of 1978 which is abysmal. Employment gains for July and June were lowered by a combined -74,000, with the biggest revision taking place in July. The number of new jobs created in July was slashed to 104,000 from 162,000, the smallest gain since June 2012. June's job gains were cut to 172,000 from 188,000. The private sector added +152,000 jobs in August and government increased employment by +17,000. Average hourly wages rose 5 cents to $24.05, while the average workweek edged up 0.1 hour to 34.5 hours.
Friday, August 30, 2013 4:10
The market was apprehensive today going into the long weekend as worries over Syria being attacked remain out there, earnings have been flat and the economy is growing but not rocketing forward. Yesterday it was reported that Gross domestic product rose at a +2.5% annual rate instead of the initial reading of +1.7%. Spending of consumers the key to U.S. growth, saw no improvement under the government’s latest revision and suggests the economy entered the third quarter with little added momentum. The Dow saw lows of -90.00 points, S&P 500 -11.00 points and the Nasdaq -40.00 points midday. At the close the Dow was down by -31.00 points to 14,810.00, S&P 500 -5.00 points to about 1633.00, S&P 100 -2.00 points to 731.00 and the Nasdaq Composite -30.00 points to about 3590.00. Oil closed down -$.70 around the $109.00 level. It will be interesting to see what happens over the weekend but I doubt Obama will do anything over it as so many other countries are declining on helping at all. It is the final long weekend of summer anyhow so who would want to ruin that lol. This should make for an interesting start to next week.
Tuesday, August 27, 2013 4:10
The market fell this morning on news that military action against Syria may happen as Secretary of State John Kerry said the United States would hold Syria accountable for using chemical weapons that opposition groups contend killed more than 1,300 people. This sent investors into the perceived safety of government bonds and gold. I say perceived because once again the government is set to run out of borrowing authority in mid-October and President Obama said he wouldn’t negotiate with the Republicans on the idea of spending cuts. I think the Syria and budget problems were excuses for the market to fall and although bad I think this is just decent corrective action that is needed to keep the market healthy.
The Dow saw lows of -190.00 points, S&P 500 -28.00 points and the Nasdaq -85.00 points in the final hour. At the close the Dow was down by -170.00 points to 14,776.00, S&P 500 -26.00 points to about 1630.00, S&P 100 -11.00 points to 730.00 and the Nasdaq Composite -79.00 points to about 3579.00. Oil closed up big because of the worry about the Strait of Hormuz being closed up +$3.00 around the $109.00 level even though only 17% of the worlds supply of oil is transported through there.
Home prices increased +2.2% in June, another month of fast growth but slower than May, with gains in all 20 cities tracked by the S&P/Case-Shiller gauge, according to data. In six cities prices rose faster in June than they did in May. Annual home-price growth hit +12.1% in June, remaining close to a multi-year high. "Overall, the report shows that housing prices are rising but the pace may be slowing," said David Blitzer, chairman of the index committee at S&P Dow Jones Indices.
The consumer confidence index rose slightly in August to 81.5% from 80% in July. The increase beat the forecast of economists who expected the index to fall to 78%. The future expectations index rose to 88.7% from 86% in July. The present situation index, however, fell to 70.7% from 73.6%. "Consumer confidence increased slightly in August, a result of improving short-term expectations," said Lynn Franco, director of economic indicators at the Conference Board. "Consumers were moderately more upbeat about business, job and earning prospects."
Thursday, August 15, 2013 4:10
So far this expiration traded week has been on the downside but today saw selling take hold as economic data pointed to the tapering of the Fed’s $85 billion buying program coming to an end with the Dow down -250.00 points, S&P 500 -27.00 points and the Nasdaq -70.00 points first thing this morning! At the close the Dow was down by -225.00 points to 15,112.00, S&P 500 -24.00 points to about 1661.00, S&P 100 -10.00 points to 744.00 and the Nasdaq Composite -63.00 points to about 3606.00. Oil closed up +$.44 around the $107.00 level.
The market is off almost -2% this week alone and is great news as it has been in desperate need of a correction and hopefully this one will go a bit deeper to move the market into a deeply oversold position. It has seen volume fall off the board the past two weeks though as money managers are putting in their final vacations before September hits! This means the next couple of weeks could be interesting!
Signaling a slower pace of layoffs, Jobless Claims fell -15,000 to 320,000, hitting the lowest level of claims since October 2007. Economists had expected a claims level of 333,000, matching an original estimate for the prior week. On Thursday, the government slightly revised the initial claims level to 335,000 for the week that ended August 3rd. The average of new claims over the past month, a more reliable gauge than the volatile weekly number, fell -4,000 to 332,000, also reaching the lowest level since the weeks leading up to the start of the Great Recession. Continuing claims dropped -54,000 to a seasonally adjusted 2.97 million. Continuing claims reflect the number of people already receiving benefits. The four-week average of continuing claims fell -38,500 to 2.99 million.
Industrial production was flat in July, and June's growth was revised lower, according to data. Economists had expected +0.2% growth for July, and June's growth was cut by a tenth of a percentage point to +0.2%. The 1.4% year-on-year growth rate was the slowest in more than three years. In July, manufacturing production declined -0.1%, as motor vehicle and parts output dropped -1.7%. Capacity utilization fell to 77.6% from 77.8%.
Consumer prices rose a seasonally adjusted +0.2% on gains for gasoline, housing, clothing and food, among other goods. Excluding energy and food, the core consumer-price index also rose +0.2%. Results for the overall CPI and core reading matched the forecasts from economists. In June, the overall CPI rose +0.5%, while the core CPI rose +0.2%. In July prices for gasoline rose +1%, down from June's gain of +6.3%. Food prices in July rose +0.1%, compared with a gain of +0.2% in June. Consumer prices have increased +2% over the past 12 months, and the core has increased +1.7%. Observers expect that the Fed could announce plans to taper its massive bond-buying program as early as September, though there's been some concern about inflation running too low.
Manufacturing in the New York region increased at a slightly slower pace in August than in the prior month, the Feds Bank of New York said. The regional bank's "Empire State" general business conditions index slipped to 8.2% in August from 9.5% in July. A survey of economists called for a reading of 9.5% in August. Readings greater than zero signal expansion. The key new orders sub-index fell to 0.3% in August from 3.8% and shipment slipped to 1.5% from 9% in July. On the other hand, labor market conditions improved in the month to their best levels in a year. The index for number of employees climbed to 10.8% in August from 3.3% July. The average workweek rose to 4.8 from negative 7.6 in the prior month.
Yesterday it was reported that Wholesale prices were unchanged in July, as prices declined for energy, didn't change for food, and rose for goods such as pharmaceuticals. Meanwhile, the core producer-price index, which excludes food and energy, increased +0.1%. Economists had expected the overall PPI to rise +0.3% in July, and for the core to increase +0.2%. In June, the overall PPI rose +0.8%, while the core PPI rose +0.2%. Wholesale energy prices declined -0.2% in July, led down by residential natural gas. Meanwhile, wholesale pharmaceutical prices rose +1%. Over the past 12 months wholesale prices have increased an unadjusted +2.1%, while core producer prices have gained +1.2%. The report signals that inflation was contained in July.
Friday, August 9, 2013 4:10
So far this week the market was down the first three days of the week then rallied a little yesterday but once again closed lower today to finish the week down about -1%. Today the Dow started up +10.00 points, S&P 500 +2.00 points and the Nasdaq +10.00 points but not an hour into trading it saw lows with the Dow down -110.00 points, S&P 500 -8.00 points and the Nasdaq -15.00 points! At the close the Dow was down by -73.00 points to 15,426.00, S&P 500 -6.00 points to about 1691.00, S&P 100 -4.00 points to 756.00 and the Nasdaq Composite -9.00 points to about 3660.00. Oil closed up +$2.70 around the $106.00 level.
The market is continuing this sideways chop as traders are digesting the likelihood of the Fed cutting back on its $85 billion per month stimulus plan now as we approach September. It is also now at a 4 year high for valuation as earnings turned out below average this quarter and the coming quarters estimates continue to be lowered! This plus the fact that the market market remains overbought in the intermediate term continues to say that volatility could kick up again. One thing that seems to be saving the market is the fact that volume is at an incredible low as many money mangers are on holidays. The closer we get to the start of the school year though means were likely to see it kick up again.
Thursday, August 1, 2013 4:10
The market has been mostly flat going into yesterdays Fed decision on interest rates this week and after they reported no change and that they would continue to print $85 billion per month the market rallied to highs on the Dow of +120.00 points, S&P 500 +12.00 points and the Nasdaq +30.00 points but then fell in the final hour to actually close mixed with only the Nasdaq market making slight gains as there was reason to think that the stimulus may end soon. That seemed to set up today's trading for a negative open but it was the first trading day of a new month and the EU also decided to keep rates and stimulus as it is so the market gapped open on “okay” economic data with the Dow up +160.00 points, S&P 500 +22.00 points and the Nasdaq +55.00 points! After hitting these highs though the market basically went sideways on zero volume for the rest of the day. It’s interesting that the market would move up this much before the all important employment report coming out tomorrow so it could be a buy before the news type of event.
July saw a +5% gain for the market so we still have another +25% to go for the year, however that is unlikely!! The market is ahead of itself technically and getting quite overvalued fundamentally as earnings have been poor this quarter and outlooks are getting worrisome. The market is also already up +20% for the year only seven months in and pushing for a +35% gain for the year. This is possible but I still believe that the volatility that started in July will kick up again as the market has had a big move in July that needs to be digested and yesterdays action alone was proof of that. It will be interesting to see how we end the week!!
At the close the Dow was up by +128.00 points to 15,628.00, S&P 500 +21.00 points to about 1707.00, S&P 100 +9.00 points to 764.00 and the Nasdaq Composite +49.00 points to about 3675.00. Oil closed up +$2.90 around the $109.00 level.
It was reported this morning that Jobless Claims fell by -19,000 to a seasonally adjusted 326,000, marking the lowest level since January 2008. Economists expected claims to total 345,000 on a seasonally adjusted basis. The claims data, however, often jumps up and down in July because of big seasonal changes in employment in the auto industry and education sector. The average of new claims over the past month, a more reliable gauge than the volatile weekly number, fell by a smaller -4,500 to 341,250 and is the lowest level in 10 weeks and just shy of a five-year low. Also, the government said continuing claims fell by -52,000 to a seasonally adjusted 2.95 million in the week ended July 20th. Continuing claims reflect the number of people already receiving benefits.
The best number of the day was the Institute for Supply Management saying its July manufacturing index surged to a reading of 55.4% vs. 50.9% in June and is the highest level since August 2011. Economists had expected a reading of 52%. The new-orders component rose 6.4 points to 58.3%, the production index jumped 11.6 points to a nine-year high of 65%, and the employment index leaped 5.7 points to 54.4%. Any reading over 50% indicates expansion. This in itself should indicate that the Fed is going to start cutting back on its stimulus package.
Yesterday it was reported that the economy grew at a whopping +1.7% in the second quarter, aided by solid consumer spending and a ramp-up in business investment. The increase in gross domestic product was faster than expected but although good that is a pathetic growth rate for a supposed expanding economy. At the least though its good to see people continue to spend at a steady clip and the private sector is also pitching in.
Economists had forecast a +1% gain in growth. The GDP number is the broadest measure of economic health, reflecting the value of all the goods and services a nation produces. The growth rate in the first quarter, however, was revised down to +1.1% from a prior estimate of +1.8% as part of the government’s periodic overhaul of how it measures the size of the economy and how fast it’s expanding so that's not a good sign!!
Yesterday it was reported that Private-sector employers added a stronger-than-expected +200,000 jobs in July, beating economists expectations as businesses of all sizes gained jobs in the month. Analysts were expecting an increase of +185,000 private jobs in July, compared to an original June estimate of +188,000 jobs gained.
Wednesday, July 24, 2013 4:10
So far this week the market has been mostly flat, on the upside Monday then down yesterday. Today saw more of a pullback with the Dow off -70.00 points, S&P 500 11.00 points and the Nasdaq -10.00 points as chip stocks have already been taking hits the past week. One thing thats interesting,,, outside of the poor technicals in the market as breadth and volume have fallen hugely even though we’re near new highs is that institutional investors have never sold as much stock as they have in the last 4 weeks - as retail has been piling in. On a four-week average basis, net sales by the Institutional clients group are the largest since 2008. Private clients have been net buyers of stocks on a four-week average basis since early June. Private clients net buying streak is currently their longest since late 2011. Even though we have made slight new highs I still think the market is getting back to normal trading conditions so the correction we saw today could continue for a few more days.
At the close the Dow was down by -25.00 points to 15,542.00, S&P 500 -6.00 points to about 1686.00, S&P 100 -2.00 points to 757.00 and the Nasdaq Composite +.30 points to about 3580.00. Oil closed down -$2.00 around the $105.00 level.
Friday, July 19, 2013 4:10
Expiration was on today as market participants weren't gonna let it go down even though microsoft and Google had poor earnings last night, earnings expectations overall have also been falling. Detroit declared bankruptcy this morning and sentiment is getting extremely bullish for the market plus it is very overbought in the intermediate term. Interestingly, money is pouring into stocks at a near record pace and individual investors and foreigners are buying stocks with increasingly worsening fundamentals at ever increasing valuations. This at a time that corporate CEO's are the most bearish since the bottom of the financial crisis! No wonder considering there was also a report out yesterday that the economy may be slipping into negative territory again. This is great for Fed pumping but take the earnings away and the market is overvalued. So even though we made new highs in the market today which I think was expiration related, this indicates to me that volatility is going to kick up once again with a sideways type action.
The market started lower with the Dow off -60.00 points, S&P 500 -6.00 points and the Nasdaq -35.00 points right at the open but the final hour saw the Dow see lows of -5.00 points, S&P 500 +3.00 points and the Nasdaq -20.00 points. At the close the Dow was down by -5.00 points to 15,543.00, S&P 500 +3.00 points to about 1692.00, S&P 100 +.30 points to 757.00 and the Nasdaq Composite -24.00 points to about 3587.00. Oil closed up +$.30 around the $108.40 level.
Thursday, July 18, 2013 4:10
The market was up once again today after Fed Chief’s Ben Bernanke’s comments for the second day in a row were once again mixed with the Dow seeing highs of +120.00 points, S&P 500 +12.00 points and the Nasdaq +15.00 points. The final hour some selling take hold likely because expiration starts tomorrow and at the bell microsoft and Google both had poor earnings reports.
At the close the Dow was up by +78.00 points to 15,548.00, S&P 500 +8.50 points to about 1689.00, S&P 100 +3.00 points to 757.00 and the Nasdaq Composite +2.00 points to about 3611.00. Oil closed up +$1.50 around the $108.00 level.
Yesterday it was reported that the Fed's proposed timetable for tapering its bond-buying program is not set in stone, said Fed Chairman Ben Bernanke "I emphasize that, because our asset purchases depend on economic and financial developments, they are by no means on a preset course," Bernanke said in remarks prepared for delivery to the House Financial Services Committee. Bernanke repeated his guidance from mid-June that the Fed anticipates it will be appropriate to begin to moderate the pace of purchases "later this year," and end them "around midyear." The Fed chairman said the central bank would react to developments. If economic conditions were to improve faster that expected, the pace of asset purchases could be reduced "somewhat more quickly." But if the outlook were to become relatively less favorable, or if financial conditions were seen as too tight, "the current pace of purchases could be maintained for longer," Bernanke said. He said the economy remained vulnerable to shocks and there was a risk that a dispute in Congress over the debt ceiling could hamper the recovery.
Monday, July 15, 2013 4:10
This morning the market saw selling so there was no follow through from yesterdays big move. Volume has been contracting and even the internals of the market are looking poor! The Dow saw highs of +50.00 points, S&P 500 +5.00 points and the Nasdaq +10.00 points midday. At the close the Dow was up by +20.00 points to 15,484.00, S&P 500 +8.00 points to about 1683.00, S&P 100 +1.00 points to 753.00 and the Nasdaq Composite +8.00 points to about 3607.00. Oil closed up +$.50 around the $106.00 level.
This week is going to be very telling as it is an expiration related trading week but just as a couple of months ago going into this week the market was incredibly overbought. I think if we see a pullback at least away from this overbought condition we are in normal trading conditions otherwise it means were still in the influences of the Fed pumping cash into the market. Bernanke is speaking on Wednesday before Congress and that will be telling as he’s expected to downplay his comments from his last speech to bring things in line so it could be an interesting week!!
Retail sales rose +0.4% in June largely because of strong demand for autos and higher gasoline prices, but sales were soft in several key segments such as home improvement and department stores. Retail sales rose a seasonally adjusted +0.4% last month. Economists had forecast retail sales to climb by +0.9% overall. Sales got a big lift from the auto industry, with purchases up +1.8%. That's the biggest gain since last November. Excluding autos, however, sales were unchanged. Economists had expected a +0.6% increase minus that sector. Gas sales were also +0.7% higher. Excluding gasoline stations, retail sales were up +0.3%. Sales rose for home-furnishings, pharmaceuticals, personal care, clothes and hobby items. Sales fell a steep +2.2% at home-improvement stores, by +1.2% at bars and restaurants and by +1% at department stores. Over the past 12 months, retail sales have risen +5.7%. In May, sales were revised down to show a +0.5% increase instead of +0.6%. Sales in April were raised to +0.2% from +0.1%, however.
The Empire State manufacturing survey rose in July for the second month and has now been in positive territory for five of the last six months, the New York Fed said Monday. The general business conditions index rose to +9.5% from +7.8% in June, and components measuring new orders and shipments turned positive. Economists polled by MarketWatch expected a +5.9% reading. The index measuring expectations for six months ahead rose to 32 from 25 in June. The Empire State index is the first of the regional manufacturing reports to be released. In a special question on the impact of the Affordable Care Act,+9.8% of respondents said they would make health care more comprehensive, while +10.9% said they were cutting back or dropping health insurance.
Friday, July 12, 2013 4:10
This morning the market saw selling so there was no follow through from yesterdays big move. Volume has been contracting and even the internals of the market are looking poor! The Dow saw lows of +50.00 points, S&P 500 -5.00 points and the Nasdaq -5.00 points. As volume was incredibly light going into the weekend it did come back in the final hour with the Dow seeing highs of +5.00 points, S&P 500 +5.00 points and the Nasdaq +25.00 points.
At the close the Dow was up by +3.00 points to 15,463.00, S&P 500 +5.00 points to about 1680.00, S&P 100 +1.00 points to 752.00 and the Nasdaq Composite +22.00 points to about 3601.00. Oil has been rallying of late closing up +$1.30 around the $106.00 level. People are starting to feel it at the pumps as gas prices have started to rise and they say by Monday they could be up +$.20 per gallon by Monday!!
Thursday, July 11, 2013 3:00 p.m
The market took off first thing this morning with the Dow seeing highs going into the final hour of +170.00 points, S&P 500 +22.00 points and the Nasdaq +60.00 points after Fed Chief Ben Bernanke did an about face on what he said last week about cutting back on his free money policy. Last night Fed Chair Ben Bernanke emphasized that the central bank won’t be in a hurry to raise rates. He indicated that the Fed will keep the money printing presses ramped up for a while to come, saying "that highly accommodative monetary policy for the foreseeable future is what's needed for the U.S. economy." The chairman's comments came after minutes from the last Fed meeting showed policy makers divided between those who believe that tapering is warranted soon and those who want to see further improvement in the labor market first. The Fed has set an unemployment rate threshold of 6.5% for the first rate hike from the current near-zero levels that have been in place since December 2008. The jobless rate was 7.6% in June. Bernanke said the central bank will be in no rush to hike rates once the threshold is reached. “There will not be an automatic increase in interest rate when unemployment hits 6.5%,” Bernanke said in the question-and-answer session of a speech to economists. One thing that traders seemed to miss however is that the Fed has have gone to great pains to stress that this tool is separate from the bond-buying program and Bernanke even mentioned last night that they will still likely cut back in the fall. This makes me wonder if the rally today will hold once all of the information is digested.
Jobless Claims rose by +16,000 to a seasonally adjusted 360,000, marking the highest level in two months. Economists had expected claims to only rise 349,000 from a slightly revised 344,000 in the prior week. The claims report often seesaws in July because of shutdowns at auto plants for retooling and temporary layoffs related to the end of the regular school year. The July 4th holiday can also skew the data. The less volatile four-week average of claims rose a smaller +6,000 to 351,750. Layoffs have slowed to a post-recession low and the nation has added an average of about +200,000 jobs a month through the first six months of 2013. Also, the government said continuing claims rose by +24,000 to a seasonally adjusted 2.98 million in the week ended June 29th. Continuing claims are reported with a one-week lag and reflect the number of people already receiving benefits. Initial claims from two weeks ago, meanwhile, were revised up to 334,000 from an original reading of 343,000, based on more complete data collected at the state level.
Monday, July 8, 2013 4:10
Interesting: I guess if your in this situation it will make you feel better but in reality it is a scary situation. Only 47% of all Americans have full time jobs and 76% of all people live paycheck to paycheck, wow!!
The market blasted out of the gates today with the Dow seeing highs of +130.00 points, S&P 500 +13.00 points and the Nasdaq +20.00 points but after the initial buying it became mixed with the Dow and Nasdaq down slightly and the S&P 500 barely above water. It did come back in the final hour though at the close with the Dow up by +88.00 points to 15,225.00, S&P 500 +9.00 points to about 1641.00, S&P 100 +4.00 points to 737.00 and the Nasdaq Composite +6.00 points to about 3485.00. Oil closed down a little -$.40 around the $103.00 level. The market has climbed back pretty good from its recent lows a couple weeks back and is now getting overbought. As it approaches upper resistance levels it will be interesting in how it reacts to them to say the least!!
Monday, July 1, 2013 4:10
The market popped higher this morning on this shortened holiday week as there weren’t many traders around. The sun is out and Canadian markets are closed for Canada day. The Dow saw highs of +170.00 points, S&P 500 +20.00 points and the Nasdaq +55.00 points early on but as the day went on it drifted lower. Generally this is a higher week overall most likely because of the weaker volume every year but because we just started the correction were in it could end up being volatile like today was. At the close the Dow was only up by +65.00 points to 14,975.00, S&P 500 +9.00 points to about 1615.00, S&P 100 +3.00 points to 724.00 and the Nasdaq Composite +31.00 points to about 3434.00. Oil closed up +$1.40 around the $98.00 level.
Friday, June 28, 2013 4:10
The market didn’t like some Fed comments this morning with the Dow seeing lows of -150.00 points, S&P 500 -13.00 points and the Nasdaq -20.00 points early on but as traders left for the weekend it came back becoming mixed with the Dow off a little and the S&P 500 up +4.00 points and the Nasdaq +25.00 points going into the final hour. The Dow was under a lot of pressure as IBM was being sold off strongly on news that Accentures earnings results would affect them. Were now finished the first half of the year up about +13% and the best start of the year since 1999. At the close the Dow was down by -119.00 points to 14,906.00, S&P 500 -7.00 points to about 1606.00, S&P 100 -2.00 points to 723.00 and the Nasdaq Composite +2.00 points to about 3403.00. Oil closed down -.66 around the $97.00 level.
Fed Governor Jeremy Stein suggested that the central bank's first tapering move could come in September. In a speech to the Council on Foreign Relations, Stein used only September as the hypothetical start date for slowing the pace of purchases. He told markets not to focus on fresh payroll numbers that come out just before the meeting, saying any decision by the Fed to slow the pace of its asset-purchase program will be based on developments since the program started last fall in order to make the best judgment about the state of the economy and to reduce market volatility. "The best approach is for the [Fed] to be clear that in making a decision in, say, September, it will give primary weight to the large stock of news that has accumulated since the inception of the program and will not be unduly influenced by whatever data releases arrive in the few weeks before the meeting--as salient as these releases may appear to be to market participants," Stein said. "Even if a data release from early September does not exert a strong influence on the decision to make an adjustment at the September meeting, that release will remain relevant for future decisions," Stein said. "If the news is bad, and it is confirmed by further bad news in October and November, this would suggest that the 7% unemployment goal is likely to be further away, and the remainder of the program would be extended accordingly," he said.
Growth in Chicago-area manufacturing decelerated in June, as the Chicago business barometer fell to a 51.6% reading from 58.7% in May. This is the largest monthly drop in over four years, though economists had noted that May's reading was unusually strong. Economists had expected a 55% reading.
The final June reading of the University of Michigan and Thomson Reuters consumer-sentiment index declined to 84.1% from a final May reading of 84.5%. A preliminary June reading pegged the level at 82.7%. Economists had expected a final June reading of 83%. May's reading was the highest since July 2007.
Yesterday it was reported that Consumer spending rose +0.3% in May and personal incomes rose even faster. The increase in spending last month mostly reverses a -0.3% decline in April, which had been the biggest drop in four years. Personal income climbed +0.5% as wages, investment income and payments for entitlements like Social Security all rose at seasonally adjusted annual rates. Economists had forecast a +0.3% advance in spending and a +0.2% gain in personal income. Since incomes rose faster than spending, the individual savings rate moved up to +3.2% from +3% to mark the highest level since December. Inflation as gauged by the core PCE price index increased +0.1% and it's up a scant +1.1% over the past 12 months. The overall PCE index also rose +0.1%.
Jobless Claims fell by -9,000 to 346,000 pointing to a slightly slower pace of layoffs, according to data released by the U.S. Department of Labor. Economists had expected these initial jobless claims to decrease to a seasonally adjusted 345,000 from an original estimate of 354,000 for the week that ended June 15th. The average of new claims over the four weeks declined by -2,750 to 345,750. Continuing claims, which are reported with a one-week lag and reflect the number of people already receiving benefits, ticked down -1,000 to 2.97 million in the week that ended June 15th, reaching the lowest level in more than a month. The four-week average of these continuing claims fell -9,250 to 2.97 million.
Wednesday, June 26, 2013 4:10
Well the Dow was able to continue making triple digit gains once again with it seeing highs of +180.00 points, S&P 500 +18.00 points and the Nasdaq +35.00 points going into the final hour. Traders seemed to be happy to see the economy expanding at a much lower pace than expected with GDP coming in at +1.8% instead of the expected +2.4%. At the close the Dow was up by +149.00 points to 14,910.00, S&P 500 +15.00 points to about 1603.00, S&P 100 +7.00 points to 721.00 and the Nasdaq Composite +28.00 points to about 3376.00. Oil closed up +.14 around the $95.00 level.
The economy grew a lot slower in the first quarter than previously believed, mainly because of less consumer spending on services and weaker business investment. Gross domestic product rose by +1.8% in the January-to-March period, down from a prior estimate of +2.4%. Economists had expected growth to remain unchanged at +2.4%. The increase in consumer spending the main engine of the economy was lowered to +2.6% from +3.4%. People did not spend as much on services such as health care and legal advice, the government said. Outlays for services were reduced to a +1.7% increase from +3.1%. Investment in business structures such as office buildings and plants also fell a steeper -8.3% instead of -3.5% as previously reported. Meanwhile, exports were revised to show a -1.1% decline and not a +0.8% gain, while imports actually fell -0.4% instead of rising +1.9%. The biggest bright spot: residential investment jumped +14% in the first quarter, up from a prior read of +12.1%. That's further evidence of a housing market gaining momentum. Most other figures in the GDP report were little changed.
Tuesday, June 25, 2013 4:10 p.m est.
Volatility is back! Today was the thirteenth day out of the past 17 that have seen triple digit moves in the Dow. Yesterday was hard as the market sold off strong as the worries about the Fed cutting their spending habits sunk in with the market closing down over -1%. European and Asians markets led the way with selling even worse overnight as they to are seeing stimulus being cut. Of course you can only go down so long even in dire situations as the market proved today. Economic data was positive this morning which indicates little reason for the Fed to print and the market almost looked like it was going to sell off but instead the Dow saw highs of +160.00 points, S&P 500 +21.00 points and the Nasdaq +40.00 points. At the close the Dow was up by +101.00 points to 14,760.00, S&P 500 +15.00 points to about 1588.00, S&P 100 +7.00 points to 715.00 and the Nasdaq Composite +27.00 points to about 3347.00. Oil closed up +.05 around the $95.00 level.
The Conference Board said Consumer Confidence in June rose to a more than five-year high. The index rose to 81.4% from 74.3% in May, marking the best level since January 2008. Economists had expected a 74% reading. This was the first report since the Conference Board stopped giving the information to reporters on embargo, on fear that data could have leaked out to high-speed traders. The University of Michigan and Thomson Reuters consumer sentiment report does go out to high-speed traders early.
Sales of New homes rose in May to the highest rate since mid-2008 and purchases for the prior three months were all revised higher, reflecting the continued resurgence in the housing market. Sales last month were up +2.1% to an annual rate of 476,000 from 466,000 in April. Sales for April, March and February were also revised higher. Economists had forecast sales in May to achieve an annual rate of 464,000. Demand was strongest in the Midwest (+40.7%) and Northeast (+20.7%). Sales fell 9% in the South. The median price of new homes, meanwhile, dropped -3.2% to $263,900 last month from a record high of $272,600 in April. The supply of new homes on the market edged up to 4.1 months at the current sales pace from 4 months in April. New home sales are +29% higher compared to one year ago.
Another reading the home front found that prices for Homes leaped in April, posting record monthly growth and the fastest year-over-year growth in seven years, according to S&P/Case-Shiller data. With gains in 19 of 20 cities, the 20-city composite index rose +2.5% in April, the largest monthly growth on record. The data go back to 2000. After seasonal adjustments, prices rose +1.7% in April. Compared with the same period in the prior year, prices in April rose +12.1%, the fastest annual pace since 2006. San Francisco posted the largest year-over-year price growth at +23.9%, while New York had the lowest at +3.2%. Economists had expected that home prices rose in April, supported by low inventory and demand spurred by low interest rates. Despite recent gains, the 20-city composite index indicated that prices remain about one-quarter below a 2006 peak.
Business orders for big-ticket goods rose sharply in May for the second straight month, with the gains largely concentrated in commercial aircraft and military products. Orders for durable goods rose +3.6% to a seasonally adjusted $231 billion, matching the increase in April. Economists had forecast a +3.8% gain. More important, business investment excluding defense and aircraft advanced +1.1% and recorded the third straight gain. That might be a sign of accelerating demand in a manufacturing sector that’s been shackled by cautious business spending at home and weak economies in key export markets.
Excluding transportation, orders rose a much smaller +0.7%, but almost every other key manufacturing sector posted an increase. Leading the way: computers and electronics. Orders increased +2.7% following a strong +4.7% gain in April. The durables report can be extremely volatile and subject to large revisions, so economists look at longer trends. In the first five months of 2013, business orders have risen +2.1% in compared to the same period last year. Meanwhile, shipments of core capital goods, a category used to calculate quarterly economic growth, climbed +1.7% in May to reverse most of April’s -2.0% decline. Still, the second-quarter U.S. growth is shaping up to slide below 2% from a 2.4% rate in the first three months of the year.
Thursday, June 20, 2013 4:10 p.m est.
Well now its the eighth day in a row the Dow saw a triple digit move except today's move was really ugly as we go into this quadruple witch expiration starting tomorrow morning. The Dow saw lows of -380.00 points, S&P 500 -44.00 points and the Nasdaq -95.00 points. At the close the Dow was down by -354.00 points to 14,758.00, S&P 500 -41.00 points to about 1588.00, S&P 100 -18.00 points to 716.00 and the Nasdaq Composite -79.00 points to about 3365.00. Oil closed down -2.65 around the $95.00 level. One thing for sure volatility is here for the summer which is nice as traders argue over if the Fed is going to cut their spending habits or not!!
Jobless Claims jumped by +18,000 to 354,000, putting initial claims back near the recent average and indicating little change in a modestly improving labor market. Economists had expected claims to increase to a seasonally adjusted 340,000. The average of new claims over the past month, a more reliable gauge than the volatile weekly number, rose by +2,500 to 348,250. Also, the government said continuing claims fell by -40,000 to a seasonally adjusted 2.95 million in the week ended June 8th. Continuing claims are reported with a one-week lag and reflect the number of people already receiving benefits. Initial claims from two weeks ago, meanwhile, were revised up to 336,000 from an original reading of 334,000, based on more complete data collected at the state level.
Existing-home sales rose +4.2% in May to a seasonally adjusted annual rate of 5.18 million, the highest rate since November 2009, when a buyer tax credit deadline approached pointing to a continuing recovery, the National Association of Realtors reported. Sales of existing homes in May were +12.9% higher than during the same period in the prior year. Meanwhile, the median existing-home price hit $208,000 in May, the highest since 2008, with low inventory supporting prices. The median price is up +15.4% from the same period in the prior year, the largest growth since 2005. Economists had expected the pace of existing-home sales to hit a rate of 5 million in May, compared with an April rate of 4.97 million. Inventories rose +3.3% in May to 2.22 million existing homes for sale. The supply declined to 5.1 months in May from 5.2 months in April. The share of the sales accounted for by distressed properties and first-time buyers remained low in May.
Manufacturing activity in the Philadelphia region jumped in June to its highest level since April 2011, the Philadelphia Fed said. The bank's business condition index rose to 12.5% in June from negative -5.2% in May. The size of the improvement was unexpected. The consensus of economists was for the index to only inch higher to negative -1%. Any number above zero indicates more companies are expanding their business instead of shrinking it. The headline business condition index is a separate question and not a buildup of components. So economists pay close attention to the details of the report, which were strong in the month. The index for new orders rose to 16.6% in June from negative -7.9% in May.
The leading economic index rose +0.1% in May to 95.2%, mostly because of attractive interest rates and rising stock prices. That was slightly less than the +0.2% gain expected by economists. Three of the 10 indicators improved: stock prices, the interest rate spread and credit availability. Three other indicators declined and four were unchanged. "Widespread gains in the leading indicators over the last six months suggest there is some upside potential for economic activity in the second half of the year," said board economist Ataman Ozyildirim. The coincident index, which measures current conditions, rose +0.2% in May, while the lagging index advanced +0.3%.
Wednesday, June 19, 2013 4:10 p.m est.
For the seventh day in a row the Dow saw a triple digit move with the market selling off today after the Fed announced what it would do after their two day meeting ended. So far its been a mostly sideways move. The Dow saw lows of -210.00 points, S&P 500 -23.00 points and the Nasdaq -40.00 points. At the close the Dow was down by -206.00 points to 15,112.00, S&P 500 -23.00 points to about 1629.00, S&P 100 -10.00 points to 733.00 and the Nasdaq Composite -39.00 points to about 3444.00. Oil closed down -.59 around the $98.00 level.
Volatility has returned to the market which is nice!! This is making it nice as we finish off this last trading week of this expiration cycle and will likely continue for the rest of the summer!! Fed Chairman Ben Bernanke said that the central bank may start to scale back its asset purchases later this year if the economy continues to strengthen, as the central bank expects. The Fed, which kept monetary policy on hold after a two-day meeting, signaled greater optimism about the economy, forecasting that the unemployment rate could fall to 6.5% by 2014, one year sooner than the central bank had previously estimated. The central bank’s $85-billion-a-month bond-buying program has helped prop up stock prices and kept interest rates ultra-low. Bernanke, speaking in a news conference after the Fed meeting, tried to decouple a tapering of its asset purchases from any hike in short-term interest rates. “The current level of the federal funds rate target is likely to remain appropriate for a considerable period after asset purchases are concluded,” Bernanke said. The Fed has said it would keep rates close to zero so long as the jobless rate, now at 7.6%, was above its 6.5% threshold. And the Fed chairman stressed the bank won't start to hike rates even once its economic targets are met. He said the bank has to be convinced the economic recovery is on a solid upward path before it starts to pull back. “Our policy is in no way predetermined,” Bernanke said. “Our policies are tied to what’s going on in the economy.” Indeed, 14 of the 15 Fed members don’t expect the first rate hike until 2015, according to the bank statement. “The Fed is in no hurry to remove monetary accommodation, but as the downside risk to the U.S. economy and labor market diminish, the rationale for maintaining emergency quantitative-easing measures becomes harder to justify,” said Scott Anderson, chief economist of Bank of the West. Dean Maki, chief U.S. economist at Barclays, said he now thinks the Fed will reduce the pace of asset purchases to $70 billion-per-month at its meeting in mid-September. The purchases would end by march, he added.
Friday, June 14, 2013 4:10 p.m est.
Wednesday the market fell pretty hard by the end of the day as interest rates continued to back up and worries of Fed printing continued and ended the day almost a full percent down. Thursday it looked like the market was going to continue to sell off as Japan was down another -6% overnight but before the open Globex futures started to climb slowly. Lows were hit early on with the Dow seeing -50.00 points, S&P 500 -5.00 points and the Nasdaq -15.00 points. It came back though and rallied pretty hard making new highs in the final hour with the Dow up +210.00 points, S&P 500 +27.00 points and the Nasdaq +50.00 points!! At the close the Dow was up by +180.00 points to 15,176.00, S&P 500 +24.00 points to about 1636.00, S&P 100 +10.00 points to 738.00 and the Nasdaq Composite +45.00 points to about 3445.00. Oil closed up +.66 around the $96.00 level.
Today, the market was down all day on worries once again about what the Fed may say and do when they meet next week. At the close the Dow was down by -105.00 points to 15,070.00, S&P 500 -22.00 points to about 1626.00, S&P 100 -5.00 points to 732.00 and the Nasdaq Composite -21.00 points to about 3423.00. Oil closed up +1.00 around the $98.00 level. As you can see volatility has definitely returned to the market and that is a good thing for trading.
Yesterday it was reported that Retail sales rose in May at the fastest rate in three months, led by higher demand for autos, building materials and groceries. Retail sales rose a seasonally adjusted +0.6% last month, or by +0.3% excluding the auto sector. Economists had forecast retail sales to climb by +0.5% overall and be unchanged minus autos. Excluding gas stations, retail sales were up +0.6%. The details of the retail report were somewhat mixed, however. Sales rose for auto dealers, suppliers of building materials, grocery stores, and Internet retailers. Sales fell for electronics, appliances, clothes, home furnishings and bars and restaurants. Retail sales account for about one-third of consumer spending, the main propeller of economic growth. In the past year, retail sales have risen a solid but unspectacular +4.3%. In April, sales were unrevised at a +0.1% increase. The -0.3% decline in sales in March was also unchanged.
Jobless Claims fell -12,000 to 334,000 last week, reaching the lowest level since early May, pointing to a slower pace of layoffs. Economists had expected a seasonally adjusted initial claims figure of 350,000, compared with 346,000 in the prior week. The average of new claims over four weeks, which smooths weekly swings, declined by -7,250 to 345,250. Continuing claims, which are issued with a one-week lag, ticked up +2,000 to 2.97 million. The four-week average of continuing claims, which reflect the number of people already receiving benefits, fell -12,750 to 2.97 million, hitting the lowest level since April 2008.
Wholesale prices rose in May for the first time in three months, nudged up by higher costs for gas, fresh eggs and light trucks. The producer price index climbed a seasonally adjusted +0.5% last month. That was sharply higher than the +0.1% increase expected by economists. The spike follows declines of -0.7% in April and -0.6% in March that were largely the product of falling gas prices. Gas prices rose in May, however, to push overall energy costs +1.3% higher.
The data didn’t do much to markets, though Treasurys pared gains after the data.
Industrial production was unchanged in May, the second straight weak monthly report, the Fed said. The flat reading was below economists' forecasts of a +0.1% gain. April's production was revised slightly higher to a drop of -0.4% from the initial estimate of a -0.5% drop. Output at factories alone increased 0.1% in May after two straight monthly declines. The sector has seen little growth since the turn of the year, the Fed said. Auto-related production rose +0.7% in May after a -0.4% drop in the prior month. Excluding the auto sector, output was unchanged. Over the past year, industrial output has risen +1.6%. Capacity utilization a gauge of slack in the economy fell to 77.6% in May from 77.8% in April, below the average of 80.2% from 1972-2012.
Tuesday, June 11, 2013 4:10 p.m est.
The market fell sharply today tracking losses in global markets after the Bank of Japan disappointed some investors by holding its policy steady, and worries about the Fed tapering continued to haunt the market as bond rates continue to back up. The dollar fell sharply against the Japanese yen after the Bank of Japan decided to stay put on its policies, dashing some hopes that the central bank would extend the duration on its ultra-low-interest rates to banks. Lows were hit early on with the Dow seeing lows of -160.00 points, S&P 500 -21.00 points and the Nasdaq -50.00 points. It did come back and almost went positive midday At the close the Dow was down by -116.00 points to 15,122.00, S&P 500 -17.00 points to about 1626.00, S&P 100 -8.00 points to 733.00 and the Nasdaq Composite -37.00 points to about 3436.00. Oil closed down -$.80 around the $95.00 level. This is interesting as the interest rate rise and the probability of the Fed ending its money flow really is having an effect on the market. This is good news as it means we’ll likely remain in this mode for awhile with volatility remaining high. Markets never go straight up and then straight down, they generally consolidate for a while and then decide their next direction. Time to maybe look for a quiet sideways market this summer!
Monday, June 10, 2013 4:10 p.m est.
The market started the day on the upside after Standard & Poor's Ratings Services revised its outlook on Americas credit rating to stable from negative and overnight Japan rallied +5% on news about having a positive GDP. The key about the ratings agency though is that they didn’t change their actual rating but just the mention of stability helped the market. The Dow saw highs of +70.00 points, S&P 500 +6.00 points and the Nasdaq +10.00 points in the morning but it didn’t last as it fell later on with the Dow seeing lows of -40.00 points, S&P 500 -4.00 points and the Nasdaq -10.00 points. At the close the Dow was down by -10.00 points to 15,238.00, S&P 500 -.60 points to about 1643.00, S&P 100 +.25 points to 741.00 and the Nasdaq Composite +5.00 points to about 3474.00. Oil closed down +$.25 around the $96.00 level. The market is showing its consolidating the gains that its made the past few months which is good news and it could last for quite some time to come.
Friday, June 7, 2013 4:10 p.m est.
The market rallied today after the employment report came in better than expected with the Dow seeing highs of +210.00 points, S&P 500 +20.00 points and the Nasdaq +40.00 points in the morning. After that it fell back but the final hour saw another rally to close at new highs. At the close the Dow was up by +208.00 points to 15,248.00, S&P 500 +21.00 points to about 1643.00, S&P 100 +8.00 points to 740.00 and the Nasdaq Composite +45.00 points to about 3469.00. Oil closed up +$1.40 around the $96.00 level.
There were +175,000 jobs created in May in a sign that the economy continues to grow at a moderate pace despite higher taxes, federal spending cuts and a weak global economy. The unemployment rate ticked up to 7.6% from 7.5%. Economists expected an increase of +164,000 jobs last month and a jobless rate of 7.5%. Employment gains for April and March were little changed. The number of new jobs created in April was lowered to 149,000 from 165,000, while March's figure was revised up to 142,000 from 138,000. The largest increase in hiring in May occurred in the fields of professional services, (57,000), bars and restaurants (38,000), and retail (28,000). The manufacturing sector cut -8,000 jobs and government employment fell slightly again. Average hourly wages, meanwhile, edged up +1 cent to $23.89 while the average workweek was unchanged at 34.5 hours. The overall jobless rate dipped to 13.8% from 13.9%, while the civilian participation rate rose for the first time since October to 63.4%, as 420,000 people joined the labor force.
Thursday, June 6, 2013 4:10 p.m est.
The market started the day on the downside once again and really started to sell off midday with the market touching that -5% correction level I’ve talked about with the Dow seeing lows of -120.00 points, S&P 500 -11.00 points but the Nasdaq only saw -5.00 points. The final hour saw a complete turnaround and the market closed at its highs of the day with the Dow up by +80.00 points to 15,042.00, S&P 500 +14.00 points to about 1623.00, S&P 100 +5.00 points to 732.00 and the Nasdaq Composite +23.00 points to about 3424.00. Oil closed up +$1.00 around the $95.00 level. It wasn’t surprising to see the market turn around today as it was incredibly oversold in the shortest of time but disappointing as we are going into the most important economic report of the month, employment. If the number disappoints we could be back at lows once again. The key thing is that we are seeing volatility once again and as we move through the summer it will likely continue.
Jobless claims fell by -11,000 to a seasonally adjusted 346,000. Economists surveyed expected claims to decline to 345,000 from a revised 357,000 in the prior week. The four-week average of claims, a more reliable measure than the volatile weekly number, rose by +4,500 to 352,500 to mark the highest level in six weeks. Applications for first-time unemployment benefits, though not far from a five-year low, have leveled off in 2013 after steady drop toward the end of last year. The flattening out of claims goes along with a drop-off in hiring over the past few months. The economy added an average of +152,000 jobs in March in April, down sharply from a +237,000 monthly rate from November through February. Economists are not expecting much improvement in May. The U.S. likely added a net +172,000 jobs last month, according to a poll, with unemployment holding steady at 7.5%. The odds of a smaller increase, however, grew on Wednesday after ADP, the giant payroll-handling firm, reported a smaller than expected +135,000 gain in private-sector jobs in May. The government will issue the May employment report on tomorrow morning. Meanwhile, the number of people already receiving benefits, known as continuing claims, declined by -25,000 to a seasonally adjusted 2.95 million in the week ended May 25th.
Wednesday, June 5, 2013 4:10 p.m est.
The market fell today as economic data wasn’t that good and with the Fed threatening to pull the free cash it gave a reason for selling with the Dow seeing lows of -240.00 points, S&P 500 -25.00 points and the Nasdaq -50.00 points. The final hour saw it turn around a bit though and at the close the Dow was down by -217.00 points to 14,960.00, S&P 500 -23.00 points to about 1609.00, S&P 100 -10.00 points to 726.00 and the Nasdaq Composite -44.00 points to about 3402.00. Oil closed up +$.16 around the $94.00 level. We actually touched that -5% level I was talking about yesterday so as we go into the Employment report Friday it will be interesting to see how the market reacts.
What sent the market lower was after it was reported that Private-sector job growth picked up a bit in May but remained in a slow-growing mode. Automatic Data Processing Inc. ADP -0.83% reported that private-sector employment increased by +135,000 jobs in May, up from +113,000 in April. A prior April estimate pegged private job gains at +119,000, and economists expected ADP to report a +170,000 increase.
According to ADP, private service-providing employers added +138,000 jobs in May, while goods producers cut -3,000 jobs. There were gains among all business sizes.
Markets look to ADP’s report on private-sector payrolls to provide some guidance on the U.S. Department of Labor’s jobs estimate, which will be released Friday and includes information on both private- and public-sector payrolls. Economist expect the government to report employment expanded by +175,000 in May, a tad higher than a +165,000 gain in April. They also expect that the unemployment rate remained at 7.5%.
Productivity in the first quarter was a bit lower than initially thought and hourly compensation for workers posted the biggest decline since at least 1947, according to newly revised government figures. Productivity rose +0.5% in the January-to-March period, down from a first read of +0.7%. That matched the forecast of economists. The rise in output was lowered to 2.1% from an original read of 2.5% and the growth in hours worked was reduced to 1.6% from 1.8%. Hourly compensation, meanwhile, plunged -3.8% in the first quarter instead of rising +1.2% as initially reported. That's the biggest decline since the Labor Department began keeping track in 1947, with the largest drop occurring in the manufacturing sector. It follows a huge +9.9% gain in compensation in the fourth quarter, however, and hourly wages and benefits over the past four quarters are actually +2% higher. Adjusted for inflation, hourly wages fell an even steeper -5.2% in the first quarter. As a result, unit-labor costs sank -4.3%. In the manufacturing sector, productivity growth was revised down to 3.5% from 3.8%.
The Institute for Supply Management said its May services index edged up to 53.7% in May from 53.1% in April, indicating a slight acceleration. Economist had expected a 54% reading. Of the key subindexes, the business activity index was at 56.5%, the new orders index was at 56%, and employment barely stayed positive at 50.1%.
Tuesday, June 4, 2013 4:10 p.m est.
Well it had to end sometime and today was it as the market closed lower for the 1st Tuesday in 20-weeks. Whenever something starts to get talked about a lot you know the end is coming sooner than later. The market started the day on the upside though with the Dow seeing +30.00 points, S&P 500 +5.00 points and the Nasdaq Composite +10.00 points. However when Fed President Esther George released her prepared remarks about the Fed needing to end its $85 billion dollar cash infusion program the market started to sell off with the Dow seeing lows of -160.00 points, S&P 500 -17.00 points and the Nasdaq -40.00 points. The final hour saw it turn around a bit though. At the close the Dow was down by -76.00 points to 15,178.00, S&P 500 -9.00 points to about 1631.00, S&P 100 -4.00 points to 736.00 and the Nasdaq Composite -20.00 points to about 3445.00. Oil closed up +$.35 around the $93.00 level. Market dynamics are starting to get back into normal trading patterns once again but to confirm that we need to see at least a -5% correction before we can say that for sure. Whats most interesting is that although were not down that much the market is getting incredibly oversold.
The Fed’s next step should be to reduce the size of its asset-purchase program, said Esther George, president of the Kansas City Fed Bank. George cancelled her speech to a business group in Santa Fe, N.M. due to illness, but released her prepared remarks to the media. "History suggests that waiting too long to acknowledge the economy's progress and prepare markets for more-normal policy settings carries no less risk than tightening too soon," George said. George said several sectors of the economy "are becoming increasingly dependent" on the Fed's current easy policy stance. For instance, she noted that debit balances in security margin accounts at broker-dealers hit an all-time high in April. She also said that investors are getting more aggressive in seeking our riskier assets in the leveraged loan market. George has been a critic of the Fed's $85 billion-per-month asset purchase program, voting against it in every policy meeting so far this year.
Monday, June 3, 2013 4:10 p.m est.
The market today was volatile with the market initialing falling on poor manufacturing data with the Dow seeing lows of -30.00 points, S&P 500 -8.00 points and the Nasdaq -35.00 points. It turned around midday on lower volume though and the final hour saw a push higher with the Dow seeing +140.00 points, S&P 500 +10.00 points and the Nasdaq Composite +10.00 points. At the close the Dow was up by +138.00 points to 15,254.00, S&P 500 +9.00 points to about 1640.00, S&P 100 +6.00 points to 739.00 and the Nasdaq Composite +10.00 points to about 3465.00. Oil rallied up $1.30 around the $93.00 level. As we head into tomorrows trading the market will be going for its 21st straight up Tuesday. It will be interesting to see how it turns out because we were so strong today, it may be another inidication the market has changed dynamics!!
Executives at manufacturing companies reported sharply lower orders in May and the biggest contraction in their business in almost four years, according to the Institute for Supply Management’s index declining for the 3rd straight month, falling to 49% from 50.7% in April. Any number below 50% signals that business is shrinking instead of growing. Economists had forecast the index to increase to 51%. The surprising decline suggests a global economic slowdown is hitting manufacturers particularly hard and pointing to softer U.S. growth in the second quarter. The ISM index is compiled from a survey of executives who order raw materials and other supplies for their companies. The gauge usually rises or falls in tandem with the health of the economy, though it sometimes sends false signals. After heavy losses during the Great Recession, manufacturers rode a strong performance in 2010 and 2011 before momentum waned in 2012. They’ve been hurt by a slower U.S. expansion and more economic turmoil in key export markets.
Friday, May 31, 2013 4:10 p.m est.
Volatility may actually be returning to the market as we enter June as we’ve actually seen some decent movement intraday this week. Today we started the day lower but then the market rallied back with the Dow seeing highs of +70.00 points, S&P 500 +6.00 points and the Nasdaq Composite +15.00 points. Midday it started slipping though with the Dow seeing lows in the final hour of -210.00 points, S&P 500 -25.00 points and the Nasdaq -40.00 points.
At the close the Dow was down by -208.00 points to 15,116.00, S&P 500 -24.00 points to about 1631.00, S&P 100 -7.00 points to 738.00 and the Nasdaq Composite -35.00 points to about 3456.00. Oil sold off once again down -$1.70 around the $92.00 level.
Consumer spending fell in April by the sharpest amount in almost a year, likely because of slightly softer car sales and less demand for energy. Spending dropped -0.2% last month on a seasonally adjusted basis. The increase in spending for March was revised down to +0.1% from +0.2% also. Personal income, meanwhile, decreased "less than -0.1%" in April after a revised +0.3% gain in March, mostly because of lower rents and farm-related earnings. Wages rose slightly. Economists had forecast a -0.1% decline in consumer spending in April and a +0.2% increase in personal income. The personal savings rate held steady at 2.5% and remains near a five-year low. Inflation as gauged by the core PCE price index increased less than +0.1% in April, and it's up just +1.1% in the past 12 months. That's the lowest level since March 2011 and just a notch above an all-time low. Overall PCE declined by -0.3% and is up a meager +0.7% in the past year. That's the lowest rate since October 2009.
The final May reading of the University of Michigan and Thomson Reuters consumer-sentiment index jumped to 84.5%, the highest level since July 2007,from 76.4% in April, according to news reports. A preliminary May reading pegged the gauge of 83.7%. Economists had expected a final May reading of 83.8%.
Yesterday it was reported that the economy grew at a +2.4% annual pace in the first quarter, little changed from the originally reported +2.5% increase. Economists had expected growth to remain unchanged at +2.5%. Consumer spending was somewhat higher, while business investment and government outlays were revised down, according to the government's second assessment of gross domestic product. Consumer spending, the engine of the economy was revised up to +3.4% from +3.2%, at the fastest rate in two years. Yet business investment in commercial real estate fell sharply and companies did not increase inventories as much as previously believed. Inventories rose $38.3 billion instead of the previous estimate of $50.3 billion. Also, government spending fell by a revised -4.9% instead of -4.1%. In the trade category, export growth was revised down to +0.8% from +2.9% and import growth was reduced to +1.9% from +5.4%. Adjusted corporate profits, meanwhile, fell by $43.8 billion in the first quarter after a $45.4 billion increase in the fourth quarter. Inflation as measured by the PCE index was muted, rising just +1.0% overall or by +1.3% excluding food and energy. The GDP report will be refined through one further update next month.
Jobless Claims rose more than expected rising +10,000 to 354,000. The consensus forecast of economists was for claims to rise +1,000 to 345,000. The four-week average rose +6,750 to 347,250 and is the highest level since April 20th. Claims in the previous week were revised to a decrease of +19,000 to 344,000 compared with the initial estimate that they dropped -23,000 to 340,000.
Wednesday, May 29, 2013 4:10 p.m est.
Yesterday the market started the long weekend on the upside strongly but by he end of the day it had lost a lot of its gains. Today selling continued and at its lows the Dow was off -180.00 points, S&P 500 -20.00 points and the Nasdaq -50.00 points. It came back a bit by the close with the Dow down by -107.00 points to 15,302.00, S&P 500 -12.00 points to about 1648.00, S&P 100 -5.00 points to 742.00 and the Nasdaq Composite -21.00 points to about 3467.00. Oil sold off hard down -$2.00 around the $93.00 level. The market is giving indications of a top being put in place and so we could finally see some type of correction occur. It likely won’t be anything to big however as we have been up so strong this year already. As a matter of fact the market has seen an average +24% yearly gain twenty six times since WWII when the market has been this strong in January and February. The question is how much of a correction if we don’t get at least a -5% correction we could be setting up for a crash in the fall.
Yesterday it was reported that Consumer Confidence climbed to a five-year high of 76.2% in May from an upwardly revised 69% in April, the Conference Board said. The increase beat the forecast of economists, who expected the index to rise to 72.3%. Consumers were more optimistic about the health of the economy over the next six months. The expectations index jumped to 82.4% from 74.3% in April to mark the highest level in seven months. They were somewhat less optimistic about how they feel right now. The present situation index rose to 66.7% from 61%. Consumers are "considerably more upbeat about future economic and job prospects," said Lynn Franco, director of economic indicators at the Conference Board. "Back-to-back monthly gains suggest that consumer confidence is on the mend and may be regaining the traction it lost due to the fiscal cliff, payroll-tax hike and sequester."
Prices for Homes rose in March, reaching the highest year-over-year growth rate since April 2006, with annual gains in all 20 cities tracked by S&P/Case-Shiller, according to data released. Signaling continued housing-market momentum, the 20-city composite index rose +1.4% in March, the largest monthly growth since July, and was up +10.9% from the same period in the prior year. On a seasonally adjusted basis, prices rose +1.1% in March. Phoenix posted the largest year-over-year price growth at +22.5%, while New York had the lowest at +2.6%. Low inventory and interest rates, as well as pent-up demand, are supporting home prices. Despite recent gains, the 20-city composite index indicates that prices remain about -28% below a 2006 peak.
Wednesday, May 22, 2013 4:10 p.m est.
Interesting day, it was almost surprising seeing the market sell off! Did you know that the last time the S&P 500 made an all time high and then closed down more than -1% was 3/24/2000 and 10/11/2007 when longer term tops were made. What is interesting about this is that it appears the sell off today was all about the Fed’s persistent $85 billion monthly inflow of cash for the market. Today Fed Chief Ben Bernanke gave testimony on the state of the economy and if you just read it, it sounded like the printing presses wouldn’t stop so the market rallied but when asked “when” the Fed planned on cutting back, he said “we could start in the next few meetings.” This pulled the market back almost instantly from the Dow seeing highs of +160.00 points, S&P 500 +18.00 points and the Nasdaq +30.00 just before the answer to gains being cut in half. It then did rally a bit but when minutes were released at 2:00 p.m est, indicating that they actually are talking about cutting back, the market fell! The Dow saw lows of -130.00 points, S&P 500 -21.00 points and the the Nasdaq -60.00 points in the final hour.
At the close the Dow was down by -80.00 points to 15,307.00, S&P 500 -14.00 points to about 1655.00, S&P 100 -5.00 points to 744.00 and the Nasdaq Composite -27.00 points to about 3463.00. Oil was also lower closing down -$1.75 around the $94.00 level.
The market is closing in on the start of the summer. The period between Memorial Day and Labor Day is often a low volume grind marked by little movement and maybe the sell off today was the start of it. I’m not expecting a major pullback in stocks but it is possible that some moderation in the rate of climb of the indexes lies ahead and volatility will return. We'll see how the end of this week shapes up and how things progress into the month of June.
Existing-home sales rose +0.6% in April to a seasonally adjusted annual rate of 4.97 million, the highest rate since November 2009, when a buyer tax credit deadline approached pointing to a continuing recovery, the National Association of Realtors reported. Sales of existing homes in April were +9.7% higher than during the same period in the prior year. Meanwhile, median prices hit $192,800 in April, the highest since 2008, up +11% from the same period in the prior year, with low inventory supporting prices. Economists had expected the pace of existing-home sales to hit a rate of 5 million in April, compared with a prior estimate of a 4.92 million rate in March. On Wednesday, NAR revised March's rate to 4.94 million. Inventories rose +11.9% in April to 2.16 million existing homes for sale. April tends to have the highest inventories of the year. The supply rose to 5.2 months in April from 4.7 months in March. Distressed property sales fell to 18% of all transactions in April, the lowest since data collection began in 2008. Pent-up demand is supporting sales, but tight credit standards and inventories are holding back gains, NAR said.
Tuesday, May 21, 2013 4:10 p.m est.
Last week Dallas Fed President Richard Fisher said that the central bank should dial back purchases of mortgage-backed securities, with the goal of eliminating them entirely as the year wears on. "In my view, the housing market is on a self-sustaining path and does not need the same impetus we have been giving it," said Fisher, who did vote for the first tranche of MBS purchases. Fisher, who's not a voting member this year, added the Fed could soon be buying 100% of MBS issuance if the current program continues and if refinancing activity shifts down.
Going along with that was San Francisco Fed President John Williams saying the central bank's $85 billion per month bond purchase program can be reduced somewhat if the economy grows as he forecasts. "Assuming my economic forecast holds true and various labor market indicators continue to register appreciable improvement in coming months, we could reduce somewhat the pace of our securities purchases, perhaps as early as this summer. Then, if all goes as hoped, we could end the purchase program sometime late this year," said Williams. Williams doesn't have a vote either but his remarks are significant as he's one of the few doves to openly say bond purchases can be halted this year.
Today New York Fed President William Dudley said that he is not sure which way the central bank will adjust the size of its bond purchase program given the uncertain economic outlook. In a speech to the Japan Society, Dudley said he expects to see, at some point, enough evidence of a substantial improvement in the labor market to reduce the pace of asset purchases. "Over the coming months, how well the economy fights its way through the significant fiscal drag currently in force will be an important aspect of this judgment," Dudley said. The New York Fed president said there is a risk that the financial market overreacts to any move to pull back from easing and the Fed must think "long and hard" about how not to disrupt the economy. Dudley said the Fed may rethink its current plan to sell mortgage backed securities from its balance sheet over a three-to-five year period once it exits. Several factors argue for allowing the agency MBS securities to run off passively, he said.
Yesterday the market was slightly down but today it started its 19th Tuesday in a row higher with the Dow eventually seeing highs of +90.00 points, S&P 500 +8.00 points and the Nasdaq +15.00 points by midday. It didn’t hold though in the final hour, so at the close the Dow was up by +52.00 points to 15,388.00, S&P 500 +3.00 points to about 1669.00, S&P 100 +2.00 points to 749.00 and the Nasdaq Composite +6.00 points to about 3502.00. Oil was also lower closing down -$.50 around the $96.00 level.
Wednesday, May 15, 2013 4:10 p.m est.
The market started the day down with the Dow seeing -40.00 points, S&P 500 -4.00 points and the Nasdaq Composite -5.00 points. Of course it didn’t last with this momentum market and it turned around with the Dow seeing highs of +90.00 points, S&P 500 +12.00 points and the Nasdaq +15.00 points. Tech stocks were the laggard and when Apple along with some other tech stocks and the high flying financial stocks started selling off the market pulled back with the Nasdaq making new lows of -10.00 points and the Dow and S&P hitting the break even mark. It turned around again though in the final thirty minutes of trading to get back to gains in the end. As we move into the final two days of trading for this expiration cycle it still wouldn’t surprise me to see a sharp correction as short term indicators are so overbought and we are so far above Program Number levels.
At the close the Dow was up by +60.00 points to 15,276.00, S&P 500 +8.00 points to about 1659.00, S&P 100 +4.00 points to 744.00 and the Nasdaq Composite +8.00 points to about 3471.00. Oil was also down hard at first actually supporting the stock market but when it turned around it also helped pull the market back. It ended up closing up +$.10 around the $94.00 level.
Wholesale prices fell by a seasonally adjusted -0.7% in April, the biggest drop in more than three years, largely because of sharply lower gasoline prices. Energy prices sank -2.5% last month, owing mostly to -6% fall in gas. Yet food costs also dropped -0.8% to mark the largest decline in almost two years, as the price of vegetables and meat fell. Excluding the volatile categories of food and energy, so-called core producer prices rose +0.1%. Economists had predicted a -0.7% decline in the overall producer price index and a +0.2% rise in core PPI. In the past 12 months wholesale prices have risen an unadjusted +0.6%, which is the lowest level since last summer. The core rate has risen +1.7% in that span, unchanged from March.
The Empire State manufacturing survey fell into negative territory in May for the first time since January, the New York Fed said Wednesday. The general conditions index fell to a negative -1.4% in May from positive +3.1% in April. Economists had forecast a positive +3% reading for May. The index is designed so that readings below zero indicate more respondents saw conditions getting worse than better. The new-orders index also fell into negative territory, falling to negative -1.2% from positive +2.2% in April, as did the average employee workweek, which fell to negative -1.1% from -5.7% in April. The Empire State is the first of a host of regional manufacturing sentiment gauges to be released.
Industrial production fell -0.5% in April, dragged lower by a big drop in utilities output but also by a drop in manufacturing, the Fed said. Economists expected a drop of -0.3%. In addition, March's growth was downwardly revised to +0.3% from +0.4%, and February's growth was downwardly revised to 0.9% from 1.1%. In April, manufacturing output fell 0.4%, mining output rose 0.9%, and utilities output dropped 3.7%, with the latter reflecting more normal April weather after an unusually cold March. Capacity utilization fell to 77.8% from a downwardly revised 78.3%.
After declining for three months, a gauge of confidence among home builders rose in May, led by views on current sales and prospective buyers, according to the National Association of Home Builders/Wells Fargo housing-market index. The overall builder-confidence index rose to 44% in May from 41% in April. "Builders are noting an increased sense of urgency among potential buyers as a result of thinning inventories of homes for sale, continuing affordable mortgage rates and strengthening local economies," said Rick Judson, a home builder and NAHB chairman. Economists polled by MarketWatch had expected the overall builder-sentiment index to rise to 44% in May from an original April estimate of 42%. The sentiment level among builders is up 57% from a year ago. Despite May's gain, the sentiment gauge remains below a key reading of 50%, signaling that builders, generally, are somewhat pessimistic about sales trends. The last time the index reached above 50% was in 2006.
Tuesday, May 14, 2013 4:10 p.m est.
Interesting: Fed puts together plan to pull back easy money. According to The Wall Street Journal: "Federal Reserve officials have mapped out a strategy for winding down an unprecedented $85 billion-a-month bond-buying program meant to spur the economy—an effort to preserve flexibility and manage highly unpredictable market expectations. Officials say they plan to reduce the amount of bonds they buy in careful and potentially halting steps, varying their purchases as their confidence about the job market and inflation evolves. The timing on when to start is still being debated."
The market closed flat yesterday but today made up for it today by opening higher and then rallying all day. The Dow saw highs of +130.00 points, S&P 500 +18.00 points and the Nasdaq +30.00 points. At the close the Dow was up by +124.00 points to 15,215.00, S&P 500 +17.00 points to about 1650.00, S&P 100 +7.00 points to 740.00 and the Nasdaq Composite +25.00 points to about 3463.00. Oil closed down -$1.00 around the $94.00 level. The rally today has put itself in an extremely overbought condition for the short term and is also in a place where very sharp corrections can start and this is a good place for that to happen as the actual internals of this rally are getting weaker and weaker.
Retailers rose slightly in April and exceeded forecasts, as broad demand for most goods outweighed a sharp drop in spending at gas stations. Retail sales rose a seasonally adjusted +0.1% last month, in a sign that consumer spending might not have softened as much as expected. Economists had forecast a -0.6% decline in retail sales. Sales at gas stations sank -4.7% to mark the biggest decline in more than five years. Yet retail spending actually climbed +0.7% in April if gas is excluded. Consumers evidently used some of their savings at the gas pump to boost spending on electronics, clothes and hobby items, among other things. They also increased spending at bars, restaurants and Internet shopping sites. Aside from gas, the only categories to see a decline in spending were groceries, liquor and personal-care stores. In March, meanwhile, the decline in retail sales was revised down to +0.5% from +0.4%. The increase in sales in February was revised up a tick to 1.1%.
The prices paid for imported goods fell -0.5% in April, mainly because of lower oil costs. Economists had forecast a -0.5% decline. Excluding fuel, import prices fell by a smaller -0.2% in April. Fuel import prices sank -1.7% last month after a -0.6% drop in March. The drop in import prices in March was revised to show a -0.2% decrease instead of -0.5% as originally reported. Over the past 12 months, import prices are -2.6% lower. The price of U.S.-made goods exported to other nations, meanwhile, declined by -0.7% in April after a revised -0.5% drop in March.
Thursday, May 9, 2013 4:10 p.m est.
The market continues to climb now up +15% for the year and +22% in the past 6 months alone but that's not extreme in any way!! I showed a chart the other day on how the market is way out of sync with economic data. One thing that is also not in sync is that margin debt just made a new all time high previously seen at the 2007 and 2000 tops in the market. A good form of credit is something like a standard business loan in which a company obtains access to a line of credit in order to make investments in the firm. It pays employees, invests in equipment, etc. This form of credit, when issued properly, is usually productive in that it helps the company expand and it rewards the lender for having taken the risk.
As a credit based money system we rely largely on the health of these sorts of loans to keep the system running smoothly. But there are also bad forms of credit. For instance, when a homeowner decides they want to speculate on real estate as an investment because they think real estate can outpace inflation over the long-term you can know that's a bad idea. This of course along with the repackaged mortgage deals were the core piece of the 2008 crisis.
As this market surges we inevitably see a sort of ponzi effect in the market right now where more confidence breeds more credit and the bidding up of prices. It works until it doesn’t and when it doesn’t the air sure comes out fast. The sad thing is because of the Fed’s continued printing press of the past 12-years we live in a world that is built on such a fragile foundation. Someday I hope we can get back to fundamentals!
We saw a bit of selling at the start of the day with the Dow down -40.00 points, S&P 500 -6.00 points and the Nasdaq -10.00 points but because of the credit I mentioned above of course it came back with the Dow seeing highs of +40.00 points, S&P 500 +3.00 points and the Nasdaq +20.00 points. Going into the final hour it fell again however as there was a rumor about an article the Wall Street Journal was writing about the Fed actually trimming back on there money flow. The Dow was lows of -60.00 points, S&P 500 -10.00 points and the Nasdaq -15.00 points.
At the close the Dow was down by -23.00 points to 15,083.00, S&P 500 -6.00 points to about 1627.00, S&P 100 -3.00 points to 730.00 and the Nasdaq Composite -4.00 points to about 3409.00. Oil was down closing -$.68 around the $96.00 level.
Jobless Claims were down -4,000 to 323,000. Economists had expected initial claims to rise slightly to 335,000 from an original estimate of 324,000 for the prior week, echoing softness in other recent labor-market data. Recent readings on initial claims signal little change in the pace of layoffs. The four-week average fell -6,250 to 336,750, hitting the lowest level since November 2007, near the start of the recession. Continuing claims dropped -27,000 to a seasonally adjusted 3.01 million, reaching the lowest level since May 2008. The four-week average of these claims from people already receiving benefits fell -24,500 to 3.03 million, the lowest since June 2008.
Wholesale inventories grew +0.4% in March, while wholesale sales tumbled -1.6%. The monthly sales drop was the largest since March 2009. The ratio of inventories to sales grew to 1.21 from 1.19 in March.
Tuesday, May 7, 2013 4:10 p.m est.
The market was higher again today for no real reason except to move up although a sell program in the early morning pulled it back pretty good and although it looked like we would continue to correct it turned around once again to close higher. The Dow saw highs of +90.00 points, S&P 500 +9.00 points but the Nasdaq lagged +10.00 points.
At the close the Dow was up by +87.00 points to 15,056.00, S&P 500 +8.00 points to about 1626.00, S&P 100 +3.00 points to 730.00 and the Nasdaq Composite only +4.00 points to about 3397.00. Oil was down closing down -$.60 around the $95.00 level.
Here is a chart that illustrates how frustrated I am with this market.
What this chart is about is illustrating how macro economic data has fallen off a cliff in the past two months while the markets have continued to climb. Let's not kid ourselves - this is no surprise, we can see it, we can feel it isn’t right but this wave continues higher and seems like it's never going to break. I mean lets face it the only reason this market is up is due to the unrelenting Fed pump that keeps it going. Actually if you calculate it out the real value of the S&P is at 1,450 naturally. With the $150 billion a month pumped in by the Fed it gives us 150 bonus points. Rumors of the ECB putting in stimulus as well put us over the 1,600 line. The main point of it all is that if you compare the last two years to now when economic data fell off the cliff, you have to question when will this correction start!!
Monday, May 6, 2013 4:10 p.m est.
The market started the week mostly flat and was mixed most of the day with the Dow down and tech stocks remaining higher but as the day went on the Dow saw slight highs of +20.00 points, S&P 500 +6.00 points and the Nasdaq +20.00 points. At the close the Dow was down by -5.00 points to 14,969.00, S&P 500 +3.00 points to about 1618.00, S&P 100 +1.50 points to 727.00 and the Nasdaq Composite +14.00 points to about 3393.00. Oil was down all day but closed higher in the end up +$.10 around the $96.00 level.
The market continues to hold onto gains but continues to need a correction to bring it back down to reality which would be very healthy. The market is now about +150% above its 2009 low and so its naturally getting long in the tooth. Although many analysts are saying it could go much higher the odds continue to favor some type of pullback starting in here at any time. This week is sure to be telling!!
Friday, May 3, 2013 4:10 p.m est.
The market shot up this morning as the employment report out this morning was a bit better than expected with the Dow moving over the 15,000 level and S&P 500 1600 for the first time ever. The Dow saw highs of +130.00 points, S&P 500 +16.00 points and the Nasdaq +50.00 points. At the close the Dow was up by +142.00 points to 14,974.00, S&P 500 +17.00 points to about 1614.00, S&P 100 +6.00 points to 726.00 and the Nasdaq Composite +38.00 points to about 3379.00. Oil closed up +$1.50 around the $95.50 level.
The market is now up over +13% in the first three months of the year which means at this pace we could see a +39% overall gain for the year. As we move into May the question always arises will it be a “sell in May and go away” situation or will we continue to rally. So far this week it has been in rally mode and continues to make new highs. This however is getting people nervous as big private equity players are selling into it. According to CNBC, big players in private equity are selling stocks and all kinds of assets into the current buying frenzy. CNBC noted: " Some of the biggest and most sophisticated private equity and hedge fund investors in the world are stepping back from equities and bond markets. At a pair of morning panels at the Milken Institute Global Conference, fund managers including Joshua Harris, the co-founder and chief investment officer of Apollo Global Management; Wilbur Ross of WL Ross & Co.; and Apollo chief Leon Black warned that central bank policies around the globe had set stock and bond prices soaring too high. Investors should "run—do not walk" from bonds at current prices, Harris said. " Another thing to be aware of as we do move higher.
One thing that should be noted is that the last three years have seen a -6.2% fall in 2012, -1.9% in 2011 and -7.9% in 2010 in May after initial higher starts. The Nasdaq hit a 12.5 year high last month and a new one today as well as the S&P 500’s 6th straight monthly gain. All of this when economic data is indicating a possible recession on the way, people setting records for food stamps and now just reported that home ownership at its lowest level since 1995! Strangely enough we also see bond yields nearing record lows, normally yields are rising if the stock market is up. Something has to give here, either the economy will pick up, bond selling will help to support stocks or the stock market will come back to reality and start correcting a little because it has been up so much. In the end May could turn out to be an interesting month!
The economy created +165,000 jobs in April and the unemployment rate fell to 7.5% from 7.6% even though the size of the labor force increased. What's more, hiring in March and February were revised up by a combined +124,000. The increase in hiring in April beat lowered forecasts. Economists had expected a +135,000 gain, with unemployment remaining at 7.6%. The decline to 7.5% puts the jobless rate at the lowest level since December 2008. Unfortunately that's because the participation rate continues to hover around record lows as people have just given up on looking. Professional services added +73,000 workers; bars and restaurants hired +38,000 people; and the retail business generated +29,000 jobs. Manufacturing employment was unchanged and construction lost -6,000 jobs which isn’t good, perhaps due to colder than normal weather in the month. Average hourly earnings rose +4 cents to $23.87 in April and the average workweek dipped 0.2 hours to 34.4.
Wednesday, May 1, 2013 4:10 p.m est.
The market started the day to the downside after economic data came in worse than expected indicating that the jobs report on Friday will be poor on Friday. It remained there midday even though the Fed said it would keep buying $85 billion in bonds each month, but may cut or increase the program depending on the economy. The Dow saw lows of -150.00 points, S&P 500 -16.00 points and the Nasdaq -40.00 points before rising a bit at the end of the day. At the close the Dow was down by -140.00 points to 14,701.00, S&P 500 -15.00 points to about 1583.00, S&P 100 -6.00 points to 713.00 and the Nasdaq Composite -30.00 points to about 3300.00. Oil closed down -$2.00 around the $91.00 level.
Private-sector employment growth slowed down in April, hitting the lowest result in seven months as tax hikes and government spending cuts took a toll. Private employers added only +119,000 jobs in April, the weakest gain since September, compared with +131,000 in March. Job growth appears to be slowing in response to very significant fiscal headwinds indicating that tax increases and government spending cuts are beginning to hit the job market. A payroll tax cut expired at the end of 2012, and income tax rates were raised for the wealthy, while in March, the so-called sequester of automatic spending cuts kicked in. Economists had expected the report to show that the economy added +150,000 private-sector jobs in April, compared with an original March estimate on +158,000. Economists are now expecting the government to report Friday that employment rose +135,000 in April, up from a gain of +88,000 in March. According to ADP, service providers dominated employment growth in April, adding +113,000 jobs. Meanwhile, goods producers added a slim +6,000 jobs.
By firm size, small businesses added +50,000 jobs, large businesses added +43,000 jobs and medium businesses added +26,000 jobs.
Tuesday, April 30, 2013 4:10 p.m est.
Interesting note: The U.S. is to pay down debt for first time in years. According to The Wall Street Journal: "The federal government said it would pay down a small portion of the national debt this quarter for the first time in six years. The debt reduction, seen as temporary, is a sign that higher tax receipts and spending cuts are improving Washington's finances. The respite in borrowing will likely give the Obama administration a bit more time before running up against the federal debt ceiling. The Treasury Department said that it expects to retire a net $35 billion in bonds, notes and bills from April to the end of June. That compares with its estimate from earlier this year that it would rack up an additional $103 billion in marketable debt in the second quarter."
This is the first time ever that the market has gone this long into a trading year without seeing three consecutive days of losses. This being said, thank you Federal Reserve!! Another interesting thing to note is that the current rally from its bottom has seen the market up for 24-weeks with a +19% gain with only small losses here and there. Other rallies the past few years have seen the market up nearly the same time frames of 24-weeks before a more significant correction ensued with -10% declines. Considering volume continues to shrink and the very savvy index option traders have been selling pretty strongly, I think the top is very close and may be here in time frames also.
The market started the day mixed but by the end of the day it closed basically at its highs with the Dow seeing +30.00 points, S&P 500 +5.00 points and the Nasdaq +30.00 points before pulling back a bit at the close. At the close the Dow was up by +21.00 points to 14,840.00, S&P 500 +4.00 points to about 1598.00, S&P 100 +2.00 points to 719.00 and the Nasdaq Composite +22.00 points to about 3329.00. Oil closed down -$1.00 around the $93.00 level.
There was no reason for the market to be up as once again as economic data was poor with the Chicago PMI slumping to a three-and-a-half year low of 49% in April, down from 52.4% in March and at a reading indicating contraction. Economists had expected a 52.5% reading. Order backlogs were particularly weak, falling to 40.6% from 45%. The Chicago PMI is the last of the regional manufacturing indexes to be released before the national Institute for Supply Management manufacturing index for April.
Consumer Confidence jumped to 68.1% in April from an upwardly revised 61.9% in March, recovering entirely from the sharp drop in the prior month, the Conference Board said. The rebound in the index easily surpassed the 61.3% forecast of economists. Consumer confidence tumbled in March in part because of the so-called sequester, the controversial law that requires billions of dollars in federal spending cuts. Yet higher stock prices and lower gasoline costs may have eased the concerns of Americans in April, pushing the confidence index higher. Consumers were more optimistic about the health of the economy over the next six months than they are right now. The expectations index surged to 73.3% from 63.7% in March, marking the highest level since November. The present situation index was little changed, inching up to 60.4% from 59.2%. Yet the percentage of people saying jobs are hard to find right now rose more sharply than those who say jobs are "plentiful."
Signaling continued housing-market momentum, the S&P/Case-Shiller 20-city composite index rose a non-seasonally adjusted +0.3% in February and was up +9.3% from the same period in the prior year, hitting the largest year-over-year growth since May 2006, according to data released Tuesday. February's monthly growth was the largest since August. On a seasonally adjusted basis, prices rose +1.2% in February. All 20 cities saw year-over-year gains in February, with faster growth in 16 cities. Phoenix posted the largest year-over-year price growth at +23%, while New York had the lowest at +1.9%. With ongoing low interest rates, increasing demand and constrained inventory have been supporting prices. However, despite recent gains, the 20-city composite index indicates that prices remain about 29% below a 2006 bubble peak.
The employment cost index, which measures the price of labor, rose +0.3% in the first quarter. Economists expected a +0.5% gain, which would have matched the fourth-quarter increase. Over the past 12 months, employment costs have climbed +1.8%, down from the fourth-quarter rate of +1.9%. The ECI is a closely followed gauge that reflects how much companies, governments and nonprofit institutions pay their employees in wages and benefits. Wages some 70% of employment costs rose +0.5% in the first quarter. Benefits edged up +0.1%. .
Monday, April 29, 2013 4:10 p.m est.
The market started the week on the upside with the Dow seeing highs of +140.00 points, S&P 500 +15.00 points and the Nasdaq only +40.00 points before pulling back a bit at the close. At the close the Dow was up by +106.00 points to 14,819.00, S&P 500 +11.00 points to about 1594.00, S&P 100 +5.00 points to 717.00 and the Nasdaq Composite +28.00 points to about 3307.00. Oil closed up +$1.50 around the $94.00 level. Volume was low today but the move higher wasn’t surprising though as we are approaching month end and managers like to make their books look good! I heard an interesting saying today, “ you know something is wrong when you see record stock prices and record numbers of people receiving food stamps! Something wrong with that picture! One thing for sure though is you have to hand it to the bulls as the market had its worst week of the year, losing -2.1% two weeks ago and the bulls have fought back nicely to bring the market back near its old highs. The combo of 1,550 on the S&P 500 and the 40-day moving average were solid support. After month end window dressing is done all eyes will be on this Fridays employment report so we’ll see how the market is by weeks end however!
Consumer spending rose +0.2% in March to mark the smallest increase since December, providing more evidence that the economy has slowed. Personal income also rose a seasonally adjusted +0.2% last month. Economists had forecast a +0.1% rise in spending and a 0.4% increase in income. Since income and spending grew at the same pace, the personal savings rate held steady at +2.7%, just slightly above a five-year low. Inflation-adjusted disposable income rose +0.3% last month. Inflation as gauged by the core PCE price index was unchanged in March. The core rate, which is closely followed by the Fed, has risen just +1.1% in the past 12 months, down from +1.3% in February.
Friday, April 26, 2013 4:10 p.m est.
The underground economy has been touted as the "savior" for the economy as $2 trillion dollars goes into thin air every year with a $500 billion loss in taxes! This is quite strange that the mainstream media is now touting the notion that the so called "underground" economy is going to save us all from going under. This after we only saw GDP come in at +2.5% last quarter. CNBC reported: "The growing underground economy may be helping to prevent the real economy from sinking further, according to analysts. The shadow economy is a system composed of those who can't find a full-time or regular job. Workers turn to anything that pays them under the table, with no income reported and no taxes paid — especially with an uneven job picture."
This is what happened to Greece and Cyprus because no one wanted to pay taxes. The flip side is that the real economy, because of the cumulative effects of cheating, lying, stealing and bad policy is on the verge of collapse. Here is a perfect example of how unintended consequences of bad policy work out. According to CNBC.com: "A report from ADP Research Institute states that many employers, especially in low-wage businesses such as retail and food service, plan to reduce workers' hours to less than 30 a week to avoid having to offer health benefits through Obamacare (or pay a fine)."
The market started the day mixed but then rallied once again with the Dow seeing highs of +40.00 points, S&P 500 +3.00 points and the Nasdaq only +5.00 points. Because it wasn’t that strong selling took hold once again and at the close the Dow was up by +12.00 points to 14,712.00, S&P 500 -3.00 points to about 1582.00, S&P 100 +.03 points to 712.00 and the Nasdaq Composite -11.00 points to about 3279.00. Oil closed down -$.40 around the $93.00 level.
The economy expanded at a +2.5% pace in the first three months of 2013, up from +0.4% in the fourth quarter, as consumer spending rose at the fastest rate in two years and businesses restocked warehouse shelves. Yet government spending fell sharply again and imports surged to act as drags on economic growth. Economists had forecast growth to rise to +3.2%. Consumer spending, the real driver of the economy rose +3.2% to mark the sharpest gain since the end of 2010, though some of the increase was the result of higher oil prices which isn’t real spending. Inventories also soared to an estimated $50.3 billion after a scant $13.3 billion increase in the prior quarter, but that buildup is probably unsustainable. Final sales of U.S. made goods and services, a more precise gauge of demand, rose a much smaller +1.5%. That matched the lowest increase in eight quarters. Investment in residential housing, a source of recent economic strength, jumped +12.6% to mark the third straight strong advance. Business spending on equipment and software rose +3%. In a bit of a surprise, military spending fell -11.5% after an unusually steep drop of -22.1% in the fourth quarter. And overall government spending fell -4.1% in the first three months of the year, perhaps partly reflecting federal spending cuts that began to take effect in early March. Meanwhile, imports surged +5.4% after falling -4.2% in the fourth quarter, spurred by higher oil prices. Americans had to pay more to fill up at the gas station. Exports climbed +2.9% after a -2.8% drop in the fourth quarter. Inflation as measured by the PCE price index rose at an annual rate of +0.9%, down from +1.6% in the prior two quarters. Core PCE rose slightly faster at 1.2% The GDP report will be refined through two further updates over the next few months.
Thursday, April 25, 2013 4:10 p.m est.
Yesterday the market ground its way higher and today it continued on with the Dow seeing highs of +90.00 points, S&P 500 +15.00 points and the Nasdaq +35.00 points. The final hour saw selling come in though so at the close the Dow was up by +25.00 points to 14,701.00, S&P 500 +6.00 points to about 1585.00, S&P 100 +2.00 points to 712.00 and the Nasdaq Composite +20.00 points to about 3290.00. Oil closed up +$1.80 around the $93.00 level. The market has now almost erased all of its losses from the past week to get close to previous highs. The big question is if it will continue to move up to make new highs or just test the previous ones. So far its looking like a test as this advance has seen weaker volume on the way up and its struggling to hold gains now. The next week could be very telling in the direction of the market if were moving into the “sell in May and go away” period that always comes around every spring!!
Jobless Claims fell by -16,000 to 339,000, marking the lowest level in a month and a half, but part of the decline likely reflected ongoing seasonal distortions that usually occur each year in the weeks following the Easter holiday and spring break. Other economic data suggest there's been little change in the labor market and perhaps even some softening. Economists expected claims to total a seasonally adjusted 351,000. The average of new claims over the past month, which smooths out weekly volatility, dropped by -4,500 to 357,500. That's the lowest level in three weeks. Also, the government said continuing jobless claims decreased by -93,000 to a seasonally adjusted 3.0 million. Continuing claims reflect the number of people already receiving benefits. Initial claims from two weeks ago, meanwhile, were revised up to 355,000 from an original reading of 352,000, based on more complete data collected at the state level.
Yesterday it was reported that orders for big-ticket items posted the biggest drop in March since last summer, mainly because of fewer jetliner bookings but also as orders softened in most categories. Orders for durable goods fell -5.7% last month to mark the biggest drop since last August, suggesting the manufacturing sector cooled off a bit toward the end of the first quarter. Economists had expected a -3.2% decline. Excluding the volatile transportation sector, orders fell a much smaller -1.4% but the softness was widespread. Demand fell for primary metals, heavy machinery, electrical equipment and appliances which isn’t good.
Tuesday, April 23, 2013 4:10 p.m est.
Interesting: The New York Times said In Denmark, the poster country for "cradle to grave" entitlements, things are changing. The government found that many on welfare have better lives than many who work and contribute to the pot of money that provides the country's benefits. So, they are making changes. According to the Times: "With little fuss or political protest—or notice abroad—Denmark has been at work overhauling entitlements, trying to prod Danes into working more or longer or both." The Times points out that despite the realization "Denmark's long-term outlook is troubling. The population is aging, and in many regions of the country people without jobs now outnumber those with them."
To compare this to America, there are +100,000 people going on Social Security now, while +11,000 people per day are going on food stamps. That's +105,000 per five day "workweek," that are not working. That's 5.46 million people per year that are taking money out of the system. According to the New York Times "many experts say a more basic problem" in Denmark "is the proportion of Danes who are not participating in the work force at all be they dawdling university students, young pensioners or welfare recipients who lean on hefty government support." Perhaps, this is the most important phrase in the article: "few experts here believe that Denmark can long afford the current perks. So Denmark is retooling itself, tinkering with corporate tax rates, considering new public sector investments and, for the long term, trying to wean more people—the young and the old—off government benefits." America is starting to resemble Denmark. as politicians are spending a great deal of time working on a social agenda to get votes instead of paying attention to how these policies that they are about to put in place have already failed elsewhere.
Yesterday the market started the week slightly to the upside and today rallied with the Dow seeing highs of +140.00 points, S&P 500 +16.00 points and the Nasdaq +50.00 points. Midday there was an interesting short term sell off after it was announced that there was a fake tweet about a terror attack on the Whitehouse. At the close the Dow was up by +152.00 points to 14,719.00, S&P 500 +16.00 points to about 1579.00, S&P 100 +7.00 points to 712.00 and the Nasdaq Composite +36.00 points to about 3269.00. Oil was mostly flat today closing up only +$.20 around the $89.00 level.
Last week was interesting in the market because besides the Boston news, the other big news was earnings. Basically, most companies have beaten earnings estimates, but disappointed on revenues and/or outlooks. This trend coincides with a recent downtick in overall economic data. Jobs data and manufacturing data both have drastically weakened of late but once again, we've seen this the past few years. The economy slows in the spring and summer, before accelerating the last few months of the year into the new year. I think this could be happening once again, with the housing market leading us eventually higher but according to yesterdays report of existing home sales being down even that is in question. We do however have the Fed and its $85 billion a month pumping money into the system, the effect that an improving housing market can have on the overall economy and consumer confidence is exponential versus anything the Fed does.
One of the biggest concerns though is the action in NYSE margin debt. Currently margin debt is nearing its 2007 peak. The thinking is if everyone is maxing out on margin, then they are very stretched and don't have any more buying power. Also, once things turn south, being on margin can make the drop even faster as market participants are forced to sell to cover margin calls. What is interesting, though, is margin debt in 2006-2007 soared past the 2000 peak. So on this bull run, will it once again break out well above the 2007 area before the ultimate market peak? Lastly, from 2002 to 2007, margin debt increased 193%. From the 2009 lows to current levels, it is up 111%. This might not be as extreme as it seems on the surface, and may suggest margin debt could still go higher but were getting very close so something to be aware of.
Sales of new single-family homes rose +1.5% in March following a substantial drop in the prior month, signaling that the housing market continued to go up. The seasonally adjusted annual rate of new-home sales rose to 417,000 in March from 411,000 in February. Economists had expected the rate to rise to 421,000 in March, with near-record-low interest rates continuing to support affordability. Sales are +18.5% higher than during the same period in the prior year, and economists expect the housing market to continue to gain momentum this year. Regionally, results were mixed in March, with sales up +21% in the Northeast and +19% in the South. Meanwhile, sales fell -21% in the West and -12% in the Midwest. The median sales price fell -6.8% in March from February, the largest drop since February 2011, but was up +3% from the same period in the prior year. There was a 4.4-month supply of new homes available for purchase at March's sale pace, matching February's supply ratio.
Yesterday it was reported that Existing-home sales fell -0.6% in March to a seasonally adjusted annual rate of 4.92 million, as longer-term trends posted substantial gains, pointing to a continuing recovery. Sales of existing homes in March were +10.3% higher than during the same period in the prior year. Meanwhile, median prices hit $184,300 in March, up +11.8% from the same period in the prior year, the largest year-over-year price growth since November 2005. Low inventory is supporting prices. Also, sales of higher priced homes have seen large gains over the past year, as distressed-home sales have decreased. Economists had expected a pace of 5.03 million existing-home sales for March, compared with an original estimate of a 4.98 million rate in February. On Monday, NAR revised February's rate to 4.95 million. Inventories rose +1.6% in March to 1.93 million existing homes for sale. The months supply rose to 4.7 in March from 4.6 in February.
Friday, April 19, 2013 4:10 p.m est.
The market sold off once again yesterday losing about three quarters of a percent but because today was expiration it bounced back with the Dow seeing highs of +20.00 points, S&P 500 +16.00 points and the Nasdaq +50.00 points. The Dow was mostly negative all day because of dismal earnings out of IBM saw their stock fall over -8%. McDonalds stock was also poor and GE’s flat. The most interesting thing is how the market has ignored all of the terrorism news this week and even today’s news of the manhunt going on after the Boston explosions. With expiration now done, as we go into next week it will be interesting to see if the market continues to listen to economic reports around the world or gets back on the Fed’s feeding tube once again. As we are also getting close to the old adage, “sell in May and go away,” we’ll see if the same pattern that we’ve seen the past three years takes hold. If that is the case volatility will return which will be great for us!!
At the close the Dow was up by +10.00 points to 14,548.00, S&P 500 +14.00 points to about 1555.00, S&P 100 +6.00 points to 701.00 and the Nasdaq Composite +40.00 points to about 3206.00. Oil was mostly flat today closing up only +$.10 around the $88.00 level closing the week below the $90 level.
Yesterday it was reported that Jobless claims rose by +4,000 to a seasonally adjusted 352,000 and was slightly above expectations. New claims shot up to 388,000 from 357,000 in the last week of March, before dropping back to 348,000 in the first week of April, making it harder to read labor-market trends. The four-week average, which smooths out weekly volatility was up by +2,750 to 361,250 to mark a two-month high. Still, the four-week average remains near its lowest level in five years and it’s likely to fall further in the next few weeks as the effects of the end-of-March spike fade.
The latest batch of economic reports, including initial claims, show the economy is still expanding but at a slackened pace. Economists widely expect growth in the second quarter to decelerate sharply from the first three months of the year to a +1.8% pace from an estimated +3% in the first quarter. Softer consumer and government spending and slower business investment are seen as the primary culprits. Continuing claims fell by -35,000 to a seasonally adjusted 3.07 million.
Wednesday, April 17, 2013 4:10 p.m est.
The market started the day on the downside and remained there as Europe was under pressure because the word “Depression” was being thrown around because it is describing the euro-zone economy pretty accurately of late. It is becoming increasingly appropriate however as hopes for a recovery give way to fears of an extended and destructive downturn that policy makers seem unable to halt. Unemployment is at a record high, credit is going down, and banks are failing so it does make sense. Add to the fact that China is slowing and our own economy is limping along so its not surprising that our market is finally correcting. We’ve now also had a terror attack and today the Whitehouse received letters filled with Ricin. The Dow saw lows of -200.00 points, S&P 500 -31.00 points and the Nasdaq -80.00 points but was able to recover a little in the final hour.
At the close the Dow was down by -138.00 points to 14,619.00, S&P 500 -23.00 points to about 1552.00, S&P 100 -10.00 points to 700.00 and the Nasdaq Composite -60.00 points to about 3205.00. Oil closed down hard once again as there are worries about an economic slowdown affecting transports. That index itself has been in a strong downtrend which is actually quite worrisome. Oil closed down -$2.00 around the $87.00 level.
Monday, April 15, 2013 4:10 p.m est.
The market tanked today over -2%, the most in five months as investors wanted out of gold, oil and other commodities, after reports from China showed the industrial giant’s growth had went down. The miracle was it actually stayed down as the economic slowdown that we have been seeing over here may be finally hitting home!! The Dow saw lows of -270.00 points, S&P 500 -37.00 points and the Nasdaq -80.00 points. At the close the Dow was down by -266.00 points to 14,599.00, S&P 500 -15.00 points to about 1552.00, S&P 100 -15.00 points to 700.00 and the Nasdaq Composite -78.00 points to about 3216.00. Oil closed down hard once again -$2.90 remaining around the $88.00 level. This is an expiration traded week and with the market starting the week on the downside volatility is likely to be high all week. The important thing is the market may have finally started to listen to what is going on around the world and start trading accordingly.
Manufacturing activity nudged higher in the New York region, but still indicating a slowdown showing the economy is entering a spring slowdown. The New York Fed's Empire State index fell to 3.1% points in April from 9.2% in March. That's below the MarketWatch-compiled economist forecast of 7.8%, and the slowest reading since January. Two other key subcomponents fell but remained in positive territory, with the new-orders index falling to 2.2% from 8.2% in March, and the shipments index dipping to 0.8% from 7.8% in March. The Empire State survey is a diffusion index, designed so that readings above zero indicate respondents on net saw better conditions.
Friday, April 12, 2013 4:10 p.m est.
The market actually went down today with most of the loss first thing in the morning but as the day went on it came back. The Dow saw highs of -80.00 points, S&P 500 -14.00 points but tech stocks didn’t join in again with the Nasdaq only seeing lows of -30.00 points. At the close the Dow was down by -.10 points to 14,865.00, S&P 500 -5.00 points to about 1589.00, S&P 100 -2.00 points to 715.00 and the Nasdaq Composite +5.00 points to about 3294.00. Oil closed down -$2.85 remaining around the $90.70 level.
It wasn’t surprising the market was down as people spent less at gas stations and most other stores in March, as retail sales posted the biggest decline in nine months!! The decline in sales the biggest since last June, might be a sign that higher taxes and slower job creation are taking a bite out of the economy. A cold snap in March might also have limited sales for some retail items such as clothing. The economy is slowing down after an okay first quarter, which isn’t good. Retail sales fell -0.4% last month after a revised +1% gain in February. That was below forecasts of a -0.1% decline. Sales for January were also revised to show a -0.1% drop instead of a +0.2% increase, suggesting that first-quarter growth might not be as strong as forecast. The economy is estimated to have grown +3% in the first quarter. The drop in retail sales is the latest in a string of reports, including last week’s disappointing employment number for March, signaling the economy has cooled off again.
Many economists had predicted sales might soften in the spring as consumers began to feel the pinch of higher taxes or move to rebuild a savings rate that plunged at the end of 2012. Reductions in federal spending via a law known as the sequester and a slower pace of hiring may have also have weighed on consumer spending. Retail sales account for about one-third of consumer spending, the main engine of the economy. They are a good proxy for how fast the economy is growing, though the data is prone to sharp revisions like what occurred in January. Sales have fallen in two of the first three months of 2013, and the pace of spending has decelerated. In the past 12 months, the increase in retail sales slowed to 2.8% in March from 4.4% in February.
The University of Michigan-Thomson Reuters consumer-sentiment gauge dropped to a preliminary April reading of 72.3%, the lowest result since July from a final March reading of 78.6%. Economists had expected a preliminary April reading of 79.3%. However, consumers have faced negative news on jobs and federal spending. The sentiment gauge, which covers how consumers view their personal finances as well as business and buying conditions, averaged about 87% in the year before the start of the most recent recession. Economists watch sentiment data to get a feel for the direction of consumer spending.
Producer prices fell -0.6% in March as energy costs retreated after a sharp gain in the prior month. This is the biggest one-month drop in wholesale prices since last May. Energy prices fell -3.4% in March after a +3% gain in February. This offset a +0.8% rise in food prices. Excluding food and energy, core PPI rose +0.2% for the third-straight month. About a quarter of the increase came from prices for civilian aircraft, which rose +0.7%, Economists had expected a +0.3% monthly fall in headline PPI and a +0.2% gain in core producer prices. Taken over 12 months, producer prices are up +1.1% in March, down from a +1.7% increase in February. This is the smallest year-over-year advance since last July. Core prices were up +1.7% in March, the same as February. Year-over-year core prices have come down steadily after rising +3.1% in January 2012. In others sign of tame inflation, intermediate prices are down -0.8% over the past year and crude good prices have dropped -0.3% over the same period.
Thursday, April 11, 2013
The market continued higher today after a brief dip first thing in the morning. The Dow saw highs of +80.00 points, S&P 500 +9.00 points but tech stocks didn’t join in with the Nasdaq only seeing +10.00 points. The final hour saw some selling come in and at the close the Dow was up by +63.00 points to 14,865.00, S&P 500 +6.00 points to about 1593.00, S&P 100 +2.00 points to 717.00 and the Nasdaq Composite +3.00 points to about 3300.00. Oil closed down -$1.30 remaining around the $93.30 level.
Jobless Claims fell sharply last week after a big surge the week before, largely reflecting seasonal quirks around the Easter holiday and suggesting little change in a slowly improving labor market. Initial claims fell by -42,000 to 346,000 last week. That's the lowest level in three weeks. Economists expected claims to fall to a seasonally adjusted 360,000. The average of new claims over the past month, which smooths out weekly volatility, rose by +3,000 to 358,000. Also, the government said continuing claims fell by -12,000 to a seasonally adjusted 3.08 million. Continuing claims reflect the number of people already receiving benefits. Initial claims from two weeks ago, meanwhile, were revised up to 388,000 from an original reading of 385,000, based on more complete data collected at the state level.
The prices paid for imported goods fell -0.5% in March, mostly because of lower fuel costs. Economists had forecast a -0.5% decline. The increase in import prices in February was also revised down to show a -0.6% increase instead of -1.1% as originally reported. Excluding fuel, import prices declined by -0.2% in March. Fuel-import costs dropped -1.9% last month after a +2.8% spike in February. Food-import prices rose +1.3%, however, to mark the biggest rise since September. The price of American made goods exported to other nations, meanwhile, fell -0.4% in March after a revised +0.7% gain in February. Over the past 12 months, import prices are -2.7% lower. Import prices have not risen on a 12-month basis since April 2012.
Wednesday, April 10, 2013 3:00 p.m est.
The markets been up all week but today for some reason it decided to really move up on ever weakening volume!! 542 million shares in the end, an hour ago it was only 400 million!! Back at the peak in 2008 we were seeing 2.5 billion shares a day! Yes it has been weak for quite awhile but this rally is so pathetic its ridiculous! The Dow saw highs of +160.00 points, S&P 500 +21.00 points and the Nasdaq +65.00 points. It fell back a bit going into the close with the Dow up by +129.00 points to 14,802.00, S&P 500 +19.00 points to about 1588.00, S&P 100 +9.00 points to 715.00 and the Nasdaq Composite +59.00 points to about 3297.00. Oil closed up +$.30 remaining around the $94.50 level.
What's even more ridiculous is the fact that the Fed is now divided over how long they should keep buying bonds, according to the minutes of their March 19-20th meeting. The Fed said that one member wanted to slow the bond purchases immediately. A few more favored slowing the purchases at midyear, with the program ending later in 2013. Several others thought that if labor conditions improved as expected, the Fed could slow purchases "later in the year and stop them by year-end." Two members indicated that the purchases might well continue at the current pace at least through the end of the year. The Fed released the minutes early after discovering that some copies had been sent by mistake to Hill staffers and trade groups on Tuesday. This basically means that the printing press may end so why did the market rally, a last hurrah, maybe!!
Friday, April 5, 2013 3:00 p.m est.
Yesterday the market rallied a bit in preparation for todays' big employment report. When it came in way worse than expected the market sold off with the Dow seeing lows of -170.00 points, S&P 500 -21.00 points and the Nasdaq -60.00 points. Of course this confirms that the Fed isn’t going to stop the printing presses anytime soon so the market came back It did come back a bit at the close with the Dow only down by -41.00 points to 14,565.00, S&P 500 -7.00 points to about 1553.00, S&P 100 -3.00 points to 700.00 and the Nasdaq Composite -21.00 points to about 3203.00. Oil closed down pretty hard -$.50 remaining around the $93.00 level.
The economy generated just +88,000 jobs in March, the smallest gain in 10 months and more people dropped out of the labor force, adding to more evidence that the pace of hiring has slowed. The unemployment rate fell a tick to 7.6% from 7.7%, the lowest rate since December 2007, but the decline stemmed from fewer Americans looking for work, -500,000 to be exact!!! Currently there are 32 million people out of work or according to the private survey of jobs -12%!! The participation rate, a measure of health in the labor market, slid again to 63.3%, marking the lowest level since 1979. The jobs report fell well short of forecasts with economists expecting the number of new jobs to increase by +190,000 last month and for the unemployment rate to remain unchanged at 7.7%. Employment gains for February and January, however, were both revised higher and people who do hold jobs put in more hours. The number of new jobs created in February was revised to +268,000 from +236,000, while January's figure was revised up to +148,000 from +119,000. The biggest increase in hiring in March occurred in professional services (51,000) and health care (23,000). Retailers and government trimmed employment. Average hourly wages edged up 1 cent to $23.82, reducing the 12-month increase to 1.8%. The average workweek rose 0.1 hour to 34.6, a sign that workers are putting in more overtime.
Tuesday, March 19, 2013
The market started this new expiration cycle yesterday sharply on the downside with Globex futures off over -1% Sunday night as Cyprus was talking about going into peoples banking accounts to collect a one off tax to help pay for their errors instead of going the way of austerity and cutting back. Of course after the open it came back midday to cut those losses as investors took that “we’re different” attitude so it only closed down a little. Today it started higher with the Dow seeing +70.00 points, S&P 500 +6.00 points and the Nasdaq +20.00 points but as the vote approached for the Cyprus government to decide and it seemed the same may come into effect for New Zealand as they announced a similar action it started to sell off. The Dow saw lows of -80.00 points, S&P 500 -14.00 points and the Nasdaq Composite -30.00 points. Of course once again the market came back to close mixed. At the close the Dow was up by +4.00 points to 14,456.00, S&P 500 -4.00 points to about 1548.00, S&P 100 -1.00 points to 697.00 and the Nasdaq Composite -9.00 points to about 3229.00. Oil closed down -$1.50 remaining around the $93.00 level.
What is interesting about this is that there have been reports out about how bad retirement is looking for over half of America so how would people here feel if they lost a portion of their money to a special tax.
The percentage of workers confident about having enough money for a comfortable retirement is essentially unchanged from the record lows observed in 2011. While half express some level of confidence,13% are very confident and 38% are somewhat confident, 28% are not at all confident up from 23% in 2012 but statistically equivalent to 27% in 2011, and 21% are not too confident.
Retiree confidence in having a financially secure retirement is also unchanged, with only 18% very confident and 14% percent not at all confident. Debt is one of the reasons as 55% of workers and 39% of retirees report having a problem with their level of debt, and only half 50% of workers and 52% of retirees say they could definitely come up with $2,000 if an unexpected need arose within the next month which is very bad!! In particular, increases are seen in the percentage of workers not at all confident about their ability to pay for basic expenses 16%, up from 12% in 2011.
Americans are living longer and because of this they do not have anywhere near enough saved for retirement. The sad truth is, people do almost no thinking about what kind of retirement they want. They mistakenly assume that Social Security is a retirement program, when in fact it is a supplemental retirement program. The three legs of the retirement "stool”, Social Security, a pension, and private savings have all seen some shrinkage in the past few years. For Social Security, all baby boomers know the truth that they are going to be working longer, into their 70s, paying more and getting less. Why, pensions are going away, for example IBM stopped providing pensions to new employees a couple years ago along with a multitude of companies, and many are facing reductions in their benefits.
And private savings, the EBRI survey said that 57% report having less than $25,000 in household savings and investments (excluding their home and pension benefits). This is for all workers, so older workers would have more money, but other surveys show the results are equally paltry. The percentage reporting saving anything for retirement is at 66%, down from 75% in 2009. People are also living much longer than their parents: A male reaching retirement age in 2013 is expected to live to an average of 85, a woman to 87. What this means is this, there is a retirement crisis looming! In a little more than a decade, there will be a lot of older people who will run out of money. There will be stories written in the year 2025 about Joe Smith, 82, a retired auto worker, living in a flophouse on $2,100 a month in Social Security after his pension was cut off and his personal savings ran out!!
Construction on New Homes nudged up in February with modest gains for single-family residences and apartments, as longer-term trends signaled a housing market that continued to strengthen. Construction on new homes rose +0.8% in February to a seasonally adjusted annual rate of 917,000, the highest level since December. Economists had expected construction starts in February to rise to a rate of 913,000 from an original January estimate of 890,000. Starts for single-family homes rose +0.5% in February to a rate of 618,000, the highest level since June 2008. Meanwhile, starts for structures with at least five units increased +0.7% to a rate of 285,000, the highest level since December.
Wednesday, March 13, 2013 3:00 p.m est.
The market started the day a bit lower but as it went by it inched higher with the Dow closing at another all time high, up 9 days in a now which hasn’t been done in 17-years. The Dow saw highs of +25.00 points, S&P 500 +4.00 points and the Nasdaq +10.00 points. At the close the Dow was up by +5.00 points to 14,455.00, S&P 500 +2.00 points to about 1554.00, S&P 100 +.30 points to 699.00 and the Nasdaq Composite +3.00 points to about 3245.00. The biggest problem is that these moves are on weaker and weaker volume which indicates a sharp move lower could start at anytime! Oil closed up +$.20 remaining around the $92.50 level.
As the market continues to climb on less and less volume,,,, leverage, as measured by margin Debt, rose a huge +31.6% year-on-year and +10.2% month-over-month to $364 billion in January, compared to the July 2007 peak of $381 billion. Net Free Credits at -$77.2mm (essentially cash balances in margin accounts) have plunged to levels (and at a rate) that generates a sell signal and typically result in market correction. The last time a (2-standard-deviation) sell signal like this was generated was on April 2010 and the S&P 500 subsequently corrected by -16% in two months. While the market has not responded to at or near overbought or contrarian bearish sentiment levels very recently remaining overbought for weeks there was a sell signal triggered that is similar to those from September 14th and April 27th, 2012 which both preceded market pullbacks.
Retail sales posted the biggest increase in February in five months, but about half the increase took place at gas stations and reflected higher prices at the pump. Sales rose a seasonally adjusted +1.1% last month, or by +1.0% excluding the auto sector, the Commerce Department said. Economists expected retail sales to jump +0.7% for both the overall number and minus autos. Sales rose a smaller +0.6% excluding gas stations and -0.4% minus autos and gas. xRetail sales are a good proxy for how fast the U.S is growing and the latest data suggests consumer spending is fairly steady. In the past 12 months, retail sales are up +4.6%, slightly more than double the rate of consumer inflation. Last month, sales surged at auto dealers, gas stations, building-material stores and Internet retailers. Gas-station sales shot up +5%, the biggest increase since oil prices spiked last August. Sales also rose slightly for stores that sell clothes and general merchandise. Sales fell at department stores and shops that sell home furnishings, electronics, and sporting and hobby items. Bar and restaurant sales also declined. In January, the increase in retail sales was revised up a tick to +0.2%. December sales were unchanged at a +0.5% gain.
Tuesday, March 12, 2013 3:00 p.m est.
Yesterday the market closed at another yearly high and today the Dow made another all time high closing higher for the 8th day in a row. The Dow saw highs of +35.00 points, S&P 500 +2.00 points and the Nasdaq +5.00 points. Selling took hold though and the Dow saw lows of -40.00 points, S&P 500 -8.00 points and the Nasdaq -10.00 points but it bounced back right at the close to finish in positive territory. At the close the Dow was up by +3.00 points to 14,450.00, S&P 500 -4.00 points to about 1552.00, S&P 100 -3.00 points to 698.00 and the Nasdaq Composite -10.00 points to about 3242.00. Oil closed up +$.50 remaining around the $92.50 level.
This is the final week of this expiration cycle and is generally a volatile one but so far it has been quiet. The market is incredibly overbought right now and is so far above the 200-day moving average by +9% it has always marked tops in the past. That means the market needs to consolidate and always has in the past so we’ll see if this time is different just like how the market is being artificially held up by the Fed!!
Friday, March 8, 2013 3:00 p.m est.
The market has remained higher all week being up +2% for the week. It was up again this morning as economic data about employment was pretty good. The Dow saw highs of +90.00 points, S&P 500 +9.00 points and the Nasdaq +20.00 points but going into the final hour was pulling back a bit. At the close yesterday the Dow was up by +33.00 points to 14,330.00, S&P 500 +3.00 points to about 1544.00, S&P 100 +2.00 points to 696.00 and the Nasdaq Composite +10.00 points to about 3232.00. Oil closed up +$1.10 remaining around the $92.00 level.
There were +236,000 jobs created in February and the unemployment rate fell to 7.7% from 7.9%, marking the lowest level since December 2008, in another sign that hiring and economic growth are gaining momentum or you could look at the fine print and see that more people fell off the board once again. The job gains were the highest since November and were broad based, led by professional services (73,000), construction (48,000), health care (32,000) and retail (24,000). Economists expected the number of new jobs to increase by +160,000 and for the unemployment rate to remain unchanged at 7.9%. Employment gains for January were revised lower but December hiring was revised up, resulting in little change overall. The number of new jobs created in January was revised to +119,000 from +157,000, while December's figure was revised up to +219,000 from +196,000. The economy has added an average of +191,000 jobs over the past three months. In February, the average workweek rose +0.1 hour to 34.5, while average hourly earnings climbed +4 cents, or +0.2%, to $23.82. Hourly wages have risen +2.1% over the past 12 months. All the hiring in February took place in the private sector. Business added +246,000 jobs while government positions were cut by -10,000.
Tuesday, March 5, 2013 4:03 p.m est.
Well the Dow finally made its new high of the year with a rally and the Dow seeing highs of +160.00 points, S&P 500 +17.00 points and the Nasdaq +45.00 points. At the close the Dow was up by +126.00 points to 14,254.00, S&P 500 +15.00 points to about 1540.00, S&P 100 +7.00 points to 693.00 and the Nasdaq Composite +42.00 points to about 3224.00. Oil closed up +$.70 remaining around the $91.00 level.
It took more than five years, but the Dow finally closed at a record high today after hitting a new intraday high just after the open. This is all wonderful and nice but there is still that concern that once the Fed starts to rein in its extraordinary stimulus programs, which have coincided with the +118% rally off the March 2009 lows, stocks will lose their most important support. Even a correction of -5% to 10% variety based on market averages could keep the rally going but if we go up much more I think were moving into crash territory! An interesting aspect of all of this is the new record high coincides with household net worth exceeding what it was before the financial crisis. Third-quarter data showed that household net worth grew $1.72 trillion, or +2.7%, to $64.8 trillion, +1.5% below its 2007 peak of $65.8 trillion.
Monday, March 4, 2013 4:03 p.m est.
Interesting day in the market as it started the day on the downside with the Dow seeing lows of -80.00 points, S&P 500 -6.00 points and the Nasdaq -15.00 points but after looking like it was going to fall off the cliff, a buy program came in and took it up with the Dow seeing highs right at the end of the day. At the close the Dow was up by +38.00 points to 14,128.00, S&P 500 +7.00 points to about 1525.00, S&P 100 +3.00 points to 687.00 and the Nasdaq Composite +12.00 points to about 3182.00. Oil closed down again -$.60 remaining around the $90.00 level.
This is all so interesting as the market is over margined, over leveraged, over bloated, euphoric and being held hostage by the Dow making new highs. According to Art Cashin everyone on NYSE floor has already stocked up on silly hats and noisemakers to celebrate. The market is entering its fifth year this month after the S&P 500 surged +124% from a 12-year low in 2009 amid better-than-expected corporate earnings and money pumping from the Fed. The S&P 500 has climbed +6.9% this year and is trading at about +3% below its record of 1,565.15 reached in October 2007. The Dow is less than +0.5% from its high of 14,164.53.
Friday, March 1, 2013 4:03 p.m est.
The market started the day on the downside continuing yesterday’s sell off with the Dow seeing quick lows of -150.00 points, S&P 500 -14.00 points and the Nasdaq -30.00 points but after President Obama came out and told everyone that everything would be okay it bounced back with the Dow seeing highs of +60.00 points, S&P 500 +6.00 points and the Nasdaq Composite +15.00 points midday. At the close the Dow was up by +35.00 points to 14,090.00, S&P 500 +4.00 points to about 1518.00, S&P 100 +1.10 points to 684.00 and the Nasdaq Composite +10.00 points to about 3170.00. Oil closed down -$1.40 remaining around the $91.00 level. This could turn out to be an interesting weekend as most of Congress has gone away for a three day weekend. I mean really what’s a few billion dollars here and there, who needs to talk about figuring out a budget!! This is all making for an interesting week ahead!! Interesting note is that Insider selling to buying is 50-1 which has never been seen before so things can't be that great inside companies. I think the biggest reason the market is holding up is this over margined, over leveraged, over bloated, euphoric market is being held hostage by the Dow making new highs because its within points of a new high. Lets hope it hits it on Monday just to get it over with!!
Consumer spending in the rose in January for the third straight month, suggesting that a payroll tax increase on American workers at the start of the year has not affected their buying patterns all that much. Spending climbed +0.2% last month on a seasonally adjusted basis. That was slightly higher compared to a downwardly revised +0.1% increase in December. Personal income, meanwhile, fell -3.6% to mark the sharpest drop in 20 years. Economists had forecast a +0.2% rise in spending but a -2.6% drop in personal income. Incomes surged a revised +2.6% in December as companies accelerated bonuses and dividend payments ahead of a tax increase in January, but that led to the sharp decline in earnings last month. Since incomes fell so much, the personal savings rate skidded to 2.4% in January from 6.4% in December. The level of savings in January was the lowest in six years while the increase in savings in December was the largest in four years. Also, inflation as gauged by the core PCE price index edged up +0.1%. The closely followed core rate has risen just +1.3% in the past 12 months, down a tick from December.
The Institute for Supply Management's manufacturing index accelerated in February, climbing to a reading of 54.2% from 53.1% in January. That came in ahead of consensus of 52.5% and represents the third straight expansion. The new orders component was particularly strong, climbing to 57.8% from January's 53.3%.
The University of Michigan-Thomson Reuters consumer-sentiment gauge rose to a final February reading of 77.6%, the highest level since November, from a final January reading of 73.8%. Economists had expected a final February reading of 76.4%, compared with a preliminary estimate for the month of 76.3%. Conflicting forces worked on consumers in February: gasoline prices increased, but claims for jobless benefits fell. Additionally, higher payroll taxes kicked in this year and consumers face ongoing uncertainty about how massive federal spending cuts will impact their personal finances. The sentiment gauge, which covers how consumers view their personal finances as well as business and buying conditions, averaged about 87% in the year before the start of the most recent recession. Economists watch sentiment data to get a feel for the direction of consumer spending
Thursday, February 28, 2013 4:03 p.m est.
JP Morgan to cut -17,000 jobs. According to The Wall Street Journal: "J.P. Morgan the U.S.'s most profitable bank in 2012 and the nation's biggest lender by assets, set plans to cut -17,000 jobs over two years amid rising pressure in the banking industry to slash costs amid stagnant revenue. The New York company said at an investor day presentation at its midtown Manhattan headquarters that it would reduce its global staff by -4,000 jobs this year and -13,000 next, primarily in the consumer bank and the unit that handles home loans. J.P. Morgan employed 258,965 people at year-end."
The market rallied yesterday making up all the losses it had made earlier in the week and today it was higher with the Dow seeing highs of +80.00 points, S&P 500 +10.00 points and the Nasdaq Composite +20.00 points. Right at the close the market sold off though as the S&P 500 and Russell 2000 went through a rebalance of their indices to close right near lows. At the close the Dow was down by -21.00 points to 14,055.00, S&P 500 -2.00 points to about 1515.00, S&P 100 -.30 points to 684.00 and the Nasdaq Composite -2.00 points to about 3160.00. Oil closed down -$.93 remaining around the $92.00 level.
As we now move into March, generally a volatile month for the market, technically the market is overbought and fundamentally, the picture is even worse. It is facing a litany of economic drags, including weakening GDP growth, higher taxes, the impact of Obamacare, sequester cuts, high gas prices, chronic unemployment, etc, and robust insider selling. As we move along there is more of a chance of it falling then getting over previous 2000, 2007 highs! Right now the Fed has kept things magically elevated, and they’ve done a very good job so far but I don’t think they can do this for much longer without a serious correction to justify an even larger program of intervention. The downdraft should see lots of volatility, with many Fed-inspired rescues, alternating until some form of bottom is reached. Along the way there will likely be a flight for "safety" into the dollar and bonds. It will be a welcome change as this market is hanging onto threads every day...
The economy grew in the final three months of 2012, but just barely, instead of shrinking for the first time since the end of the recession as originally reported. The nation’s entire output of goods and services, known as gross domestic product, expanded at an annual +0.1% pace in the fourth quarter. Initially the government said the economy contracted by -0.1%, which would have marked the first decline since the second quarter of 2009. GDP reflects the value of all the goods and services produced in the U.S., from haircuts to software design to road construction. It’s the broadest measure of the economy’s health.
Jobless Claims dropped -22,000 to 344,000. Economists had expected an initial-claims level of 362,000 for the most recent weekly data. The government revised claims for last week to 366,000 from a prior estimate of 362,000. The average of new claims over the past month, which smooths out weekly volatility, fell -6,750 to 355,000. Continuing claims dropped -91,000 to 3.07 million in the week ended February 16th, hitting the lowest level since June 2008. The four-week average of these continuing claims fell -35,500 to 3.16 million, the lowest level since July 2008. Continuing claims reflect the number of people already receiving benefits.
Yesterday it was reported that Orders for big-ticket goods fell -5.2% in January because of sharp declines in bookings for commercial and defense aircraft, but orders minus the volatile transportation sector rose for the fifth straight month. Economists had expected orders to drop -5.0%. Stripping out the transportation sector, orders climbed +1.9%, the fastest rate in more than a year. Orders for machinery were particularly strong, climbing +13.5%, but demand for autos was flat and bookings for computers fell. Orders for core capital goods, a key barometer of private-sector business investment, jumped +6.3% to mark the largest rise in more than two years. Yet shipments of core capital goods, a category used to calculate quarterly economic growth, dipped -1.0% in January.
As affordability continued to attract buyers, pending home sales rose +4.5% in January to the highest level since April 2010, when buyers rushed to make a tax-credit deadline, the National Association of Realtors. The pending-home-sales index increased to 105.9 in January from 101.3 in December. An index reading of 100 equals the average level of contract activity during 2001, the first year of data. January's reading was up +9.5% from the same period in the prior year, the 21st consecutive year-over-year gain. By region, January saw pending-home-sale gains of +8.2% in the Northeast, +5.9% in the South, +4.5% in the Midwest, and +0.1% in the West. A sale is listed as pending when the contract has been signed but the transaction has not closed. Typically, sales are finalized within two months of signing. Higher pending home sales signal that actual home sales are likely to rise in coming months. January's gain followed two months of declines.
Tuesday, February 26, 2013 4:03 p.m est.
The market bounced today as Fed chief Ben Bernanke testified confirming that the Fed would keep the printing presses going for the foreseeable future! The Dow saw highs of +130.00 points, S&P 500 +12.00 points and the Nasdaq Composite +20.00 points. All of the gains were almost wiped out during the question and answer period however but Bernanke was able to skate around some of the questions so the market bounced back.
At the close the Dow was up by +116.00 points to 13,900.00, S&P 500 +14.00 points to about 1497.00, S&P 100 +4.00 points to 676.00 and the Nasdaq Composite +13.00 points to about 3130.00. Oil closed down -$.40 remaining around the $92.72 level.
One thing that’s interesting is that there is a report out that Bernanke is about to tell investors that policy will reverse. According to Reuters: "Federal Reserve Chairman Ben Bernanke is preparing for a most sensitive task: telling jittery investors who have grown accustomed to the U.S. central bank's ultra-easy monetary policies that things will eventually have to change." The report added: "Bernanke appears committed to the Fed's bond-buying stimulus right now. But the unprecedented communications challenge of laying groundwork for a shift in policy, while still assuring investors that rates will continue to stay low, could come in just a few months if the U.S. recovery continues apace."
Since this has been a momentum market with the hopes of the printing presses continuing forever no one wants to call a top in the market but if the report is true, this could be it for awhile. The bears have had their case as poor economic data has been coming out on a fairly regular basis of late, and the general background of things is pretty negative still. The problem has been the easy money being the big factor that is increasing stock prices so eventually, the bears will be right.
In case anyone is keeping score, both the U.S. and the Eurozone have now delivered GDP figures that show that the bulk of the Northern Hemisphere's economy is shrinking. The latest GDP from the Eurozone shows a -0.8% decline in GDP for the fourth quarter 2012 and U.S. fourth quarter GDP shrunk at an annualized rate of -0.1%. The Eurozone's lack of economic activity has now begun to affect Germany, who's GDP shrunk by -0.6% in the fourth quarter. France fell -1.1%. But it was much worse elsewhere. Italy's GDP shrunk nearly -4% at a -3.7% annualized rate and Portugal's economy is in freefall at a -7.2% decline rate. Greece in comparison shrunk at a -6% rate, deepening its own depression. According to the report, Greece now has a 27% unemployment rate, a new record. According to the Wall Street Journal, a combination of high unemployment and austerity are combining to make the situation there worse. The consensus view is that Germany will rebound quickly, based on increased exports to Asia. The rest of the region, though, seems to be in big trouble with no solution in sight. What this all means is that easy money will continue to flood the markets and until that stops it will be hard for the market to fall too far before being bought up again!!
Home prices rose in December, and saw the largest year-over-year gain since 2006, according to the S&P/Case-Shiller home-price index. The S&P/Case-Shiller 20-city composite posted a non-seasonally adjusted +0.2% increase in December, following a -0.1% decline in November. After seasonal adjustment, home prices rose +0.9% in December. "Home prices ended 2012 with solid gains," said David Blitzer, index committee chairman at S&P Dow Jones Indices. Looking at longer-term trends, December's prices were up +6.8% from the same period in the prior year, the largest annual gain since July 2006, with increases in 19 of 20 cities. New York was the only city with a year-over-year decrease, falling -0.5%. Low inventories and increasing demand have supported prices over the past year. Despite housing-market gains, prices remain about 29% below a bubble peak in 2006, according to Case-Shiller data.
Sales of New Homes jumped +15.6% in January to an annual rate of 437,000 to mark the highest pace of activity since July 2008. The rate of sales in January easily surpassed the 384,000 estimate of economists. What's more, December sales were revised up to 378,000 from an initial read of 369,000. The numbers are seasonally adjusted. The median price of new homes, however, fell more than -9% to $226,400 in January from $249,800, indicating that buyers flocked to less expensive properties. Sales rose the fastest in the West, up +45.3%, and they also climbed +27.6% in the Northeast. Sales might have benefited in the Northeast from unseasonably warm winter weather that persisted from December into early January. The supply of new homes available for purchase fell to 4.1 months at the current sales rate from 4.8 months in December, the lowest level since early 2005. New home sales are almost 29% higher compared to one year ago.
A gauge of consumer confidence jumped up in February, led by brighter expectations, after dropping in the prior month. The Conference Board said its consumer-confidence index rose to 69.6% in February, the highest level in three months, far exceeding analysts' estimates of 62.3%. January's level was revised to 58.4% from a prior estimate of 58.6%. The confidence gauge plunged last month on consumers' concerns over higher payroll taxes and fiscal uncertainty. Confidence remains relatively low, generally when the economy is growing at a good clip, levels are at least 90%. The Conference Board's barometer of consumers' expectations rose to 73.8% in February from 59.9% in January. Meanwhile, the gauge of views on the present situation rose to 63.3% from 56.2%.
Monday, February 25, 2013.
The market sold off strongly today on news that the Italian election wasn’t going as well as expected but I think it had more to do with all of the sequestration drama kicking in. On March 1st $85 billion in spending cuts is kicking in if a budget deal between Republicans and Democrats is not reached. Nonetheless this sell off today may influence Bernanke's policy statements tomorrow increasing the odds he'll take back the Fed’s minutes comments and reiterate an easy money policy into the foreseeable future. It will be interesting to see how the market reacts tomorrow.
The market basically closed at its lows which likely means we see further pressure at least at the start of the day. At the close the Dow was down by -216.00 points to 13,784.00, S&P 500 -28.00 points to about 1488.00, S&P 100 -12.00 points to 672.00 and the Nasdaq Composite -46.00 points to about 3116.00. Oil closed down -$1.20 remaining around the $92.00 level.
This upcoming week is the last trading week of February, and before you know it, we'll be into March and facing a lot of events that could drive the market one way or the other. As I mentioned above, on March 1st, $85 billion in spending cuts will kick in if a budget deal between Republicans and Democrats is not reached. The financial sector could be impacted by the release of government stress tests on March 7th and the approval or disapproval of capitalization plans submitted by individual banks on March 14th. The big one is the Fed meets on March 19-20th. Finally once again at the end of March, a government shutdown looms, unless the debt ceiling is raised.
Wednesday, February 20, 2013.
Sooo, the market does correct after all!! It started the day on the downside but it appeared that once again it was going to come back midday as it held its ground but after minutes from the Fed’s last meeting illustrated differing views over continued stimulus, or I like to say free money for banks, it started to sell off and finished the day at its lows. Minutes from the Fed’s Open Market Committee’s January meeting released at 2:15 est, had some Fed members expressing concern about the $85 billion a month in asset purchases and that they may start to “vary” how much they do. They said that they will review it again at their March 19-20th meeting. Interesting, a week after expiration which means we could see the market correct until this meeting which in the end would be healthy!! At the least we may see some volatility start to appear!!
At the close the Dow was down by -109.00 points to 13,927.00, S&P 500 -19.00 points to about 1512.00, S&P 100 -7.00 points to 682.00 and the Nasdaq Composite -49.00 points to about 3164.00. Oil closed down -$2.24 remaining around the $95.00 level a place where a lot of free money ended up.
Led lower by apartments, construction on New Homes fell -8.5% in January to a seasonally adjusted annual rate of 890,000. Economists had expected January's starts to decline to a rate of 914,000 from an original December estimate of 954,000, on lower apartment construction. The government revised December's starts rate to 973,000. Looking at less volatile longer-term trends, starts are up +24% from the same period in the prior year, but remain below a bubble peak of almost 2.3 million in 2006. Starts for structures with at least two units fell -24% in January to a rate of 277,000. Meanwhile, starts for single-family homes were up +0.8% to a rate of 613,000, the highest rate since July 2008. Building permits, a sign of future demand, rose +1.8% in January to a rate of 925,000 -- the highest rate since June 2008. Permits for single-family homes rose +1.9% to a rate of 584,000, while permits for structures with at least two units increased +1.5% to a rate of 341,000.
Wholesale prices rose a seasonally adjusted +0.2% in January, marking the first increase after three straight drops, mainly because of a spike in vegetable prices. Excluding the volatile categories of food and energy, so-called core producer prices also rose 0.2%, the Labor Department. Economists had predicted a +0.4% increase in the overall producer price index and a +0.2% rise in core PPI. Food costs jumped +0.7% last month, led by a +39% advance in vegetable prices. Higher food prices accounted for more than three-quarters of the increase in PPI. Energy prices fell a seasonally adjusted -0.4%, though the data failed to capture the recent surge in gasoline costs. Those increases are expected to show up in the February report. Over the past 12 months wholesale prices have risen an unadjusted +1.4%. The core rate has risen +1.8% in that span, down from +2.0% in December. That's the lowest level since the first month of 2011.
Tuesday, February 19, 2013 4:03 p.m est.
The market was higher once again to start the week although on very weak volume and it moved at a snails pace higher. The Dow saw highs of +80.00 points, S&P 500 +12.00 points and the Nasdaq +25.00 points. At the close the Dow was up by +54.00 points to 14,036.00, S&P 500 +11.00 points to about 1531.00, S&P 100 +5.00 points to 689.00 and the Nasdaq Composite +22.00 points to about 3213.00. Oil closed up +$.63 remaining around the $97.00 level.
As the market continues to rise towards its all time highs on the free money printing presses of the Fed, some things are starting to reveal that things aren’t so rosy in the real economy. The Walmart story on Friday about sales “disasters” is bad and if we start to see some other economic slowdowns even the Fed may not be able to save the day. One big thing that is coming up that could affect the economy this summer is all of the Presidents new rules on health care. Here’s an example I read about this morning.
Lets say Mr. Smith has two children and a wife who stays at home because one of the children is disabled. Mr. Smith, by law, will have to spend at least $20,000 on health insurance for his family. The government has made it clear that it will subsidize the worker's costs, but not the family's cost. If Mr. Smith were to qualify for this government subsidy, he would still have to pay $15,000 from his only $55,000 per year salary. If Mr. Smith is like others in similar places, Mr. Smith has already taken a hit since his payroll taxes went up in January of 2013.
What this means is that Mr. Smith may not have enough disposable income to feed his family, pay his rent and his other bills, and even have health insurance. So Mr. Smith will have to make decisions: food, shelter, or health insurance? It's a no brainer. How many Mr. Smiths are there out there? 70 million? 100 million? The hit to the economy will be staggering. In other words, the health care system is already teetering because of the fact that it's too expensive to maintain at current levels. The sequester will likely weaken it further making it much easier for the implementation of the ill conceived Obamacare to topple it.
For now, momentum rules. But, don't get too comfortable. There is trouble that lies ahead. The flip side is that none of the above listed things really matter as long as the money printing presses are on steroids. And the way things look, they could be printing the stuff for a long time to come.
A gauge of confidence among homebuilders declined in February, the first weakening since April, due, in part, to ongoing headwinds from economic uncertainty and strict lending standards, according to the National Association of Home Builders/Wells Fargo Housing Market Index. The index ticked down to 46% in February from 47% in January. Analysts had expected a February result of 48%. The index has barely moved in recent months after substantial gains in much of 2012. To explain the recent pause in confidence gains, NAHB also cited rising materials costs and limited labor availability in certain markets. In February there were declines in builder-confidence components focusing on present sales of single-family homes and prospective-buyer traffic. Meanwhile, sales expectations slightly gained. Despite February's decline, sentiment is up 64% from a year earlier, with builders encouraged by a strengthening housing market that is benefitting from persistently low interest rates and pent-up demand. However, the builders' sentiment index remains below a key reading of 50%, the point at which more builders see sales conditions as good than poor.
Friday, February 15, 2013 4:03 p.m est.
Overnight it was reported that Japan had Gross Domestic Product, GDP of -0.1%, France GDP -0.3% and Germany GDP -0.6%, worst since the start of the crisis. All of there markets are down about -2% for the month. American GDP was also reported down last month but is the only market in the world that is up for the month! Why is that, Fed pumping!! The main point is where is the recovery ? All that printing and GDP’s around the world keep contracting. The American market is higher because the Fed is the biggest supplier of cash for banks to make stock purchases! When will it end who knows but it can’t go on forever. It makes you wonder how well its working anyhow when you start to hear from huge retailers such as Walmart saying sales are poor and is a huge problem. They said the reason was because of tax increases that occurred at the start of the year. "February monthly sales are a "total disaster," wrote a Wal-Mart vice president in an internal email to executives, according to a report from Bloomberg, driven by payroll-tax increases that hit consumers." The scary thing about that is it is the middle class that shop there and Walmart is a great guide to measuring the overall economic condition of the countries, thus the reason for the market reaction. Next week could be very interesting!!
The market started expiration today on the upside with the Dow seeing +40.00 points, S&P 500 +4.00 points and the Nasdaq +10.00 points. Midday when an e-mail was leaked from Walmart that their retail sales in a February were a “disaster” the market sold off with the Dow seeing lows of -70.00 points, S&P 500 -7.00 points and the Nasdaq Composite -20.00 points before coming back in the final hour to finish the February expiration cycle mixed. At the close the Dow was up by +8.00 points to 13,981.00, S&P 500 -2.00 points to about 1520.00, S&P 100 -1.00 points to 684.00 and the Nasdaq Composite -7.00 points to about 3192.00. Oil closed down -$.90 remaining around the $97.00 level.
The Empire State manufacturing index moved into positive territory for the first time since July, the New York Fed said. The index rose to +10% in February from a negative -7.8% in the prior month. Economists expected the index to stay lower in negative -2% in February. Details of the report were mainly positive. The key new orders sub-index jumped to +13.3% from negative -7.2% and shipments also rose sharply. Labor market conditions were mixed. An index of expectations of activity six months ahead rose to its highest level since April.
Industrial production slipped in January on declines in manufacturing and mining output, after the Fed found the final two months of last year were stronger than initially estimated. Industrial production slipped -0.1% in January, the Fed said, after gains of +1.4% in November and +0.4% in December. The Fed had initially estimated gains of +1% in November and +0.3% in December. Economists had forecast a +0.2% pick-up in January output. Capacity utilization also fell in January, to 79.1% from an upwardly revised 79.3% in December.
Wednesday, February 13, 2013 4:03 p.m est.
Interesting: According to The Wall Street Journal: "The U.S. government spent about $2.2 billion last year to provide phones to low-income Americans, but a Wall Street Journal review of the program shows that a large number of those who received the phones haven't proved they are eligible to receive them." According to The Journal: "Suspecting that many of the new subscribers were ineligible, the Federal Communications Commission tightened the rules last year and required carriers to verify that existing subscribers were eligible. The agency estimated 15% of users would be weeded out, but far more were dropped. A review of five top recipients of Lifeline support conducted by the FCC for the Journal showed that 41% of their more than six million subscribers either couldn't demonstrate their eligibility or didn't respond to requests for certification." "Americans pay an average of $2.50 a month per household to fund a number of subsidized communications programs, including Lifeline."
The market started the day making new highs for this rally with the Dow seeing +15.00 points, S&P 500 +6.00 points and the Nasdaq +20.00 points. The move was on weak volume however so selling seemed to take hold pretty easily. The Dow saw lows -80.00 points, S&P 500 -4.00 points and the Nasdaq Composite -1.00 point before coming back in the final hour with the Dow down by -36.00 points to 13,983.00, S&P 500 +.90 points to about 1520.00, S&P 100 -.20 points to 683.00 and the Nasdaq Composite +10.00 points to about 3197.00. Oil closed down -$.50 remaining around the $97.00 level.
Retail sales barely grew in January, suggesting a tax increase at the beginning of the year constrained consumers. Sales rose a seasonally adjusted +0.1% last month, or by +0.2% excluding the auto sector. Economists expected retail sales to be unchanged overall and up +0.1% minus autos. The auto sector accounts for about one-fifth of total sales and can obscure broader trends in the retail segment. Last month, sales rose at Internet retailers, department stores and general-merchandise outlets. Receipts were lower for auto dealers, drug stores, and companies that sell home furnishings and clothing. Retail sales are a good proxy for how fast the country is growing, though economists look at longer-term trends because the monthly data is volatile and subject to sharp revisions. The increase in sales for December was unrevised at +0.5%, while sales in November were revised up a notch to a +0.5% gain. In all of 2012 retail sales climbed +4.4%, more than twice the rate of consumer inflation.
Monday, February 11, 2013 4:03 p.m est.
Tax hikes are biting. According to The Wall Street Journal: "Most Americans who draw a paycheck saw their tax bill go up last month when a payroll-tax holiday expired. The question is whether that is prompting consumers to curb spending, just as the economy is struggling to gain traction. Some early signs suggest they are tapping the brakes. Surveys show the majority of Americans who are aware of the tax increase say they plan to cut spending, and consumer confidence has wavered. Companies like Target Corp. TGT -0.62% and women's clothier Cato Corp. say the tax increase has crimped sales."
Well the market started the final week of this expiration cycle on the downside although it did come back at the close off of lows on the Dow of -60.00 points, S&P 500 -5.00 points and the Nasdaq Composite -15.00 points. At the close the Dow was down by -22.00 points to 13,971.00, S&P 500 -1.00 points to about 1517.00, S&P 100 -.30 points to 683.00 and the Nasdaq Composite -2.00 points to about 3192.00. Oil closed up +$1.20 remaining around the $97.00 level.
This is going to be an interesting week as the market remains quite overbought, has been up six weeks in a row now, the market also has problems with the major points on the indexes such as 1500 on the S&P 500, Dow 14,000 and the small stocks, Russell 2000 900 level. One big factor is that many people are saying that there is too much bearishness and that means the market will continue higher. The problem with that is that right now the percentage of bulls and bears, according to the weekly sentiment survey by Investors Intelligence indicates otherwise. When the number of bulls is far higher than the number of bears, it's an indication of a lot of optimism in the market which could have some bearish implications for the market going forward. That was certainly the case looking back at 2011 and 2012. After six weeks into 2011, the bulls-minus-bears was very near 40%. The market went sideways after that, before eventually collapsing later in the year and giving back all its gains. Then, in 2012, the market was once again off to a great start, but this time the bulls-minus-bears was much less, right around 20% but still corrected. Currently, the optimism, according to this poll, is the near the 2011 level where it fell -5.4% after the first six weeks. It will be interesting to see if we repeat once again.
Thursday, February 7, 2013 4:03 p.m est.
The market really started to sell off today as the market is overbought and worries about the financial system in Europe took hold with the Dow seeing lows of -120.00 points, S&P 500 -12.00 points and the Nasdaq Composite -30.00 points. After hitting lows it slowly crept back on thinner and thinner volume to cut losses significantly by the close. The Dow finished down by -42.00 points to 13,944.00, S&P 500 -3.00 points to about 1509.00, S&P 100 -1.30 points to 680.00 and the Nasdaq Composite -3.00 points to about 3165.00. Oil closed down -$1.00 remaining around the $96.00 level.
There was a new trade put on by someone and it suggests there will be a market event in the near future. Last week somebody put on a call spread on the VIX, (volatility index). They bought 150,000 contracts for a net of $75 per contract and is an $11,250,000 bet that the VIX will move over 20 over the next 60 days. You would have to be VERY confident in your outlook to risk $11 million on a directional position with the VIX at five year lows and the markets trying to break out to new highs!
It was reported this morning that Productivity fell -2.0% in the fourth quarter, as workers put in more hours but the production of goods and services barely changed. Economists forecast productivity to drop -1.5%. For all of 2012, productivity rose an estimated +1.0%, compared to a +0.7% increase in 2011 and a +3.1% gain in 2010. In the fourth quarter, output of goods and services inched up +0.1%, while hours worked climbed a sharper +2.2%. Unit-labor costs jumped +4.5%. For the full year unit-labor costs rose a much smaller +0.7%, however. Hourly pay for American workers rose +2.4% in the fourth quarter, but adjusted for inflation, wages only increased +0.3%. And inflation-adjusted wages actually fell -0.4% for the full year, following a -0.5% decline in 2011. In the U.S. manufacturing sector, productivity rose +2.0% in the fourth quarter, more than offsetting a -0.9% drop in the July-to-September period. The increase in third-quarter productivity was revised up to 3.2% from 2.9%.
Jobless Claims fell by -5,000 to a seasonally adjusted 366,000. Claims from two weeks ago were revised up to 371,00 from an original reading of 368,000. Economists expected claims to drop to 360,000. The average of new claims over the past month, meanwhile, edged down by -2,250 to 350,500, marking a nearly five-year low. The four-week average reduces seasonal volatility in the weekly data. Continuing claims increased by +8,000 to a seasonally adjusted 3.22 million in the week ended January 26th. Continuing claims reflect the number of people already receiving benefits.
Tuesday, February 5, 2013 4:03 p.m est.
After the worst loss of 2013 yesterday the market bounced right back with a huge gain today with the Dow seeing highs of +140.00 points, S&P 500 +18.00 points and the Nasdaq Composite +50.00 points. The final hour saw it pull back a bit but at the close the Dow was up by +99.00 points to 13,979.00, S&P 500 +16.00 points to about 1511.00, S&P 100 +7.00 points to 681.00 and the Nasdaq Composite +40.00 points to about 3171.00. Oil closed up +$.50 remaining around the $96.00 level. It will be interesting to see if we see the market down tomorrow.
The service-sector expanded at a slightly slower pace in January but overall growth remained solid, according to the Institute for Supply Management. The ISM said its survey of purchasing managers, the executives who buy supplies for their companies - fell to 55.2% last month from 55.7% in December. Economists had expected the index to slip to 55%. Reading over 50% indicate that more companies are expanding instead of shrinking. Yet only eight of the 18 industries tracked by Tempe, Ariz.-based ISM reported growth last month, down from 13 in December. Nine reported contraction. The ISM's new-orders index fell 3.9 points to 54.4% and production dropped 4.4 points to 56.4%, but employment rose 2.2 points to 57.5%
House prices in December were +8.3% higher than a year earlier, the strongest advance since May 2006. The data also show the considerable distance to go before the housing market reaches pre-recession peaks. The December monthly price gain was +0.4%. 46 of 50 states registered gains for the year. Arizona has the strongest year-on-year appreciation at +20.2%, though prices are down -39.8% there from the peak. Nationally, prices are down -26.9% from the April 2006 peak. Pending index forecasts a -1% monthly drop in January, reflecting a seasonal winter slowdown.
Mortgage rates near record lows, a dwindling backlog of foreclosures, waning distressed-property activity and a slowly improving jobs market have all put a wind at housing’s back. Low inventories of both existing and new properties also has helped prices. That’s given a big stock-price lift to those firms who rely on the housing market, among them builders and banks. In a note to clients published Tuesday, Bank of America Merrill Lynch analyst Michelle Meyer forecasts prices (using a somewhat different house-price gauge, the S&P/Case-Shiller index) to rise about 5% this year with housing starts up another 25%.
Monday, February 4, 2013 4:03 p.m est.
Interesting: Survey says: no plans for hiring in 2013 According to CNBC.com: "While there's evidence suggesting the jobs market is slowly recovering, a large chunk of small-business owners remain pessimistic and expect the economy to remain stagnant or worsen in 2013, according to a new survey of 600 small firms. Most respondents also said they plan to trim costs, and 87 percent said they did not plan to hire additional employees."
According to the report: 'The survey was conducted by Chinese e-commerce giant Alibaba.com in December, and 63% of respondents said they expect the economy to remain unchanged or weaken further. E-commerce software companies Vendio and Auctiva also contributed to the report. "The data showed that while online merchants remain optimistic about their own growth prospects, they are skeptical about overall economic growth," said Annie Xu, general manager of Alibaba.com, Americas. Top concerns for small businesses this year not surprisingly are taxes, 70%, according to the survey, government regulation, 50% and the Affordable Care Act, also known as Obamacare or 36%.'
As I was saying the other day, because the market was up +5% last month, it has never been down for the year including the 1987 crash. However, interestingly there is another statistic that reveals the market has always been down for the year after going through huge millennial levels since it first reached the 10,000 level in 1999 and then going over the 11,12,13,000 levels. Obviously these even-level intervals can be psychological barriers for an index as they run into them, and can be viewed by the public as "expensive" or "cheap." For example, it's a lot more common to hear someone say, "the Dow will top out at 14,000," rather than, "the Dow will top out at 13,626." As it turns out, the Dow has really struggled at these 10,000 plus levels, if you look at the one-year returns. The typical one-year return for the Dow since 1999 is +3.04%. But when it just crosses one of these even levels, it averages a loss of -4.05%, showing a positive return just +36% of the time. This will be the third time the Dow has hit 14,000. The first two times were in July and October 2007 but then it pulled back. Hopefully, the third time through will hold but after today its not looking like it will be right away!
At the close the Dow was down by -130.00 points to 13,880.00, S&P 500 -18.00 points to about 1496.00, S&P 100 -8.00 points to 674.00 and the Nasdaq Composite -.48.00 points to about 3131.00. Oil closed down -$1.50 remaining around the $96.00 level.
Thursday, January 31, 2013 4:03 p.m est.
The market saw another down day to end the month closing virtually at its lows but for the month it was up +5%. Interestingly, of the other 11 times this has occurred the market has never been down for the year including the 1987 crash and sometimes the gains have been strong! This year however with poor economic data, a huge deficit, middle east problems kicking up again as Israel took out some long range missiles pointed at them in Syria and political indecision over here, making strong gains may be tough!!! Generally a good year for the market is an average of +10% so when you make 1/2 of your investing gains in the first month of the year it's more than likely smart to start taking some profits because, statistically, it is far more likely that the next 6 months will disappoint you and at the least volatility will start to kick up. That could be the case starting tomorrow as we get the all important employment report out for the month.
At the close the Dow was down by -49.00 points to 13,860.00, S&P 500 -4.00 points to about 1498.00, S&P 100 -2.00 points to 675.00 and the Nasdaq Composite -.20 points to about 3142.00. Oil closed down -$.50 remaining around the $98.00 level.
The employment cost index measuring the price of rose a mild +0.5% in the fourth quarter. That matched the forecast of economists. The ECI is a closely followed index that reflects how much companies, governments and nonprofit institutions pay their employees in wages and benefits. Wages, some 70% of employment costs rose a seasonally adjusted +0.3% in the fourth quarter and benefits were up +0.6%. Total employment costs grew at the same pace over the past 12 months for private-sector and government workers alike. For all of 2012, employments costs climbed an unadjusted +1.9%, down slightly from +2% in 2011. Wages increased an unadjusted +1.7% vs. +1.4% in 2011. Benefits posted a +2.5% gain over the past 12 months, down from +3.2% in 2011. The decline in benefits growth is evidence that the cost of health care for companies didn't increase as quickly last year.
The number of people who filed new applications for unemployment benefits climbed +38,000 to a seasonally adjusted 368,000, putting them at a one-month high, according to Labor Department data. Economists expected claims to climb to 355,000. Initial claims have returned to a level that prevailed through the later stages of 2012 after touching a five-year low earlier this month. Claims are often extremely jumpy in January after the end of the holidays and the start of a new year. Companies let go of temporary hires and some people wait until after the holidays to file claims. Initial claims from two weeks ago were unrevised at 330,000. The average of new claims over the past month, meanwhile, edged up by 250 to 352,000. The four-week average reduces seasonal volatility in the weekly data and is seen as a more accurate barometer of labor-market trends. Also, Labor said continuing claims increased by 22,000 to a seasonally adjusted 3.2 million in the week ended Jan. 19. Continuing claims reflect the number of people already receiving benefits and about 5.9 million people received some kind of state or federal benefits in the week ended January 12th, up +255,501 from the prior week. Total claims are reported with a two-week lag.
The Chicago purchasing managers index rose to 55.6% in January, to mark the best performance in nine months. Economists had expected the Chicago PMI to edge up to 49.8%. Any reading above 50 indicates expansion. Details of the report were also strong. New orders posted the biggest increase in 10 months, advancing to 58.2% from 50.4% in December. The production index jumped to 60.9%, while employment surged to 58.0% from 46.8%.
Wednesday, January 30, 2013 4:03 p.m est.
Well we must be getting close to a top in the market as CNBC now has a countdown clock going to the Dow and S&P 500’s peaks from back in 2007. The market continued higher yesterday marking another new high in this rally putting the S&P solidly over the 1500 level but today it finally pulled back acknowledging that poor economic data is bad. GDP actually contracted in the last quarter and with all of the other poor economic data out this past week it finally sunk in. The market basically closed at its lows with the Dow down by -44.00 points to 13,910.00, S&P 500 -6.00 points to about 1502.00, S&P 100 -3.00 points to 677.00 and the Nasdaq Composite -11.00 points to about 3142.00. Oil closed up again +$.50 remaining around the $98.00 level.
Growth in the economy turned negative in the fourth quarter for the first time since the last recession, dragged down by a reversal in military spending, lower inventories and falling exports. The economy contracted by a -0.1% annual rate in the final three months of 2012. Economists had forecast a +1% increase. The advance report, however, relies on some estimates and is often subject to sharp revisions. Other aspects of GDP showed more strength. Consumer spending, the main engine of the economy, rose +2.2% to eclipse the +1.6% rate in third quarter and +1.5% in the second quarter. That suggests the economy remains on a solid if unspectacular growth path. What's more, investment in residential housing, another source of strength lately, climbed +15.3%. Business spending on equipment and software also snapped back for a +12.4% gain after falling +2.6% in the third quarter. On the downside, total private-sector investment fell -0.6%, the first decline in seven quarters. Government spending fell -6.6% after a +3.9% rise in the third quarter, mainly because of a -22.2% decline in volatile defense outlays. Exports also fell faster than imports, so trade contributed to weaker GDP. Inflation as measured by the core PCE price index, which strips out food and energy, rose at an annual +0.9% rate, the lowest in three years. For the full year core PCE advanced +1.7%. That's well within the Fed’s acceptable level of inflation. The GDP report will be refined through two further updates over the next few months. For all of 2012, the U.S. grew at a +2.2% pace, compared to +1.8% in 2011 and +2.4% in 2010, considering were supposed to be in a recovery that's pathetic!!
There were +192,000 added private-sector jobs in January, ADP estimated. Economists had expected the ADP report to show a gain of +173,000 private-sector jobs. Some analysts use ADP's data to provide guidance on the employment which will be released Friday as part of the January unemployment report. In December, ADP initially reported a gain of +215,000, a miss of 47,000 from the Labor Department's subsequent private-payroll figure of +168,000. Currently analysts expect employment rose +163,000 in January, compared with a gain of +155,000 in December.
Yesterday it was reported that a gauge of consumer confidence dropped in January to the lowest level since November 2011 on lower expectations and gloomier views of the present situation. The Conference Board said its consumer-confidence index dropped to 58.6% in January, missing analysts' estimates of 64.3%, from an upwardly revised 66.7% in December. A prior December estimate pegged the level at 65.1%. Generally when the economy is growing at a good clip, confidence readings are at least 90%.
Monday, January 28, 2013 4:03 p.m est.
The market continues to move steadily higher as it was up all last week but it has been a slow crawl as it seems the only thing keeping it up at the moment is all of the cash the Fed is pumping into the system. It is overdue for a pullback as it is technically overbought and exhausted running on fumes. If we don’t see something happen soon its going to get ugly I’m afraid as we move into February!! At the close the Dow was down by -14.00 points to 13,882.00, S&P 500 -3.00 points to about 1500.00, S&P 100 -1.00 points to 676.00 and the Nasdaq Composite +5.00 points to about 3154.00. Oil closed up +$.60 remaining around the $96.50 level.
Once again economic data was slow today as it was all last week especially with regional economic data. Pending home sales fell -4.3% in December, with low inventory cutting results, according to data released by the National Association of Realtors. The trade group's pending-home-sales index declined to 101.7% in December from 106.3% in November. A reading of 100% equals the average level of contract activity in 2001, when NAR started tracking these data. "Supplies of homes costing less than $100,000 are tight in much of the country, especially in the West, so first-time buyers have fewer options," said Lawrence Yun, NAR's chief economist. "We expect a seasonal rise of inventory in the spring to help, but a seller's market may be developing." Despite the recent decline, pending sales were +6.9% higher than during December 2011. By region, December saw pending-home-sales declines of -8.2% in the West, -5.4% in the Northeast and -4.5% in the South. There was a gain of +0.9% in the Midwest. "Much of the West is already a seller's market for homes priced under a million dollars, but conditions are much more balanced in the Northeast," Yun said.
Orders for big-ticket items made in America was up a strong +4.6% in December, fanned by a big batch of bookings for military and commercial aircraft. Demand also improved for most other makers of long-lasting goods, according to government data, suggesting that U.S. manufacturers could be poised for a modest rebound in 2013. Modest is the key word there!! Meanwhile, shipments of durable goods rose +1.3% in December. Inventories fell slightly the first drop in 14 months and unfilled orders climbed +0.8%. Businesses briefly got caught in 2012 with excess inventories, which they’ve been reducing. Broken down by sector, orders jumped by +3.6% in December for primary metals, by +3.3% for computers and electronic products and by +5.7% for communications gear. Orders also rose a slight +0.4% for autos and parts.
Orders for electrical equipment and appliances stood out as the only category to post a drop, down -2.4%. In November, the increase in orders was revised down a tick to +0.7%.
Thursday, January 17, 2013
Interesting: In Greece illegal logging on the rise as Depression lingers. According to The Wall Street Journal: "Tens of thousands of trees have disappeared from parks and woodlands this winter across Greece, authorities said, in a worsening problem that has had tragic consequences as the crisis-hit country's impoverished residents, too broke to pay for electricity or fuel, turn to fireplaces and wood stoves for heat. As winter temperatures bite, that trend is dealing a serious blow to the environment, as hillsides are denuded of timber and smog from fires clouds the air in Athens and other cities, posing risks to public health. The number of illegal logging cases jumped in 2012, said forestry groups, while the environment ministry has lodged more than 3,000 lawsuits and seized more than 13,000 tons of illegally cut trees."
As we go into expiration tomorrow the market has been basically flat making little moves in either direction all week, until today where the Dow saw highs of +130.00 points, S&P 500 +13.00 points and the Nasdaq +30.00 points midday taking the market to new 5 year highs. For the week its still only up about half a percent however. At the close the Dow was up by +85.00 points to 13,596.00, S&P 500 +8.00 points to about 1481.00, S&P 100 +2.00 points to 669.00 and the Nasdaq Composite +18.00 points to about 3136.00. Oil closed up +$1.00 remaining around the $95.00 level.
The market is very interesting right now as it is incredibly overbought and volume has been miniscule the higher it goes. Besides that, so far earnings have been average and are expected to remain low so the move in the market of +4% since the start of the year shouldn’t continue! If it did we’d see about a 100% increase in the averages for the year anyhow and of course this isn’t going to happen. What it means is this has been nothing but a liquidity push and the market is due for some type of correction which could even start tomorrow!
Jobless Claims fell by -37,000 to a seasonally adjusted 335,000. Claims fell to the lowest level since January 2008, but the big drop likely stems from a seasonal-adjustment quirk whose effects could quickly fade and push the numbers back up in the next few weeks. Economists expected claims to drop to 368,000 from last week's slightly revised 372,000. The average of new claims over the past month, meanwhile, fell by a smaller -6,750 to 359,250. The four-week average reduces seasonal volatility in the weekly data and is seen as a more accurate barometer of labor-market trends. Continuing claims increased by +87,000 to a seasonally adjusted 3.21 million. Continuing claims reflect the number of people already receiving benefits. About 5.82 million people received some kind of state or federal benefit in the week ended December 29th, up 465,547 from the prior week. Total claims are reported with a two-week lag.
Construction on New Homes jumped up +12.1% in December to a seasonally adjusted annual rate of 954,000, the highest level since June 2008, with gains across the country, as well as in single-family homes and buildings. Economists had expected housing starts to increase to a rate of 883,000 from an original estimate of 861,000 for November. Starts rose +24.7% in the Midwest, +21.4% in the Northeast, +18.7% in the West and +3.8% in the South. By structure size, starts for single-family homes rose +8.1%, and increased +20.3% in buildings with at least two units. While starts in December were up +37% from a year earlier, rates remain far below a bubble peak of almost 2.3 million in 2006. Meanwhile, building permits, a sign of future demand, rose +0.3% in December to a rate of 903,000, the highest rate since July 2008. Permits for single-family homes rose +1.8% to a rate of 578,000, while permits for structures with at least two units declined -2.1% to a rate of 325,000.
Yesterday it was reported a gauge of confidence among home builders was unchanged in January after rising in December to the highest level in more than six years, with respondents encouraged by a recovering housing market, but nervous over ongoing fiscal uncertainty, according to the National Association of Home Builders/Wells Fargo Housing Market Index. The index remained at a seasonally adjusted level of 47% in January, below a consensus estimate of 48%. Despite the pause in January, the builder-confidence gauge is up 88% from the same period in the prior year. Indeed, separate data from the government indicate that new home construction has increased more than 20% over the past 12 months, while remaining at relatively low levels. However, the builder-confidence gauge remains below the key reading of 50%. Readings over 50% indicate that more builders see sales conditions as good than poor.
Wednesday, January 16, 2013
Interesting: In Greece illegal logging on the rise as Depression lingers. According to The Wall Street Journal: "Tens of thousands of trees have disappeared from parks and woodlands this winter across Greece, authorities said, in a worsening problem that has had tragic consequences as the crisis-hit country's impoverished residents, too broke to pay for electricity or fuel, turn to fireplaces and wood stoves for heat. As winter temperatures bite, that trend is dealing a serious blow to the environment, as hillsides are denuded of timber and smog from fires clouds the air in Athens and other cities, posing risks to public health. The number of illegal logging cases jumped in 2012, said forestry groups, while the environment ministry has lodged more than 3,000 lawsuits and seized more than 13,000 tons of illegally cut trees."
Yesterday the market surged higher and although the market closed mixed today it closed with a half a percent gain for the week. Today the Dow saw highs of +30.00 points, S&P 500 +1.00 points and the Nasdaq +5.00 points. At the close the Dow was up by +17.00 points to 13,488.00, S&P 500 -.07 points to about 1472.00, S&P 100 +.50 points to 668.00 and the Nasdaq Composite +4.00 points to about 3126.00. Oil closed -$.20 remaining around the $94.00 level. As we move into the final week of trading before expiration, the market is quite overbought so it wouldn’t be surprising to see a pullback to get the market back inline with the averages and it still needs to fill the gap high it made at the start of the year.
Industrial production increased for the second straight month in December as companies continued to recover from super-storm Sandy, the Federal Reserve said Wednesday.
Production rose 0.3% in December, close to economist forecasts of a 0.2% gain.
Production is now at its highest level since June 2008.
Revisions to the past two months showed a stronger factory sector than previously thought.
While November production was revised down slightly to an increase of 1% from the initial estimate of a 1.1% gain, the decline in production in October was revised higher to a drop of 0.3% from the prior estimate of a 0.7% decline.
Economists said it was probably best to average the gains in output over the last three months given the impact of Hurricane Sandy, which struck the East Coast on Oct. 29.
For the fourth quarter, industrial production moved up at a 1% annual rate, and production expanded by 2.4% for the whole year, compared to the 4.1% growth in 2011 and 6.3% expansion of 2010.
General Electric hybrid electric water heater factory
Utility production fell sharply in December due to unseasonably warm weather.
Details
Output at factories alone increased 0.8% in December following a 1.3% rise in the prior month.
Capacity utilization for total industry, a gauge of inflation pressure, increased one-tenth of a percentage point to 78.8% in December. This is just slightly above the 78.3% level in December 2011. Read more on inflation.
Production of high-tech goods rose 0.4% in December after a 0.2% gain in November.
Motor vehicle and auto part production increased 2.6% in December after a 5.8% gain in the prior month.
Total production, excluding the auto sector, rose 0.1% in December after a 0.7% gain in November.
Consumer goods production fell 0.1% in December after rising 0.9% in November.
The index for business equipment rose 1.3% after a 2.0% advance.
The output of construction supplies rose 1.0% in December after a 2.2% gain.
Materials output rose 0.3% in the month after a 1% rise in the prior month.
Output at mines rose 0.6% after a 0.3% gain in November.
A gauge of confidence among home builders was unchanged in January after rising in December to the highest level in more than six years, with respondents encouraged by a recovering housing market, but wary over ongoing fiscal uncertainty, according to the National Association of Home Builders/Wells Fargo Housing Market Index released Wednesday. The index remained at a seasonally adjusted level of 47 in January, below a consensus estimate of 48 from analysts polled by MarketWatch. Despite the pause in January, the builder-confidence gauge is up 88% from the same period in the prior year. Indeed, separate data from the government indicate that new home construction has increased more than 20% over the past 12 months, while remaining at relatively low levels. However, the builder-confidence gauge remains below the key reading of 50. Readings over 50 indicate that more builders see sales conditions as good than poor.
Yet, we continue to trade. Mostly because it could still take a long time for things to go in the toilet. That's because the Federal Reserve has pumped so much money in the system that what would normally happen, the collapse of an economy teetering on potential insolvency, is being delayed. And here is what may surprise you. There is still a chance that things could actually turn around for the better. We don't know how much of a chance. But we would be foolish to discount it.
Friday, January 11, 2013
Banks are flooded with money. But that's a bad thing, some say. According to The Wall Street Journal: "U.S. banks are struggling with a problem most people would love to have: too much cash. But the flood of deposits into U.S. financial firms, at a time when many lenders are having difficulty making new loans, spells trouble for the industry as banks prepare to post fourth-quarter numbers." The overall opinion of analysts is that this is a bad thing as it means that banks are not lending. Furthermore, some say that it could impact earnings negatively.
Yesterday the market surged higher and although the market closed mixed today, overall it closed with a half a percent gain for the week. Today the Dow saw highs of +30.00 points, S&P 500 +1.00 points and the Nasdaq +5.00 points. At the close the Dow was up by +17.00 points to 13,488.00, S&P 500 -.07 points to about 1472.00, S&P 100 +.50 points to 668.00 and the Nasdaq Composite +4.00 points to about 3126.00. Oil closed -$.20 remaining around the $94.00 level. As we move into the final week of trading before expiration, the market is quite overbought so it wouldn’t be surprising to see a pullback to get the market back inline with the averages and it still needs to fill the gap high it made at the start of the year.
Wednesday, January 9, 2013
So far this week the market has been relatively flat as Monday and Tuesday were down and although up today, the markets remains slightly down for the week. The Dow saw highs of +80.00 points, S&P 500 +7.00 points and the Nasdaq +15.00 points early on in the day but as it went on interest dies and almost went negative in the final hour before but was able to bounce back to close with decent gains for the day. At the close the Dow was up by +62.00 points to 13,391.00, S&P 500 +4.00 points to about 1461.00, S&P 100 +1.00 points to 662.00 and the Nasdaq Composite +14.00 points to about 3106.00. Oil closed up +$.20 remaining around the $93.00 level.
We’ve now seen the first Five Days of trading go by and its always best to get the all month reading to get a decent idea about the rest of the year but its always interesting to compare. There has been a little outperformance when the first five days were positive, compared to when they were negative, but it's not huge. However, when the first five days have been especially strong, with the Dow up +2% or more, the Dow has averaged a gain of +11% for the rest of the year. When the Dow has been down by 2% or more in the first five days, it actually averages a loss of more than -2% for the rest of the year, and is positive less than half the time. This may be a good omen, as the Dow is up over 2% so far this year. The January Barometer refers to the fact that the market's performance in January is a good indicator for how it's going to perform the entire rest of the year. If January is positive, the rest of the year averages a gain of +9%, and is positive 83% of the time. This is significantly better than if January is negative. In those instances, the market returns an average of just +2%, and is positive just half the time. If January is particularly strong or weak, the indicator has been even more pronounced. If the Dow is up +3.5% or more in January, the rest of the year averages a gain of +11%. If the Dow loses at least -3.5% in January, it averages a gain of just +.32%.
Monday, January 7, 2013
Health care law issues loom for companies. According to The Wall Street Journal: "One of the biggest decisions for many companies this year will be what to do about their health benefits. They have just 12 months before the major provisions of the federal overhaul law take effect on Jan. 1, 2014, reshaping health coverage in the U.S. Employers with at least 50 workers will owe penalties if they don't cover full-time employees. Most Americans will face a parallel "individual mandate" to obtain insurance. And new online marketplaces called exchanges will sell insurance plans in each state, paired with federal subsidies for lower-income people."
The final day of the week saw the market move higher with the Dow seeing highs of +60.00 points, S&P 500 +9.00 points and the Nasdaq +10.00 points. At the close the Dow was up by +44.00 points to 13,435.00, S&P 500 +7.00 points to about 1467.00, S&P 100 +2.00 points to 665.00 and the Nasdaq Composite +1.00 points to about 3101.00 as Apple was under pressure once again about iphone sales slipping due to production problems. Oil closed up +$.40 remaining around the $93.00 level.
First Five Days Barometer: We may not have to wait all month to get a decent idea about the rest of the year, though. The table below looks at how the Dow performs depending on just the first five trading days of the year. There has been a little outperformance when the first five days were positive, compared to when they were negative, but it's not huge.
However, when the first five days have been especially strong, with the Dow up 2% or more, the Dow has averaged a gain of 11.22% for the rest of the year. When the Dow has been down by 2% or more in the first five days, it actually averages a loss of more than 2% for the rest of the year, and is positive less than half the time.
This may be a good omen, as the Dow is up over 2% so far this year, after three trading days.
Pay attention to how the market performs this month. The January Barometer refers to the fact that the market's performance in January is a good indicator for how it's going to perform the entire rest of the year. Using data since 1950, the table below shows Dow Jones Industrial Average (DJI) returns from February through December, depending on what happens in January. If January is positive, the rest of the year averages a gain of 9.44%, and is positive 83% of the time. This is significantly better than if January is negative. In those instances, the market returns an average of just 2.04%, and is positive just half the time.
If January is particularly strong or weak, the indicator has been even more pronounced. If the Dow is up 3.5% or more in January, the rest of the year averages a gain of 11.15%. If the Dow loses at least 3.5% in January, it averages a gain of just 0.32%.
We have now are three very interesting factors that are all intertwined: high levels of unemployment, super easy monetary policy until the end of time, and a pretty irresponsible set of people running the country. That sounds a lot like Greece, Venezuela, Cuba, and parts of sub-Sahara Africa to us. But that's what seems to be developing here.
That's a bad combination of factors for the real world, unless, somehow, this can be turned around.
As expected, the Senate agreement was full of goodies to special interest groups on both sides and does little to actually cut spending. It does raise taxes on individuals, even though, not buy much unless you are actually a successful person that is fortunate enough to make over $400,000 per year. Fewer of those will be around in the next few years. Of that we're sure.
The House passed the bill as well, special interest perks included. That the Congressional Budget Office score says that this bill will add at least another $3 to $4 trillion to the national debt is apparently irrelevant to both houses of Congress. And that means that we are right back where we started except taxes rose on a lot of people.
What else can be said? Higher taxes with no benefits for anyone except big donors for Senators, is not the way to run a country. And, if history is any guide, this will come back to haunt the United States.
So the only thing that's left to see is what the market does with it. If stocks go up big and go up big for a while, at least we'll make some money. But if stocks tank, our taxes will go up and our portfolios will be impaired, either because we have to go to cash which pays zero interest, or because we had some losses, despite careful portfolio management.
What it means is that for investors, the best hope is that the market goes up, no matter what the long term implications of the Washington buffoonery turn out to be. And if stocks go up, we should own them, knowing full well that there will be a reckoning at some point in the future. But that's what sell stops and portfolio monitoring are for. In other words, investors who succeed will be the ones who actively manage their portfolios.
That, in our opinion, is cold comfort. But it is real and tangible. And it does give us an opportunity to make plans and implement them from an investment standpoint.
Yet, we continue to trade. Mostly because it could still take a long time for things to go in the toilet. That's because the Federal Reserve has pumped so much money in the system that what would normally happen, the collapse of an economy teetering on potential insolvency, is being delayed. And here is what may surprise you. There is still a chance that things could actually turn around for the better. We don't know how much of a chance. But we would be foolish to discount it.
Friday, January 4, 2013
The final day of the week saw the market move higher with the Dow seeing highs of +60.00 points, S&P 500 +9.00 points and the Nasdaq +10.00 points. At the close the Dow was up by +44.00 points to 13,435.00, S&P 500 +7.00 points to about 1467.00, S&P 100 +2.00 points to 665.00 and the Nasdaq Composite +1.00 points to about 3101.00 as Apple was under pressure once again about iphone sales slipping due to production problems. Oil closed up +$.40 remaining around the $93.00 level.
As we end the first trading week of 2013, looking back, the year 2012 may be remembered for many reasons. Most of all, we should be thankful that the world did not end as a result of the Mayan calender ending or the alignment of the planets on December 21st. Albeit this last year has been similar to the last one and the one before that, etc. As I mentioned at the peak of the market in 2000, we may not see another new high for at least 16 years and that life as we have come to know it may not come back for another decade or maybe even decades after the housing bubble peaked in 2006!
The market originally peaked in 2000 after the internet bubble finally blew up and the Fed started the new norm of pumping money into the system pushing interest rates to new lows. This of course created the next bubble, Real Estate! The final repercussions of the real estate crash of 2008, exacerbated by the leverage and fraud of the derivatives based on credit default obligations based on empty houses and faulty consumer credit expectations on the part of fraudulent lenders, have yet to be resolved. Yes, housing has bounced back but that’s mostly because of the money the Fed prints and the continued lowering of interest rates. With this scenario, the best that the economy has been able to accomplish is weak, non-employment based growth.
The question of course is what will the next bubble be or will we just remain stagnant for another few years until we start the cycle again. From my original time line we only have 3-years left so it seems it may take even a few more years to finish! Over the past 20 years there has been a major behavioral change in society that is changing the rules of the game. This change can best be summarized twofold. First, there is the disconnect from the traditional value of working hard to achieve something and secondly, the scenario where people just give up and say the government will save us! There is no right and wrong anymore. There is only the Post Modern Relativist view that if it feels good, it should be done because the ends justify the means.
In the business world there is a growing lack of common sense in society as the traditional measures of success no longer apply to current problems and there is little on the horizon that says that better days lie ahead. As a result, people have drifted from one crisis to another since 2000, never really focusing on the real crisis or feeling the pain of resolving it. The lack of understanding is not just what's happening, but why it's happening. In other words, the Social Cycle has turned, and the rules that applied to the previous stage, don't apply to this one and until we hit bottom things won’t likely change.
The Law of the Social Cycle was discovered by P.R. Sarkar, an Indian social scientist and philosopher. It has been made prominent in the last 30 years by SMU proffesor Ravi Batra in multiple books starting with "The Great Depression of 1990." The series has been updated most recently in Batra's latest book: The New Golden Age: A Revolution Against Political Corruption And Economic Chaos.
Briefly summarized, Sarkar proposed four distinct stages to the Social Cycle. These are based on the general characteristics of the dominant personality type or societal caste that is control. The first stage is the Laborer stage, which is characterized by Disorder and often violence. This is usually preceded by an Acquisitor stage where the major dynamic is the chase of money for the sake of money itself. That usually leads to extraordinary wealth disparity, or too much money in the hands of too few.
It usually takes decades or longer for the Social Cycle to play itself out. And the transition from one stage to another isn't always perfect. There is always the possibility that two stages may coexist at any one time. There is always the potential for a disruption of the cycle for one reason or another. Yet, the cycle always comes back to its normal ways, and eventually plays out.
We are currently in a transition from the Acquisitor stage to the Laborer Stage. At this point, the Acquisitors have been willing to expand the participation of the Laborers in the sharing of the big pie, to the exclusion of the Intellectuals, while the Warriors are just standing by. The Acquisitors have have formed an alliance with the Laborers. That's why big car companies like General Motors and Ford make deals with labor unions and pass out big Christmas bonuses when they really aren't selling any cars. This is why in California, the state continues to raise taxes to continue to feed the labor unions. Lobbyists in Washington, representing Acquisitor and Laborer interests continue to influence public policy, which is why the White House and the Republicans struggled to close the deal on the fiscal cliff. Intellectuals, such as physicians and scientists have been left out of the equation. That's why the so called "high costs of healthcare" are the major reason, in the eyes of the politicians of both parties, that the U.S. is essentially bankrupt.
Acquisitors just want to own everything and Laborers are tired of being exploited by the Acquisitors. The Laborers aren't likely to be appeased by the crumbs being thrown at them by the Acquisitors who are trying to keep their foothold and the control on the available resources. The Intellectuals are starting to look for ways to disappear until everything blows over. And the Warriors are waiting for total violence to break out before they have to step in and bring things back under control.
Anyhow, coming back to the real world, this year, we've seen several things happen that suggest to us that life is becoming more difficult. The economy was basically flat with employment not really getting any better. Only the rich,, of which are standing out more and more are becoming more present, mainly because the poor or a lower middle class is growing. I think that the final stage of this showdown, the war between the Acquisitors and the Laborers is about to hit a crucial stage. If history is any guide, the Laborers will have the upper hand and disorder will rule. If the Acquisitors win, then the disparity between the rich and the poor will reach a level from which there will be no return. In essence, we will all be Laborers, no matter what your profession or vocation is.
Basically, it seems were going to continue to muddle along for a long time, especially as long as the Fed keeps the printing presses on overdrive. That's because markets are fickle and are, for now in denial. Yet, eventually, some sanity will prevail and something will give. And that something will either be the thing that saves us all, like the Internet did for Clinton in the 1990s, or the realization by the masses that they have truly been lied to and that they’ll revolt and change will come!
The economy created +155,000 jobs in December, matching its two-year average and the unemployment rate was unchanged at 7.8%. The actual unemployment report was +14.4%, people who have basically given up on looking for jobs or have run out of benefits. Economists expected an increase of +160,000 jobs last month. The unemployment rate, originally reported as 7.7% in November, was changed to 7.8% after the Labor Department's annual revision conducted each December. The number of new jobs created in November, meanwhile, was revised up to +161,000 from +146,000, while October's figure was revised down to +137,000 from +138,000. The biggest increases in hiring in December occurred in health care, bars and restaurants, construction and manufacturing. The retail sector and government reduced employment. Average hourly wages rose +7 cents, or +0.3%, to $23.73 while the average workweek edged up by +0.1 hour to 34.5 hours.
Service-sector growth accelerated in December, as the Institute for Supply Management's services sector index climbed to 56.1% from 54.7% in November. Economists had expected a 54.7% reading. The details of the report also were generally good, with the new-orders index climbing by +1.2% to 59.3% and the employment index climbing +6% points to 56.3%. Any reading above 50% indicates expansion.
Factory orders were unchanged in November, a result that was weaker than expected. Economists had forecast a +0.3% increase in factory orders. Prior to November, factory orders had increased in three of the past four months. Orders in November were held down by a drop in transportation equipment, especially civilian and military aircraft. Orders for durable goods increased +0.8% gain in November, revised up from +0.7% estimated two weeks ago. New orders for nondurable goods fell -0.6% after a +0.5% gain in October. Shipments increased +0.4% in November, the fourth gain in the past five months. Inventories were flat in November for the second straight month. There was some underlying strength in the report. Orders for capital goods excluding defense and aircraft rose +2.6% in November after a +3% gain in October. Shipments of these "core" orders, a key component of investment in the gross domestic product calculations, were up +2% in the month.
Wednesday, January 2, 2013
The market rallied pretty hard today as there was a deal made on the “fiscal cliff” at the last minute. Even though it was just okay,,, the Dow saw highs in the final minutes of trading with the Dow seeing +310.00 points, S&P 500 +37.00 points and the Nasdaq +95.00 points. At the close the Dow was up by +310.00 points to 13,413.00, S&P 500 +36.00 points to about 1462.00, S&P 100 +17.00 points to 664.00 and the Nasdaq Composite +93.00 points to about 3112.00. Oil closed up +$1.00 remaining around the $93.00 level.
The measure approved by the House of Representatives undid tax hikes for all but one to two percent of households, with the bipartisan vote ending a lengthy standoff over how to avoid more than $600 billion in tax hikes and spending cuts viewed as likely to push the economy back into recession. Yet the deal was not the grand bargain on cutting the nation’s red ink that lawmakers intended when they came up with tax-and-spending deadlines during the past few years. The measure bypassed much of the immediate trauma poised by the fiscal cliff and marked only one piece towards cutting the federal deficit, with a February battle looming over increasing the $16.4 trillion debt ceiling. That could be the next thing that throws the market off as that is also a big thing so once the party is over the market may come back to its senses.
Manufacturers expanded their business in December after contracting slightly in November, according to the closely followed ISM index. The Institute for Supply Management index rose to 50.7% from 49.5% in November. Economists had expected the index to climb to 50.5%. Reading over 50 indicate more manufacturers are expanding instead of contracting. The ISM's new-orders gauge was flat at 50.3% and the production index fell 1.1 points to 52.6%. The employment gauge, however, climbed 4.3 points to 52.7% to increase the overall ISM index. That's the highest employment reading since September.
Construction projects declined in November, missing estimates. Construction spending fell -0.3% in November, while analysts had expected a gain of +0.8%. Spending for October was downwardly revised to a gain of +0.7%, compared with a prior estimate of a +1.4% increase. In November, spending on private construction declined -0.2% while spending on public projects fell -0.4%. Spending on private homebuilding rose +0.4%.
Monday, December 31, 2012 4:03 p.m est.
The market rallied today on news that Lawmakers have reached an agreement on all tax issues related to the fiscal cliff. Senate Republican leader Mitch McConnell said that negotiators are “very, very close” to a broader deal. This helped to push the Dow to see highs of -+175.00 points, S&P 500 +25.00 points and the Nasdaq +65.00 points just before the close!! At the close the Dow was up by +166.00 points to 13,104.00, S&P 500 +24.00 points to about 1426.00, S&P 100 +10.00 points to 647.00 and the Nasdaq Composite +59.00 points to about 3020.00. Oil closed up +$1.00 around the $92.00 level. So far this was the easy part,,, rally on the rumor of a partial deal but the question will still come into play what the market thinks about after everything is settled. This may have just been a reactionary bounce so we’ll know more by the end of the week what traders are really thinking as we start the new year after about a +13% gain on the market this year!!!
Friday, December 28, 2012
Today the market started the day lower once again as the “Fiscal Cliff” hung over everyones' heads but as rumors whipped around it almost went positive before falling back once again. It all changed in the final hour however as President Obama said that it appeared there was no deal as of yet and that it would be down to the wire nonetheless, so the selling began and the Dow saw lows in the final minutes of trading, -170.00 points, S&P 500 -17.00 points and the Nasdaq -30.00 points. At the close the Dow was down by -158.00 points to 12,938.00, S&P 500 -16.00 points to about 1402.00, S&P 100 -8.00 points to 636.00 and the Nasdaq Composite -26.00 points to about 2960.00. Oil closed slightly down by -$.42 remaining around the $91.00 level. Globex futures sold off after the cash market closed so we could see a down open on Monday but I have a feeling something will happen this weekend to save the day,,,,, at least for now!!!!
Pending home sales rose +1.7% in November for a third month of gains, with affordability attracting buyers, the National Association of Realtors reported. The pending-home-sales index reached 106.4% in November, the highest level since April 2010, when buyers were trying to make a tax-credit deadline, from 104.6% in October, the trade association said. Pending sales were up +9.8% from November 2011, for the 19th month of annual gains. "Even with market frictions related to the mortgage process, home contract activity continues to improve," said Lawrence Yun, NAR's chief economist, in a statement. By region, November saw pending-home-sale gains of +5.2% in the Northeast, +4.2% in the West, and +0.1% in the Midwest. The South was unchanged. A sale is listed as pending when the contract has been signed but the transaction has not closed, and an index of 100 is equal to the average level of contract activity during 2001.
Thursday, December 27, 2012
Yesterday the market traded lower and today it was down sharply today after it seemed that the fiscal cliff was unsolvable. The Dow saw lows of -160.00 points, S&P 500 -19.00 points and the Nasdaq -45.00 points but after it was announced that the House was set to return Sunday night to discuss something after the President reiterated he had some type of plan, the market started to rally and in the final hour actually touched positive territory. At the close the Dow was down by -18.00 points to 13,096.00, S&P 500 -2.00 points to about 1418.00, S&P 100 -1.00 points to 644.00 and the Nasdaq Composite -4.00 points to about 2986.00. Yesterday oil rallied pretty hard even though the market was lower, up over +$2.00 but today was flat ending the day slightly up by +.15 remaining around the $91.00 level. The “Fiscal Cliff” continues to hold the market in its sites and any comments seems to move it in either direction with the turn of a switch. This will likely continue until we start the New Year and there is actually some type of a deal set.
A gauge of consumer confidence dropped in December to the lowest level in four months as short-term expectations plunged on fiscal-cliff concerns. The Conference Board said its consumer-confidence index fell to 65.1% in December from a downwardly revised 71.5% in November. A prior November estimate pegged the level at 73.7%. A barometer of expectations plunged to 66.5% in December, the lowest reading since November 2011, from 80.9% in November. Meanwhile, a gauge of consumers' view on the present situation increased to 62.8% from 57.4%. "A similar decline in expectations was experienced in August 2011 during the debt ceiling discussions," said Lynn Franco, director of economic indicators at the Conference Board. "While consumers are quite negative about the short-term outlook, they are more upbeat than last month about current business and labor market conditions." Economists had expected a December reading of 70%, with fiscal-cliff concerns outweighing positive jobs news.
Sales of New Homes jumped +4.4% in November to an annual rate of 377,000, the highest level since April 2010. In October, sales were revised down to 361,000 from an initial reading of 368,000. Economists had forecast new home sales to rise to 380,000 last month on a seasonally adjusted basis. The median price of new homes climbed +3.7% to $246,200 in November from $237,500 in the prior month. The supply of new homes available for purchase fell to 4.7 months in November at the current sales rate from 4.9 months in October. New home sales are +15.3% higher compared to one year ago and the median sales price is +14.9% higher.
Monday, December 24, 2012
Would like to wish everyone a very Merry Christmas!! It has been a great year of giving and helping others so there is a lot to celebrate on this special holiday! Although the market was open today it was a shortened trading session and you could tell by the anemic movement and volume. The Dow saw lows of -60.00 points, S&P 500 -5.00 points and the Nasdaq -15.00 points. At the close the Dow was down by -52.00 points to 13,139.00, S&P 500 -3.50 points to about 1427.00, S&P 100 -2.00 points to 647.00 and the Nasdaq Composite -9.00 points to about 3013.00. Oil was down a bit by -$.10 remaining around the $87.00 level. The market will be open the day after Christmas so there will be 4 days of trading before year end! We could see a very interesting end to 2012!
Friday, December 21, 2012 4:03 p.m est.
As we move into the final trading days of the year next week the market has seen an average gain of +1% during the week between Christmas and New Years. That is far higher than the average that prevails in all other weeks of the year, equivalent, in fact, to an annualized rate of more than 80%," with gains coming in 78% of the time. However, about once every five years, there are no gains. Last year for example, the Dow lost -0.62% during the period. Stocks tend to do better in the year after a failure of the end of the year rally to materialize. The key this year is going to be what the government does about the fiscal cliff to see how the market reacts so it could be interesting.
Today the market sold off at the start of expiration with the Dow seeing lows of -180.00 points, S&P 500 -22.00 points and the Nasdaq -55.00 points because overnight Senator Boehners Plan B was scrapped as his party voted it down. This sent Globex S&P 500 futures down -62.00 points at one time before recovering midday. At the close the Dow was down by -121.00 points to 13,191.00, S&P 500 -14.00 points to about 1430.00, S&P 100 -6.00 points to 649.00 and the Nasdaq Composite -29.00 points to about 3021.00. Oil closed down -$1.00 around the $89.00 level.
Consumer sentiment tumbled in December, with concerns about the fiscal cliff more than offsetting lower gas prices and higher stocks. The University of Michigan-Thomson Reuters consumer-sentiment gauge fell to a final December reading of 72.9%, the lowest level since July from 82.7% in November. A preliminary reading for December had pegged the level at 74.5%. Economists had expected a final December reading of 75%. “Confidence is lost much more easily than it can be regained, and the pessimism created by not reaching a resolution before year-end will be difficult to reverse even if a settlement is reached soon after the start of 2013,” said Richard Curtin, the consumer survey’s chief economist. Looking forward, “if no resolution is reached the falloff could easily worsen in the weeks ahead,” according to the UMich report. No compromise on the fiscal cliff poses a real threat to the economy, with unemployment projected to rise to 9.1% by the end of next year, according to government analysts. According to the UMich report, more than one-in-four consumer respondents cited concerns about higher taxes. Consumer expectations fell to 63.8% in December from 77.6% in November. Meanwhile, a barometer of views on current conditions declined to 87% from 90.7%.
Despite the decline in December, the UMich’s overall sentiment index has gained about +4% over the last 12 months.
People saw a jump in personal income in November and, despite spending most of it, still took their savings levels to the highest in four months. Personal income climbed +0.6% in November, the largest gain since February, and consumer spending rose +0.4%. Economists had anticipated an +0.4% increase in both personal income and consumer spending in November. October data on income and spending saw small upward revisions. Compared to the same month of 2011, personal income was up +5.1%, the best improvement in five years, allowing spending to rise +5% compared to the same time period, which also was the best gain in five years. An inflation measure the Fed uses to set interest-rate policy, the PCE price index, fell -0.2% in November. The personal savings rate rose to 3.6% from 3.4% in October.
Orders for long-lasting goods jumped in November, in data suggesting a surprisingly strong and broad increase in corporate spending, according to the Commerce Department saying Durable-goods orders increased +0.7% in November, and importantly, the government upwardly revised October's reading to growth of +1.1% from a previously estimated +0.5% advance. Economists had forecast just a +0.1% advance in November. A category known as core capital goods, which excludes aircraft as well as defense capital goods, climbed +2.7% in November, after a +3.2% pickup in October.
Thursday, December 20, 2012 4:03 p.m est.
The market started the day on the downside slightly with the Dow seeing lows of -20.00 points, S&P 500 -2.00 points and the Nasdaq -5.00 points but as the day went on it came back closing near highs as it appeared there was hope for Senator Boehners Plan B saving the day for the fiscal cliff. Interestingly though the Democrats have already said that President Obama would Veto the bill if it came across his desk so why does it even matter. At the close the Dow was up by +60.00 points to 13,312.00, S&P 500 +8.00 points to about 1436.00, S&P 100 -6.00 points to 652.00 and the Nasdaq Composite -10.00 points to about 3044.00. Oil closed up +$.10 around the $90.00 level. After the bell Senator Boehner’s plan B was rejected and Globex S&P 500 futures were down -62.00 points in a mini flash crash but have since rebounded to a -20.00 point sell off. It looks like tomorrow will be a down day for sure.
The economy grew more quickly than previously stated in the July-to-September quarter due to stronger trade, faster health-care spending and increased local government construction. The third-quarter gross domestic product grew at a seasonally adjusted annual rate of +3.1% in the third quarter, which is the fastest rate of growth since the +4.1% pickup in the final quarter of 2011. The GDP numbers were well ahead of the government's initial estimate of +2% growth or even its most recent tally of +2.7%. Economists anticipated a +2.9% reading in the third and final estimate.
Jobless claims rose +17,000 to a seasonally adjusted 361,000 last week, versus a slightly upwardly revised 344,000 in the prior week. That's almost exactly in line with the economist consensus of 360,000. The four-week average of claims fell -13,750 to 367,750, a two-month low. Continuing claims rose +12,000 to 3.22 million.
The Philadelphia Fed index improved to a reading of positive +8.1 in December from -10.7% in November, well above the negative -4% reading expected forecasts. That's the best reading since April and came as new-orders index increased 15 points and the current shipments index jumped 25 points.
Sales of existing homes rose +5.9% in November to a seasonally adjusted annual rate of 5.04 million, reaching the highest rate since November 2009, when a tax credit was expected to expire, the National Association of Realtors reported. NAR cited growing momentum in the housing market from an economy that is adding jobs and new household formation. The rate in October was revised down to 4.76 million from a prior estimate of 4.79 million. Economists had expected a rate of 4.9 million for November. Sales are up +14.5% from the prior year. The median existing-home price rose +10.1% from the prior year to $180,600. Inventories declined 3.8% to 2.03 million units in November, representing at the current sales rate a 4.8-month supply, the lowest since September 2005.
Wednesday, December 19, 2012 4:03 p.m est.
Yesterday the market decided midday that the “fiscal cliff” was looking solvable, today it didn’t look like it after Senator Boehnor came out with a brief 30 second response slamming Presidents Obama’s comments about it. This caused the Dow to see lows of -110.00 points, S&P 500 -12.00 points and the Nasdaq -10.00 points. It had rallied in the final hour to make it back into positive territory but in the end finished the day near lows! At the close the Dow was down by -99.00 points to 13,252.00, S&P 500 -11.00 points to about 1436.00, S&P 100 -6.00 points to 652.00 and the Nasdaq Composite -10.00 points to about 3044.00. Oil closed up +$1.30 around the $90.00 level. This is also the expiration traded period I was talking about yesterday as people start moving into January so volatility can kick up and that was likely part of todays' move. The main one though is the government is running out of time to solve the "fiscal cliff" problem to make it by year end and it the two parties seem to remain at an impasse to solve the problem. The next two days could be very interesting….
Construction on New Homes fell -3% in November to a seasonally adjusted annual rate of 861,000, led by declines in the West and Northeast. Economists had expected housing starts to fall to a rate of 865,000. The starts rate for October was downwardly revised to 888,000 from a prior estimate of 894,000. Starts for November fell by -19.2% in the West and by -5.2% in the Northeast, while rising +2.9% in the South and +3.3% in the Midwest. Meanwhile, building permits, a sign of future demand, rose +3.6% last month to a rate of 899,000. Permits for single-family homes ticked down -0.2% to a rate of 565,000, while permits for structures with at least two units jumped +10.6% to a rate of 334,000.
Despite the decline in November, starts have gained +22% over the last 12 months. Still, current rates remain far below a bubble peak of nearly 2.3 million in 2006.
Other recent housing data have also shown a sector that is gaining strength but that still has far to go. A gauge of confidence among home builders rose in December to the highest level since April 2006, with respondents encouraged by declining inventory and good sales conditions, reported yesterday. However, new construction of single-family homes remains below levels historically associated with current levels of sentiment among builders. Also, despite the improving builder sentiment, the nation’s housing sector still faces challenges from strict lending conditions, even as mortgage rates hover near record lows, and a persistently high unemployment rate. There are also concerns about shadow inventory.
Tuesday, December 18, 2012 4:03 p.m est.
Interesting: According to The Wall Street Journal: 'French actor Gérard Depardieu said he was surrendering his French passport and social security after France's prime minister called his move to Belgium "pathetic." Mr. Depardieu is at the center of a controversy in France after the mayor of the Belgian town of Néchin said the actor was moving to his constituency—possibly to pay lower taxes than in France. French Premier Jean-Marc Ayrault last week said it was "pathetic to move to the other side of the border to not pay taxes." In an open letter to Mr. Ayrault in Sunday's edition of French weekly Le Journal du Dimanche, Mr. Depardieu said: "I'm leaving because you think success, creation, talent and anything different should be punished. I am sending you back my passport and social security, which I have never used."'
Yesterday the market decided midday that the “fiscal cliff” wouldn’t be hit so it rallied pretty hard over a percent and today it continued taking it up +2.5% plus for the week and its only been two days! Thats great for a year end rally however it was on low volume and it is an expiration traded week so the gains can be given back just as fast as they are given! All it will take to trigger it is one of the political parties to completely say no to the others ideas. The next two days could be very interesting!!! This is also a quadruple witch this month so all contracts and options for the S&P 500 go off the board with the open of the S&P 500 cash index Friday morning and expiration related trading kicks into high gear at noon tomorrow. Today the Dow saw highs of +130.00 points, S&P 500 +18.00 points and the Nasdaq +45.00 points. At the close the Dow was up by +116.00 points to 13,351.00, S&P 500 +16.00 points to about 1447.00, S&P 100 +7.00 points to 658.00 and the Nasdaq Composite +44.00 points to about 3055.00. Oil closed up +$.80 around the $88.00 level.
The amount the U.S. owes to the rest of the world, known as the current-account deficit, fell sharply for the second straight quarter, reaching its lowest in nearly two years, government data showed today. The nation’s current-account balance fell to $107.5 billion in the third quarter, -9% below an upwardly revised $118.1 billion in the second quarter. The deficit had fallen -11.6% in the second quarter. In the third quarter, the current-account deficit fell to +2.7% of gross domestic product from +3% in the prior quarter. The ratio is the smallest since it was +2.5% of GDP in the second quarter of 2009. The current account mainly measures whether a nation is selling more goods and services to other countries than it buys from them. It also includes certain large money flows in and out of the country. When a country runs a current-account deficit, it must borrow more money from abroad or sell off more domestic assets. Yet the declining deficit in the third quarter reflected shrinkage in the balance of payments in several key areas.
A gauge of confidence among home builders rose in December to the highest level since April 2006, with respondents encouraged by declining inventory and good sales conditions, according to the National Association of Home Builders/Wells Fargo Housing. The index rose two points to a seasonally adjusted level of 47%, matching estimates from a downwardly revised 45% in November. A prior estimate for November pegged the level at 46%. Despite eight months of gains, the confidence gauge remains below the key reading of 50%. Readings over 50% indicate that more builders see sales conditions as good than poor. While confidence readings have more than doubled over the past 12 months, new construction is below levels historically associated with current levels of sentiment among builders.
Yesterday it was reported that Manufacturers in the New York region said business worsened in early December, according to a report released by the Fed’s bank of New York. The Empire state index fell to negative -8.1%, wider than the negative -5.2% seen in November, indicating the downturn broadened to touch more firms in the New York. It marked the fifth month in a row that the index has been in negative territory. Readings below zero indicate activity is declining. In December, 23% of firms said business got worse, while 15% said business improved. The drop in the index came as a surprise because economists expected the headline index to rise to +5.2 as activity recovered in the aftermath of regional disruptions caused by Hurricane Sandy. According to the report, manufacturers in the parts of the region hit by Sandy estimated that revenues in October were -7% lower than otherwise would have been and -5% lower in November.
The Empire State data are watched closely because they are the first reading of the health of the nation’s manufacturing sector. Similar factories data for the Philadelphia region are due later this week.
Friday, December 14, 2012 4:03 p.m est.
The market was under pressure all day as there was no deal announced about the “fiscal cliff” with lows hit in the final hour with the Dow seeing -70.00 points, S&P 500 -8.00 points and the Nasdaq -30.00 points. What's interesting is that there are rumors flying around that if they hadn’t gotten it done today they would run out of time for year end because they have to write it up and get it signed by the President. At the close the Dow was down by -36.00 points to 13,135.00, S&P 500 -6.00 points to about 1414.00, S&P 100 -4.00 points to 643.00 and the Nasdaq Composite -21.00 points to about 2971.00. Oil was up +$1.00 around the $87.00 level. We’re setting up for an interesting expiration traded week as the market is getting nervous about an actual deal being made so volatility will likely be strong.
Consumer prices declined a seasonally adjusted -0.3% in November, mainly because of falling gas costs. So-called core prices, which exclude the volatile food and energy categories, rose +0.1%. Economists had forecast a -0.2% decrease in the main CPI and a +0.2% advance in the core rate. The energy index dropped -4.1% while food prices rose +0.2%. Consumer prices have risen an unadjusted +1.8% over the past 12 months, or by a similar +1.9% on a core basis. That's within the Federal Reserve's inflation target. Real or inflation-adjusted hourly wages, meanwhile, jumped +0.5% last month to post the biggest increase in four years. Yet real wages are flat over the past 12 months, meaning the average worker has seen no increase in his purchasing power.
The output of the nation's factories, mines and utilities surged in November after falling in the prior month, the Federal Reserve said Friday. Production rose +1.1% in November, the Fed said. This is the fastest pace in two years. Economists had been expecting only a +0.2% gain. The rebound from Hurricane Sandy and stronger auto output drove output higher. Production in October was revised down to a -0.7% fall from the initial estimate of a -0.4% decline.
Thursday, December 13, 2012 4:03 p.m est.
The market started the day up with the Dow making highs of +25.00 points, S&P 500 +3.00 points and the Nasdaq +15.00 points early on but when it was announced that the Democrats and Republicans were still far apart on making a deal before the “fiscal cliff” hits at the end of the year, the market started to fall. When it was announced that Britain’s prized triple-A credit rating came under a fresh threat, after ratings agency Standard & Poor’s cut its outlook for U.K. government debt to negative the market really started to sink. The Dow saw lows of -100.00 points, S&P 500 -13.00 points and the Nasdaq -35.00 points going into the final hour. S&P sees a one-in-three chance that Britain will lose its triple-A rating, which would be a major embarrassment for finance minister George Osborne, who has staked his reputation on strengthening Britain’s public finances. At the close the Dow was down by -75.00 points to 13,171.00, S&P 500 -9.00 points to about 1419.00, S&P 100 -4.00 points to 646.00 and the Nasdaq Composite -22.00 points to about 2992.00. Oil was flat closing up only +$.02 around the $87.00 level.
It was reported that Retail Sales climbed a seasonally adjusted +0.3% in November owing to strong demand for autos and a variety of other goods. Excluding autos, which can have an outsized impact on the report, sales were flat, as sharply lower purchases of gas offset increased sales of other retail goods. Economists expected retail sales to increase +0.4% last month, but to decline by -0.2% minus autos. In late October, Hurricane Sandy put a dent in auto sales in the highly populated East Coast, but many would-be buyers returned to showrooms in November. Sales also rose for online retailers and stores that sell electronics, appliances, building materials, clothing, sports and leisurely goods, meals and liquor, home furnishings, over-the-counter medicine and personal-care products. Sales fell -4.0% at gas stations as the cost of fuel dropped again in November, but that's a good thing for consumers. Excluding gas and autos, retail sales jumped a solid +0.7% last month. In the past 12 months, retail sales have risen +3.7%. Sales were unrevised at a -0.3% decline in October, while the increase in September sales were revised down a notch to +1.2%.
Jobless Claims fell by -29,000 to a seasonally adjusted 343,000, putting claims at the second lowest level of the year. Initial claims from two weeks ago were revised up to 372,000 from an original reading of 370,000, based on more complete data collected at the state level. Claims are now below pre-Sandy levels and near their lowest point in about four years. Economists expected claims to decline to 370,000. The average of new claims over the past month, meanwhile, sank by -27,000 to 381,500. The four-week average reduces seasonal volatility in the weekly data and is seen as a more accurate barometer of labor-market trends. Also, Labor said continuing claims decreased by -23,000 to a seasonally adjusted 3.2 million. Continuing claims reflect the number of people already receiving benefits.
Producer prices fell a seasonally adjusted -0.8% in November, mostly because of lower energy costs. Excluding the volatile categories of food and energy, so-called core producer prices edged up +0.1% last month. Economists had predicted a -0.5% decline in the overall producer price index and a +0.2% rise in core PPI. Energy prices sank -4.6%, the biggest one-month decline since March 2009, while the wholesale cost of food rose +1.3%. Over the past year wholesale prices have risen an unadjusted +1.5% or by a larger +2.2% excluding food and energy.
Wednesday, December 12, 2012 4:03 p.m est.
The market was up all day on hopes the Fed would continue to feed it with free money being printed on a daily basis and the hopes of interest rates remaining at record lows! The Dow made highs of +150.00 points, S&P 500 +16.00 points and the Nasdaq +60.00 points. When they finally came out and made their announcement the market started to slip however and in the end was mixed. At the close with the Dow down by -3.00 points to 13,245.00, S&P 500 +.60 points to about 1428.00, S&P 100 +.20 points to 650.00 and the Nasdaq Composite -9.00 points to about 3013.00. Oil was up slightly closing +$.80 around the $87.00 level.
The Fed doesn’t expect to hit its just-established unemployment threshold for hiking interest rates until 2015, according to a summary of the central bank’s latest projections. They see the jobless rate falling to a range between 6% and 6.6% by 2015, compared to 7.7% in November. They also said they would keep interest rates at ultra-low levels so long as the jobless rate was above 6.5%, unless inflation got in the way. Crucially, the Fed doesn’t see inflation hitting its forward-looking upper 2.5% threshold at all, with the highest rate between 1.7% to 2% not until 2015. The inflation guidance for 2013, 2014 and 2015 all were lowered, with next year’s projected year-on-year rise in an inflation measure called the PCE price index seen between 1.3% and 2%, down from September’s forecast between 1.6% to 2%. The Fed also modestly lowered GDP forecasts for 2012 through 2015, though the central bank is still forecasting growth north of 3% in both 2014 and 2015.
Prices paid for goods imported fell -0.9% in November, mainly because of lower energy costs. Economists forecast a -0.5% decline. For October, the import-price index was revised down to an increase of +0.3% from an initial reading of +0.5%. Excluding fuel, import prices fell by -0.2% last month. Fuel costs really fell, down -3% in November. The price of exports to other nations, meanwhile, fell -0.7% last month.
Tuesday, December 11, 2012 4:03 p.m est.
This is interesting going into Christmas: Consumer confidence may be tumbling. According to Bloomberg.com: "Confidence among consumers fell more than forecast in December, reaching a four-month low as Americans grew concerned about the possibility of higher taxes next year. The Thomson Reuters/University of Michigan preliminary consumer sentiment index decreased to 74.5% this month from 82.7% in November. Economists projected a preliminary reading of 82% for December, according to the median of 67 estimates in a Bloomberg survey."
The market yesterday was mostly flat closing slightly mixed but today it took off as there were murmurs going around that the “fiscal cliff” at the end of the year was going to be averted!! The Dow made highs of +150.00 points, S&P 500 +16.00 points and the Nasdaq +60.00 points. The final hour saw selling take hold after Senate Majority Leader Harry Reid said it will be hard to reach a deal before Christmas but the market held most of its gains at the close with the Dow up by +80.00 points to 13,248.00, S&P 500 +9.00 points to about 1428.00, S&P 100 +5.00 points to 650.00 and the Nasdaq Composite +44.00 points to about 3022.00. Oil was up slightly closing +$.25 around the $86.00 level.
Friday, December 7, 2012 4:03 p.m est.
Oh my goodness the government and the market I think are insane!! This morning employment was reported to grow by +146,000 in November and the unemployment rate fell to 7.7%, the lowest level since December 2008. The government came out bragging about the unemployment part of the report moving down to 7.7%, the lowest level of Obama’s presidency however no one mentioned that the reason it was lower was because -350,000 more people fell off the labor force!! For the past six months people have been falling off the workforce every month! Anyhow that is crazy plus the fact that gains for October and September, meanwhile, were revised somewhat lower. The number of new jobs created in October was revised down to +138,000 from +171,000, while September's figure was revised down to +132,000 from +148,000. Then of course there is the workforce participation index that fell to 63.6%, a level not seen since the 1980’s!! This is the percentage of working-age people in an economy who are employed or looking for a job. This means that the actual unemployment rate would be about +11%! Economists had expected an increase of just +120,000 jobs because of the disruption caused by the storm. The unemployment rate was projected to hold steady at 7.9%. It fell mainly because 350,000 people dropped out of the labor force however which is not good news. Employment The biggest increase in hiring in November occurred in retail, professional services and leisure and hospitality The construction and manufacturing sectors reduced employment. Average hourly wages rose +.04 cents to $23.63 in November while the average workweek was unchanged at 34.4 hours.
For some reason the market liked the report and rallied at the open but as the day went on it lost its steam and actually moved into the red a bit midday. Buying did come in the final hour to see the Dow make highs of +85.00 points, but the S&P 500 only saw highs from the morning up +7.00 points and the Nasdaq +25.00 points. At the close the Dow was up by +81.00 points to 13,155.00, S&P 500 +4.00 points to about 1418.00, S&P 100 +2.00 points to 646.00 and the Nasdaq Composite +11.00 points to about 2978.00. Oil was down closing off -$.05 around the $86.00 level.
The preliminary University of Michigan-Thomson Reuters consumer sentiment gauge fell pretty hard in December to a 74.5% reading from 82.7% in November, reports said. That's far below the 82% expected by economists.
Thursday, December 6, 2012 4:03 p.m est.
The market started the day a bit lower with tech stocks leading the way as Apple was off another -$11 but when it turned around so did the market with the Dow seeing highs of +40.00 points, S&P 500 +5.00 points and the Nasdaq even saw a whopping +25.00 points! At the close the Dow was up by +40.00 points to 13,074.00, S&P 500 +5.00 points to about 1414.00, S&P 100 +2.00 points to 644.00 and the Nasdaq Composite +16.00 points to about 2989.00. Oil was down pretty hard closing off -$1.60 around the $86.00 level. Tomorrow we get the most important economic report of the month, Employment. The last few months have been so blah I doubt the market will react much unless there is a big difference than the expected +120,000 number. Right now the market is basically unchanged for the week which is always nice to see for our trades!
Jobless Claims fell by -25,000 to a seasonally adjusted 370,000, the third straight decline and lowest reading in one month. Initial claims from two weeks ago were revised up to 395,000 from an original reading of 393,000, based on more complete data collected at the state level. Economists expected claims to fall to 375,000 as effects of Hurricane Sandy went away. Claims soared after the storm battered the mid-Atlantic in late October. The average of new claims over the past month, meanwhile, edged up by +2,250 to 408,000. The four-week average reduces seasonal volatility in the weekly data and is seen as a more accurate barometer of labor-market trends, but it's also been distorted by the hurricane. Also, continuing claims fell by -100,000 to a seasonally adjusted 3.21 million. Continuing claims reflect the number of people already receiving benefits.
Wednesday, December 5, 2012 4:03 p.m est.
Fiscal Cliff, cliff, cliff is all the mainstream financial press can recite to explain the recent market action. “US Stocks Close Slightly Lower as ‘Cliff’ Worries Weigh” says CNBC. “Wall Street ends down slightly amid cliff talks” says Reuters. “S&P 500 Falls as President Obama Holds Ground on Taxes” says Bloomberg. This is all so interesting and as we approach the holiday season I think it will become more important. Who wants to head into the holidays with debt hanging over your head! The government who thinks it has an endless supply of credit of course!! Our society has had a free ride for about 30-years and its slowly hitting home that the government and ourselves need to pull in the purse strings!
Things are getting interesting in the shorter term as well. As we head toward Friday's employment report, the world seems to be a bit edgy! The "Fiscal Cliff" is getting all the press in America but the “civil war cliff” in Egypt is equally important right now and its not even getting any press! If, and this is a big if, Mr. Morsi's government gets toppled by a coup or a revolution the situation in the Middle East will change rapidly. With the ongoing conflicts in Syria, Iraq, and Afghanistan, this could take on a whole new meaning. In South America there is a major bribery scandal festering in Brazil. Mexico has a new president and Hugo Chavez is reportedly battling a return of his cancer. Cuba wants to start taxing its citizens, finally, and even the famous Putin is out of control in Russia. Another big concern is that China's new leadership is signaling some potentially important changes in the way they may do business and finally of course the global economy is still shaky. Because of all of this alliances may shift with foreign policy likely changing on multiple fronts.
If the "fiscal cliff" hits and there is just a violent change in government in Egypt, the whole geopolitical calculation will shift dramatically in the course of a few days to weeks with all of the countries listed above. It is impossible to predict what will happen to the market but, it is clear that there will be some major shifts and that money will move rapidly from one place to another as we move into the new year!
Today all of this was a worry so the market opened mixed with the Nasdaq under a bit of pressure as Apple was being sold heavily as there were reports out that IDC projected that Google’s Android platform will account for nearly 43% of global tablet shipments for this year, with Apple’s share slipping from 56.3% to 53.8%. Apples stock lost -6.5% alone today. The market started the day mixed even though Globex futures fell on news that Citibank plans on cutting -11,000 jobs and the fact that ADP reported employment to be up but still weak even though hurricane Sandy affected employment out East! The Dow saw early highs of +60.00 points, S&P 500 +4.00 points but the Nasdaq was down -5.00 points as Apple was under pressure. After that selling took hold and midday the Dow saw lows of -30.00 points, S&P 500 -8.00 points and the Nasdaq -40.00 points. Discussion about the “Fiscal Cliff” helped move the market though so the Dow saw highs of +140.00 points, S&P 500 +8.00 points and the Nasdaq even saw a whopping +5.00 points! At the close the Dow was up by +83.00 points to 13,035.00, S&P 500 +2.00 points to about 1409.00, S&P 100 +.20 points to 642.00 and the Nasdaq Composite -23.00 points to about 2974.00. Oil was lower closing down -$.60 around the $88.00 level.
There was slower jobs growth in November as Hurricane Sandy hurt employment, particularly in the manufacturing sector, a payrolls processing firm estimated. There were +118,000 added to the private-sector jobs in November, ADP estimated. The gains were exactly in line with estimates. ADP said Sandy’s wrath cost -86,000 jobs, mostly in the manufacturing, retailing, leisure and hospitality, and temporary help industries. In fact, +16,000 manufacturing jobs were lost during the month, though +23,000 construction jobs were added as the housing industry continues its recovery. The estimated gain from September to October was revised down slightly from the initial estimate of +158,000, to +157,000. The ADP data is used by some to estimate Friday’s jobs report from the federal government, which also includes public-sector positions. ADP recently adopted a new methodology, including increasing its sample size, in an attempt to produce a report more similar to the government’s. Prior to the ADP report, economists had expected to report +80,000 jobs were created last month.
The increase in Productivity in the third quarter was revised up to 2.9% from an initial reading of 1.9%, as companies generated more goods and services than originally estimated. Economists expected productivity to be revised up to 2.8% in the first of the government's two updates to the third-quarter report. The Labor Department said output rose 4.2%, up from a prior estimate of 3.2%, in the July-to-September period. The rise in hours worked last quarter was unchanged at 1.3%. Unit-labor costs, meanwhile, fell by 1.9%, a much bigger drop the than the 0.1% decline initially reported. Unit-labor costs in the second quarter were also revised sharply lower to a 0.5% decline instead of a 1.7% advance. Hourly wages rose +0.9% in the third quarter instead of +1.8%. Yet after adjusting for inflation, wages fell -1.4% vs. an initial reading of a 0.4% decrease. That's the largest drop since the 2011 fourth quarter. In the manufacturing sector, the decline in productivity was revised down to 0.7% from 0.4%. For the second quarter, productivity was unchanged at a +1.9% increase.
Tuesday, December 4, 2012 4:03 p.m est.
The market started the week on the downside yesterday, almost half a percent and today the pressure continued. There was a rebound after the initial open with the Dow seeing highs of +40.00 points, S&P 500 +4.00 points and the Nasdaq only +5.00 points as Apple was under pressure. After that selling took hold and midday the Dow saw lows of -30.00 points, S&P 500 -6.00 points and the Nasdaq -25.00 points. At the close the Dow was down by -14.00 points to 12,951.00, S&P 500 -3.00 points to about 1407.00, S&P 100 -2.00 points to 642.00 and the Nasdaq Composite -6.00 points to about 2997.00. Oil was lower closing down -$.60 around the $88.50 level. The news out is that there will be a deal made before the economy hits the supposed “fiscal cliff” at year end however the market seems to realize that lawmakers will be right back at it in the new year to make changes so that means many companies are left undecided about committing to new projects because they don’t know what it will cost them in the end!
Another reason the market was down yesterday was because manufacturing contracted in November and activity fell to the lowest level since July 2009, as new orders sank and employment plans were scaled back, according to the closely followed ISM index. The Institute for Supply Management index fell to 49.5% from 51.7% in October. Economists had expected the index to remain flat at 51.7%. Reading under 50% indicate more manufacturers are shrinking instead of expanding. The index has now fallen in four of the last six months which is very bad actually and doesn’t make it look like the economy will start the New Year with much strength. The ISM's new-orders gauge sank to 50.3% from 54.2%, although the production index edged up to 53.7% from 52.4%. The employment gauge declined to 48.4% from 52.1%, the lowest level since September 2009.
Friday, November 30, 2012 4:03 p.m est.
The market continued moving higher as it ended the week and month with about a half percent gain for both. If this week wasn't up it would have been a down month! Worries about the Middle East and Fiscal Cliff took the market down a little in the morning with the Dow seeing lows of -20.00 points, S&P 500 -4.00 points and the Nasdaq -5.00 points but the window dressers came out in the final hour to push the Dow to highs of +30.00 points, S&P 500 +3.00 points and the Nasdaq +5.00 points. At the close the Dow was up by +3.00 points to 13025.00, S&P 500 +.20 points to about 1416.00, S&P 100 -.01 points to 647.00 and the Nasdaq Composite -2.00 points to about 3010.00. Oil was higher closing up +$1.00 around the $89.00 level.
Consumer spending in the fell -1.6 in October for the first time in five months while incomes were essentially flat. Economists had forecast a +0.1% rise in spending, seasonally adjusted, and a +0.2% increase in personal income. Since spending fell compared to income growth, the personal savings rate edged up to 3.4% from 3.3%, but it remained near a five-year low. Also, inflation as gauged by the core PCE price index, which excludes food and energy, increased a slight +0.1% last month. The core index is up +1.6% over the past 12 months, the same as in September. The overall CPI index also rose +0.1%. In September, spending was unrevised at a 0.8%increase, though it revised slightly lower for August. Income growth was unrevised for September and August. The government said Hurricane Sandy reduced wages and salaries in October by $18.2 billion, likely contributing to the decline in spending. The storm battered the East Coast in the last few days of the month.
Chicago PMI faintly accelerated in November, rising to 50.4% from 49.9% in October. The index came in just a shade below the 50.5% estimates. Production and employment accelerated, but new orders slumped 5.3 points to 45.3%. Any reading above 50% indicates expansion.
Thursday, November 29, 2012 4:03 p.m est.
The market was mostly on the upside today with hopes of the government fixing the “Fiscal Cliff” problem and the fact that were now moving into month end window dressing! In the shortest of terms its also getting quite overbought so we’ll see how long the rally lasts!! The Dow saw highs of +80.00 points, S&P 500 +10.00 points and the Nasdaq +30.00 points but midday it lost all of its gains as some Republicans started to make some negative comments about the “Fiscal Cliff” debate. At the close the Dow was up by +36.00 points to 13021.00, S&P 500 +6.00 points to about 1416.00, S&P 100 +3.00 points to 647.00 and the Nasdaq Composite +20.00 points to about 3012.00. Oil was higher closing up +$1.10 around the $88.00 level.
The Economy expanded at +2.7% pace in the third quarter, mostly because of higher inventories and exports. The government originally put third-quarter gross domestic product at +2%. The second of two regularly scheduled updates to quarterly GDP includes fresh data not available in the first report. Yet the increase in consumer spending last quarter was cut sharply to a rate of +1.4% from +2% originally, while final sales were trimmed to a +1.9% increase from +2.1%. Inventories rose by $61.3 billion in the third quarter compared to $41.4 billion in the second quarter. Exports were revised up to a +1.1% increase from a +1.6% decline and imports were revised to +0.1% rise from a -0.2% drop. Business capital investment fell a sharper -2.2% instead of -1.3% as originally reported. Investment in equipment and software was revised to a -2.7% decline from a first estimate of no change. The increase in disposal personal income was revised down for the quarter to +0.5% from +0.8%. Inflation as measured by the PCE index rose +1.6%, or by a +1.1% excluding food and energy.
Jobless Claims fell 23,000 to a seasonally adjusted 393,000 while claims from two weeks ago were revised up to 416,000 from an original reading of 410,000, based on more complete data collected at the state level. Economists expected claims to drop to 390,000 as the effects of Hurricane Sandy fade. The four week average rose by +7,500 to 405,250. Also, continuing claims decreased by -70,000 to a seasonally adjusted 3.29 million in the week ended November 17th. Continuing claims reflect the number of people already receiving benefits. About 5.18 million people received some kind of state or federal benefit, down -58,623 from the prior week. Total claims are reported with a two-week lag.
Tuesday, November 27, 2012 4:03 p.m est.
The market was quite volatile today as it started the day higher but it didn’t last long before it moved into the red. An hour later it was back to old highs though with the Dow up by +15.00 points, S&P 500 +3.00 points and the Nasdaq +10.00 points. After another hour it started to fall once again however and the final few minutes of trading saw fresh lows come in. At the close the Dow was down by -90.00 points to 13,010.00, S&P 500 -8.00 points to about 1399.00, S&P 100 -4.00 points to 638.00 and the Nasdaq Composite -10.00 points to about 2968.00. Oil was also lower closing down -$.57 around the $87.00 level.
This is the final week of trading before we move into the final month of the year. The market overall had been up +17% going into the fall before pulling back a bit with the S&P 500 now sitting around the 1400 level, still up about +11% for the year! The 1400 level also represents a 100% recovery from the 2009 lows. On average that's +25% a year. No, we didn't go up in a straight line but the question is will we just meander into year end now since were still up over +10% for the year. Of course you can't keep going up +25% every year but another popular index level has been the 1450 level, which would be a +20% gain for the year. Clearly we still have plenty of economic challenges to deal with, the middle east conflict heating up and the fiscal cliff looming so there are lots of headwinds to hold it back. Corporate Profits are higher now than they were in 2007 however so that should continue to support the 1400 level into year end so I think we’ll likely be between 1400 and 1450 by years end.
Home prices rose in September for the sixth month, signaling that the housing market is "in the midst of a recovery," according to the S&P/Case-Shiller home-price index. The S&P/Case-Shiller 20-city composite posted a +0.3% increase in September following a +0.8% gain in August. Home prices are up +3% from the prior year. "We are entering the seasonally weak part of the year. Despite the seasons, housing continues to improve," said David Blitzer, chairman of the index committee at S&P Dow Jones Indices. Among the 20 cities tracked by the index, 13 posted monthly gains in September. The report on home prices is the latest news on a strengthening housing market. There have also been recent gains in new construction, home-builder sentiment, and existing-home sales. However, while persistently low mortgage rates are attracting some buyers, consumers still face tight credit standards, and officials say factors such as tight lending terms will block a powerful housing recovery. Indeed, despite recent gains, prices are about 30% below peak levels in 2006, according to Case-Shiller data.
Orders for Durable Goods were essentially flat in October, as declines in defense and transportation offset increases in metals, machinery and electrical equipment. Economists had expected orders for durable goods to drop -0.4%. Orders for core capital goods excluding defense and transportation, a key barometer of broad business spending, jumped +1.7% last month, the biggest increase since May. Bookings for transportation equipment, a particularly volatile category, declined -3.1% last month. So far in 2012, orders for overall durable goods have risen +4.9%. Meanwhile, shipments of core capital goods, a number used to help determine gross domestic product, fell -0.4% in October to mark the fourth straight decline.
Consumer confidence rose in November to its best reading in more than four years, according to data released, as growing hopes for the jobs market buoys sentiment. The Conference Board said its consumer confidence index rose to 73.7% in November from 73.1% in October. That's above the 72.2% level forecast and the best level since February 2008. The October reading was upwardly revised from 72.2%. "This month's moderate improvement was the result of an uptick in expectations, while consumers' assessment of present-day conditions continues to hold steady. Over the past few months, consumers have grown increasingly more upbeat about the current and expected state of the job market, and this turnaround in sentiment is helping to boost confidence," said Lynn Franco, director of economic indicators at the Conference Board.
Friday, November 23, 2012 4:03 p.m est.
Interesting: No more Twinkies for you!! Another large company goes down because of Union depends being too strong! Hostess Brands is laying off -18,500 workers because the union has pushed too much citing increased healthcare costs and blaming a strike by bakers as their reason for needing to close. This is ironic given the company is responsible for making highly processed treats!! The company imposed new contracts that cut their salaries, pensions, and health care contributions to stay afloat. Not only will 18,000 employees lose their jobs, 33 bakeries and distribution centers will close, along with nearly 600 outlet stores.
The market was up pretty good this shortened trading week rising about +3.5% in four days. Today the market closed basically at its highs with the Dow up by +175.00 points to 13,010.00, S&P 500 +18.00 points to about 1409.00, S&P 100 +9.00 points to 643.00 and the Nasdaq Composite +40.00 points to about 2967.00. Oil was up but mostly flat on the week even with all of the Middle East news out. It closed up +$.65 around the $88.00 level. The market was up pretty good this week but on low volume and now it is quite overbought in the short term. The low volume rally is very suspicious so we’ll have to see if there is any follow through next week!
Tuesday, November 20, 2012 4:03 p.m est.
Overnight Moody's Investors Service downgraded France's sovereign rating to Aa1 from triple-A saying the country's uncertain fiscal outlook as a result of "deteriorating economic prospects." This caused the market to sell off at the start of the day but as traders decided once again that it doesn’t matter the market came back to move into positive territory with the Dow up +15.00 points, S&P 500 +4.00 points and the Nasdaq +3.00 points.
Moody's said it is maintaining a negative outlook on the country due to structural challenges and a "sustained loss of competitiveness" in the country. Standard & Poor's has a AA-plus rating and negative outlook on France, which it downgraded by one notch in January from AAA. Fitch Ratings has France at AAA, also with a negative outlook.
The loss of AAA rating from two agencies poses a problem for France, as investment funds often require their best assets to have a minimum of two top notch ratings in order to remain in their portfolios.
When Fed chief Ben Bernanke spoke at the New York Economic Club saying that the Fed doesn’t have any weapons to save the government from the “Fiscal Cliff” and that politicians need to stop playing games and get serious about solving the problem, selling began and the Dow saw lows of -100.00 points, S&P 500 -10.00 points and the Nasdaq -20.00 points. Of course once again traders forgot about the news in the final hour and was able to rally back to finish the day mixed. At the close the Dow was down by -8.00 points to 12,789.00, S&P 500 +.90 points to about 1388.00, S&P 100 +.20 points to 633.00 and the Nasdaq Composite +.60 points to about 2917.00. Oil fell after their was a Middle East deal to stop the fighting between Israel and Hamas. It closed down -$2.00 around the $87.30 level.
Construction on New Homes was up +3.6% in October to a seasonally adjusted annual rate of 894,000, the highest rate since July 2008. Due in part to disruptions from Hurricane Sandy, economists had expected a decline in housing starts to a rate of 825,000. However, Hurricane Sandy had a minimal effect because it hit only a small part of the country at the end of the month, government analysts said. By region, starts in October fell -6.5% in the Northeast and -2.5% in the South, while rising +8.9% in the Midwest and +17.2% in the West. Meanwhile, building permits, a sign of future demand, declined -2.7% to a rate of 866,000. Permits for single-family homes rose +2.2% to an annual rate of 562,000 last month, while permits for structures with at least two units fell -10.6%. Starts are up +42% from last year, though the rate remains far below a bubble peak of almost 2.3 million in 2006.
Monday, November 19, 2012 4:03 p.m est.
The market popped higher this morning, rebounding after expiration was finished on Friday. In the short term it was very oversold anyhow so some type of bounce wasn’t surprising! The market rallied right into the close hitting highs with the Dow up by +208.00 points to 12,796.00, S&P 500 +27.00 points to about 1387.00, S&P 100 +14.00 points to 633.00 and the Nasdaq Composite +65.00 points to about 2916.00. Oil also rallied as tension in the Middle East heated up over the weekend as Israel prepared for an all out offensive against Gaza, closing up +$2.25 around the $89.00 level.
There has been a catalyst from the Friday intra day reversal till now anyhow as news has been coming out that Democrats and Republicans are making progress on budget talks, an uncertainty that has cast doubt among many market participants, particularly after the November elections. As these talks progress, be on the lookout for various headlines surrounding the "fiscal cliff" negotiations to move markets one way or the other as the week progresses!
Home-builder sentiment climbed in November for the seventh straight month to the highest level in more than six years. The National Association of Home Builders/Wells Fargo housing market index rose 5 points to a seasonally adjusted level of 46%, the highest point since May 2006. The index now is within striking distance of the 50 mark, which would mean an equal number of builders view sales conditions as good versus poor. The gauge historically tracks closely with single-family housing starts, though of late the magnitude of gains has been stronger with the sentiment index than with the hard data. The component measuring current sales conditions shot up 8 points to 49%, and the component measuring sales expectations for the next six months rose 2 points to 53%. Sill, the component measuring traffic of prospective buyers held unchanged at 35%.
The National Association of Realtors reported a +2.1% monthly gain and a 10.9% year-on-year gain in existing home sales. The number of properties with foreclosure filings dropped -19% in October from a year earlier. Prices of new homes have not dropped nearly as much as for existing homes, with the three-month average of median prices just 5% below its pre-recession peak. Hurricane Sandy did have a minor impact, as the Northeast’s three-month moving average increase of 2 points was the lowest of the four regions. Even without the impact of the hurricane, the Northeast has been lagging each of the three other regions by at least 12 points. That would represent a near doubling of the current rate. Economists expect October’s starts to slip to an annualized rate of 830,000.
Friday, November 16, 2012 9:03 a.m est.
As we move into expiration today there are indications that we are getting closer to a bottom in the market! There are big headlines in the media and on the net that are pretty gloomy! Massive Job Claims, Inflation, Poverty, Recession, Fiscal Cliff and War Looming! Yes it sounds incredibly depressing but this is usually when you know your getting closer to a bottom in the market than a top! The main point though is even if these headlines are true, with our style of trading we only really care about the coming expiration cycle so the question is how much will the market be affected for the coming cycle! For now it looks like we’re going to see full profits on trades and as we enter our final expiration of the year the market is setting up for a nice bounce!
The market remained under pressure yesterday but it wasn’t that bad with the Dow seeing lows of -50.00 points, S&P 500 -6.00 points and the Nasdaq -15.00 points! It was the fourth day in a row the market was lower however and at the close the Dow was down by -30.00 points to 12,542.00, S&P 500 -2.00 points to about 1353.00, S&P 100 -2.00 points to 617.00 and the Nasdaq Composite -10.00 points to about 2877.00. Oil was down -$.65 around the $86.00 level.
The damage caused by Hurricane Sandy sent Jobless Claims soaring by +78,000 to an 18-month high of 439,000, according to the latest government figures. A Labor Department official said claims surged in the eastern parts of the country that laid in the path of the storm. The destruction of job sites, closure of government offices and widespread power outages caused more people to file claims after an initial delay. Economists had expected claims to climb to 380,000 on a seasonally adjusted basis. Initial claims from two weeks ago were revised up to 361,000 from an original reading of 355,000, based on more complete data collected at the state level. The average of new claims over the past month, meanwhile, climbed by +11,750 to 383,750. The four-week average reduces seasonal volatility in the weekly data and is seen as a more accurate barometer of labor-market trends. Continuing claims increased by +171,000 to a seasonally adjusted 3.33 million. Continuing claims reflect the number of people already receiving benefits. About 4.98 million people received some kind of state or federal benefits in the week ended October 27th, down -100,423 from the prior week. Total claims are reported with a two-week lag.
The Empire State manufacturing index contracted for the fourth month in a row, the New York Fed said. The index rose to negative -5.2% from negative -6.2% in October. Economists expected the index to weaken to negative -6.7%. The key new orders sub-index rose above zero for the first time since June and shipments shot up to its highest level since May. However, employment conditions weakened as only 21% of manufacturers reported a loss of activity due to Hurricane Sandy but all firms reported some reduction in activity.
Consumer prices rose +0.1% in October, as higher food and shelter prices offset a decline in energy costs. So-called core prices rose a seasonally adjusted +0.2%. The core figure strips out volatile food and energy costs. Economists had forecast a +0.1% increase in the main CPI and a +0.1% advance in the core rate. Consumer prices have risen an unadjusted +2.2% over the past 12 months, up from +2% in the prior month. Core CPI was unchanged at +2% on a year-over-year basis. Inflation-adjusted hourly wages, meanwhile, fell by -0.2% in October. Real wages are down -0.7 % over the past 12 months.
The Philadelphia Fed's November manufacturing survey turned negative in November, dropping to negative -10.7% from +5.7 in October. Economists had forecast a +3% reading.
Tuesday, November 13, 2012 4:03 p.m est.
The market remains in the doldrums as the market was basically flat all day yesterday and closed mixed with little change in all of the indices!! Today it started the day a bit lower but did move higher midday before falling again to close lower on the day! The Dow was higher by +85.00 points, S&P 500 +9.00 points and the Nasdaq +10.00 points! After that it drifted lower and lower until basically finishing at the lows of the day. At the close the Dow was down by -60.00 points to 12,756.00, S&P 500 -6.00 points to about 1375.00, S&P 100 -3.00 points to 627.00 and the Nasdaq Composite -20.00 points to about 2883.00. Oil was down -$.02 around the $85.65 level.
Last week, the market moved below its 200-day moving average for the first time since early June. Many people think this is bad news and an indication of the market breaking down. The good news is that breaks below the moving average that occur in November have marked very good buying opportunities in the past. It shows the market up, on average, +4% over the next three months and positive 64% of the time. The average return is better than any other month except for December, which sees a +5% return in the three months following a break below the 200-day trendline.
The selling in the market has been pretty good however and two of the reasons are both tech stocks called Apple and Google. Overall there are lots of reasons for selling, fear of higher taxes, on income, capital gains, and dividends. Another is just the general state of affairs and the highly publicized "fiscal cliff." Apple has been driving the market for quite some time and the fact that it and Google are selling is off is scary! Some people think that Apple will never sell another phone or computer and others must think that no one will ever click another ad on Google. This is good for negative sentiment which usually means a bottom is getting closer which is good so maybe history will repeat for November and December once again!
Thursday, November 8, 2012 4:03 p.m est.
As we look forward to another 4 years of President Obama spend thrift ways here is an example of what we could be seeing down the road...Greece just reported that their unemployment rate rose to 25.4% in August, increasing from 24.8% in July as the country struggles through a deep recession. The numbers mark a significant leap from the 18.4% jobless rate in the same month last year. More than 1.2 million people in this country of barely 10 million are now unemployed. More than half, 58% of all young people aged 15-24 are unemployed, the figures showed. The numbers were released a day after Greece's parliament narrowly passed a deeply unpopular austerity bill that will further cut salaries and pensions. The approval of the measures was a key step for Greece to be given the next installment of its vital bailout loans which they will never be able to repay at this rate.
Just to compare, in America just over 50% of all people now pay taxes and is moving lower while there were about 27 million people on food stamps in 2008 and now there are an average 47 million. People are slowly turning from being innovative and hard working to being consumers of free everything as the government supplies everything! Thus the government has gone from a $9 Trillion dollar deficit in 2008 to $15.5 Trillion today! No matter how you look at it something has to be done or we will be in the same situation as Greece, the entire EU and even Japan for that matter in a no time! We are fighting it demographically also as more and more baby boomers retire but that’s another story! The first test comes at the end of the year when the “Fiscal Cliff” hits which is used to describe the conundrum that the government will face at the end of 2012, when the terms of the Budget Control Act of 2011 are scheduled to go into effect.
Among the laws set to change at midnight on December 31st, 2012, are the end of last year’s temporary payroll tax cuts (resulting in a 2% tax increase for workers), the end of certain tax breaks for businesses, shifts in the alternative minimum tax that would take a larger bite, the end of the tax cuts from 2001-2003, and the beginning of taxes related to President Obama’s health care law. At the same time, the spending cuts agreed upon as part of the debt ceiling deal of 2011 will begin to go into effect. As mentioned yesterday Fitch said that they will cut America’s credit rating if something isn’t done and I’m sure other agencies will soon follow suit! Could be an interesting end to the year which is generally a bullish time for the market!
The market started the day a bit higher because it was oversold in the short term with the Dow being higher by +50.00 points, S&P 500 +7.00 points and the Nasdaq +10.00 points! It didn’t last though the Dow saw lows right at the end of the day off -130.00 points, S&P 500 -17.00 points and the Nasdaq -45.00 points but interestingly on very low volume!! At the close the Dow was down by -120.00 points to 12,811.00, S&P 500 -17.00 points to about 1378.00, S&P 100 -6.00 points to 630.00 and the Nasdaq Composite -42.00 points to about 2895.00. Oil was up +$.65 around the $85.00 level.
Jobless Claims dropped by -8,000 to a seasonally adjusted 355,000 distorted by hurricane Sandy. Claims from two weeks ago were unrevised at 363,000, based on more complete data collected at the state level. Economists expected claims to decline to 365,000, but they warned that the storm could make the data unreliable for a few weeks. Many people who were affected in large states such as New York and New Jersey may not have been able to file claims right away. The four-week average of new claims, meanwhile, rose by +3,250 to 370,500, Continuing claims fell by +135,000 to 3.13 million.
The trade deficit narrowed in September to $41.5 billion after exports rose more quickly than imports. Economists had forecast a $45.1 billion deficit. August's trade gap was revised to $43.8 billion.
Tuesday, November 6, 2012 4:03 p.m est.
Well the market really showed what it thought about the Obama victory last night!! From the get go the market was down today and it was definitely the Obama victory as Globex futures last night were higher when Romney was doing well but as soon as Ohio declared Obama the winner they sank off -1% at one point! Today the Dow saw lows of -370.00 points, S&P 500 -41.00 points and the Nasdaq -90.00 points. At the close the Dow was down by -313.00 points to 12,933.00, S&P 500 -34.00 points to about 1395.00, S&P 100 -17.00 points to 636.00 and the Nasdaq Composite -75.00 points to about 2937.00. Oil fell strongly -$3.75 around the $85.00 level.
The other scary thing for the market today was the warning out that Obama will need to quickly secure agreement on avoiding the "fiscal cliff" and raising the debt ceiling following Tuesday's elections, Fitch Ratings said. On current projections, Fitch said, the Treasury Secretary will likely have to implement extraordinary measures by year-end to maintain borrowing capacity under the current debt ceiling of $16.394 trillion. Failure yet again to reach agreement on raising the debt ceiling in a timely manner, not their expectation, would undermine confidence in America as a reliable borrower and thus its "AAA" status, prompting a formal review of the American sovereign rating. Fitch placed the U.S. triple-AAA rating on "negative outlook" on November 28th, 2011, following the failure of the Congressional Joint Select Committee on Deficit Reduction to reach agreement on at least $1.2 trillion of deficit-reduction measures.
The economic policy challenge facing the president is to put in place a credible deficit-reduction plan necessary to underpin economic recovery and confidence in the full faith and credit of America according to Fitch. Resolution of these fiscal policy choices would likely result in the U.S. retaining its triple-A status from Fitch, the firm said. Failure to avoid the so-called fiscal cliff and raise the debt ceiling in a timely manner, as well as securing agreement on credible deficit reduction, would likely result in a rating downgrade in 2013, Fitch said. The fiscal cliff, some $600 billion of tax increases and spending cuts that come into effect on January 1st, 2013 and an increase in the debt ceiling are pressing issues that the president and Congress must address in the coming weeks if the U.S. is to avoid a fiscal and economic crisis. Fitch estimates that the fiscal cliff would tip the U.S. economy into recession and result in an increase in unemployment to more than 10% in 2013. In Fitch's opinion, the tax increases and spending cuts implied by the fiscal cliff would not fully address the longer-term drivers of higher public spending and the relatively narrow and volatile tax base.
Tuesday, November 6, 2012 4:03 p.m est.
Funny: The joke out there today is that with the election today the Democrats will take the lead early on until the Republicans get off work!!!
On Friday even though economic data was pretty good on the jobs front the market ended up selling off in the end pretty strongly down -1%. Yesterday was pretty flat but as election day got going the market rallied with the Dow seeing highs of +170.00 points, S&P 500 +14.00 points and the Nasdaq +20.00 points by midday. It held most of the gains into the close with Dow up by +133.00 points to 13,245.00, S&P 500 +11.00 points to about 1428.00, S&P 100 +5.00 points to 653.00 and the Nasdaq Composite +12.00 points to about 3011.00. Oil was up strongly +$3.00 around the $89.00 level.
The Institute for Supply Management on said its gauge of non-manufacturing activity declined to 54.2% in October from 55.1% in September. Economists expected the index to decline to 54.5%. Readings above 50% indicate expansion. Of key components, the new-orders index, a sign of future demand, fell to 54.8% from 57.7%. The business activity/production index declined to 55.4% from 59.9%. Meanwhile, the employment component rose to 54.9% from 51.1%.
On Friday the economy gained a better-than-expected +171,000 jobs in October and more people were hired in the prior two months than previously believed, but the unemployment rate ticked up to 7.9% from 7.8%. Economists expected a +120,000 increase in jobs, with an unemployment rate of 7.9%. Employment gains for September and August were revised up by a combined +84,000. The number of new jobs created in September was revised to +148,000 from a prior estimate of +114,000, while August's figure was revised to 192,000 from 142,000. The latest jobs report, coming just four days before the presidential election, is unlikely to change the trajectory of the race. Hiring has picked up over the past four months, but unemployment remains high. The biggest increase in hiring last month occurred in professional services, health care, retail and leisure and hospitality. Average hourly wages, meanwhile, fell -1 cent to $23.58. The average workweek was unchanged for the fourth month in a row at 34.4 hours.
Thursday, November 1, 2012 4:03 p.m est.
Interesting: Aging Chinese population threatens manufacturing. According to CNBC.com: "China, the manufacturing hub of the world, is in danger of losing that title." The report added: "Its population is aging fast as its one-child policy, begun in the 1970s, begins to bite. This, in turn, could lead to a huge labor shortfall by 2050, according to experts. China's workforce, those between the ages of 15 and 64, is expected to start contracting beginning in 2015. The number of new entrants into the workforce is already falling and will decline by 30 percent in 2020 compared to 2010, according to Beijing-based research firm GK Dragonomics."
The market was closed for Monday and Tuesday and yesterday it was basically unchanged. Today it opened higher and rallied with the Dow seeing highs of +180.00 points, S&P 500 +18.00 points and the Nasdaq +60.00 points. It held most of the gains into the close with Dow up by +136.00 points to 13,233.00, S&P 500 +15.00 points to about 1428.00, S&P 100 +7.00 points to 653.00 and the Nasdaq Composite +43.00 points to about 3020.00. Oil was up a little +$.80 around the $87.00 level.
Interesting information from Michael Burk as we move into the election next week and a new month!! The market has been following the seasonal pattern quite closely and this week, on average, has been very strong seasonally. Since 1963, over all years, November has been up 65% of the time with an average gain of +1.3%. During the 4th year of the Presidential Cycle November has been up 67% time with an average loss of -0.5%. Since 1928 the market has been up 54% of the time in November with an average gain of +0.4%. During the 4th year of the Presidential Cycle the market has been up 50% of the time with an average gain of +0.3%. With the market getting pretty oversold as we move into the election we could see this bounce continue. Will it hold is the question. The downside is likely to be limited as it is getting pretty oversold and the fact that we have the Fed to turn on the pumps in case there is a bad reaction to the results, at the least volatility will likely continue!
Led by brighter views on present employment and business conditions, a gauge of Consumer Confidence jumped in October to the highest level since February 2008, the Conference Board reported. The consumer-confidence index increased to 72.2% in October from a downwardly revised 68.4% in September. A prior estimate for September pegged the level at 70.3%. "Consumers were considerably more positive in their assessment of current conditions, with improvements in the job market as the major driver," said Lynn Franco, director of economic indicators at the Conference Board, a New York research group. Economists had expected an October level of 73%, citing declining unemployment, among other factors. Generally when the economy is growing at a good clip, confidence readings are at least 90%.
Jobless Claims fell by -9,000 to a seasonally adjusted 363,000, keeping them in a range that indicates little change in hiring patterns over the past few months. Economists expected claims to fall to 365,000. Initial claims from two weeks ago were revised up to 372,000 from an original reading of 369,000, based on more complete data collected at the state level. The number of filings were not affected by Sandy, a Labor analyst said, though the storm could skew the numbers in upcoming weeks. The average of new claims over the past month, meanwhile, fell by -1,500 to 367,250. The four-week average reduces seasonal volatility in the weekly data and is seen as a more accurate barometer of labor-market trends. Continuing claims increased by +4,000 to a seasonally adjusted 3.26 million and reflect the number of people already receiving benefits. About 5.04 million people received some kind of state or federal benefit in the week ended October 13th up +112,147 from the prior week. Total claims are reported with a two-week lag.
Productivity rose +1.9% in the third quarter as the output of goods and services rose faster than the amount of time employees worked. Economists expected productivity to climb by +2%. The Labor Department said output rose +3.2% in the July-to-September period, while hours worked increased at a slower +1.3% rate. Both output and hours worked were up sharply from the second quarter, though all the gains took place outside the manufacturing sector. Unit-labor costs fell by -0.1% after rising +1.7% in the second quarter. Hourly wages rose +1.8%, but after adjusting for inflation, they actually fell -0.4%, the biggest decline in three quarters. In the manufacturing sector, productivity dropped -0.4% following a +0.2% increase in the second quarter. Output and hours both fell, as did inflation-adjusted wages. In the second quarter, meanwhile, productivity was revised down to +1.9% from a prior estimate of +2.2%.
ADP said +158,000 private-sector jobs were created in October, with service-providing jobs accounting for +144,000 positions and service-sector jobs responsible for +14,000 new jobs. This was the first release after ADP adopted a methodology, including increasing the sample size. "Businesses are adding consistently to their payrolls. October's job gains were in line with the average monthly gains of the past two years, with sturdy albeit less than stellar growth across most industries and company sizes. Businesses have turned more cautious in recent months, but that has yet to impact their hiring and firing decisions," said Mark Zandi, chief economist of Moody's Analytics, in a statement.
American manufacturers expanded at a slightly faster pace in October, according to a closely followed survey. The Institute for Supply Management's index of purchasing managers - the executives who order raw materials and other goods - edged up to 51.7% in October from 51.5% in September and a three-year-low of 49.6% in August. The ISM report surpassed expectations. Economists had forecast the index to fall to 50.5%. Readings above 50% indicate business is improving; readings under 50% signal deterioration. New orders rose to 54.2% from 52.3% and the production index gained +2.9 points to 52.4%. The employment and exports indexes declined, however.
Consumer spending rose a seasonally adjusted +0.8%. Spending for August was unchanged at a +0.5% increase. Personal income, meanwhile, rose a slower +0.4% in September. Economists forecast a +0.7% increase in spending and a +0.4% rise in personal income. Since incomes rose slower than spending, the personal savings rate fell to 3.3% from 3.7%. Also, inflation as gauged by the PCE price index increased +0.4% in September. The core PCE index was up +0.1%.
Friday, October 26, 2012 4:03 p.m est.
The market opened slightly down after Globex futures had been down -1% overnight as Apple had a poor earnings report out last night! Their stock now has a huge influence on the market as it has been so strong the past year its percentage in the indices has caused its movement to affect them! Nonetheless after GDP came in better than expected at +2% just before the open the market was able to turn around with the Dow seeing quick highs of +30.00 points, S&P 500 +3.00 points and the Nasdaq +10.00 points. It didn’t last though as everyone looked at the report a little closer and saw that the reason it was higher was because the government spent so much! It is an election year, haha! Apple also started to sell off moving down -$18.00 to $591.00 before rebounding to finish down only -$5.54 at $604.00. The Dow saw lows of -65.00 points, S&P 500 -10.00 points and the Nasdaq -25.00 points. As Apple turned so did the market closing mixed with the Dow up by +3.00 points to 13,107.00, S&P 500 -1.00 points to about 1412.00, S&P 100 -.50 points to 647.00 and the Nasdaq Composite +2.00 points to about 2988.00. Oil was up a little +$.20 around the $86.00 level.
The economy grew +2.0% in the third quarter, fueled by higher consumer and government spending and more home building, according to a preliminary government estimate. Economists projected Gross Domestic Product would rise to +1.7% from +1.3% in the second quarter. Consumer spending, which has the biggest impact on GDP, rose +2.0% in the July-to-September period, compared to +1.5% in the second quarter. Real final sales of U.S.-made goods and services advanced 2.1%, compared to +1.7% in the prior three-month period. Government spending jumped +3.7%, the biggest increase since mid-2009, mainly because of higher defense outlays, it is an election year! Also, investment in housing surged +14.4%. Net imports, which subtract from GDP, fell -0.2%. Exports dropped a sharper -1.6%. Business investment outside the residential sector fell -1.3%, the biggest drop since late 2009. Inflation as measured by the consumer PCE index rose +1.8%, or +1.3% excluding food and energy. Disposable income moved up +2.6%, but that was down from a +3.8% increase in the second quarter. The personal savings rate fell to 3.7% from 4.0% which is never good news.
The final reading of the University of Michigan/Thomson Reuters consumer sentiment indicator edged down to 82.6% from an initially reported 83.1%, which was a bit worse than the 83% forecast. It's nonetheless the highest level since September 2007 and up from 78.3% in September and from 74.3% in August.
Thursday, October 25, 2012 4:03 p.m est.
Yesterday the market was down once again putting the market down -1.5% for the week. Today the market bounced pretty hard out of the gate but fell midday after Moody’s announced that 2013 was likely to be a poor year for consumers! The Dow saw highs of +90.00 points, S&P 500 +12.00 points and the Nasdaq +30.00 points. When the selling took hold the Dow saw lows of -30.00 points, S&P 500 -3.00 points and the Nasdaq -5.00 points. It did bounce back again midday however and going into the final hour all indices were on the upside.
At the close the Dow was up by +26.00 points to 13,103.00, S&P 500 +4.00 points to about 1413.00, S&P 100 +2.00 points to 647.00 and the Nasdaq Composite +29.00 points to about 2986.00. Oil was up a little +$.45 around the $86.00 level.
Pending home sales edged up +0.3% in September after a sharp drop in the prior month. The pending-home-sales index rose to 99.5% from 99.2% in August, the National Association of Realtors said. This is still below the 101.9% level reached in July. Economists were looking for a bigger rebound. "Home contract activity...currently appears to be bouncing around in a narrow range," said Lawrence Yun, chief economist of the NAR. "This means only minor movements are likely in near-term existing-home sales, but with positive underlying market fundamentals they should continue on an uptrend in 2013," he added. Compared to the same period in 2011, pending home sales were up 14.5%, marking the 17th straight month of year-on-year gains. A sale is listed as pending when the contract has been signed but the transaction has not closed, and an index of 100 is equal to the average level of contract activity during 2001. In contrast, existing home sales are recorded when a mortgage is closed, implying there is usually a one-to-two month lag between the series.
Jobless Claims fell by -23,000 to a seasonally adjusted 369,000, in line with market expectations. Claims from two weeks ago were revised up to 392,000 from an original reading of 388,000, based on more complete data collected at the state level. New claims have jumped up and down over the past three weeks because of seasonal quirks and other technical problems with the government's weekly data, mainly involving the state of California. The four-week moving average, was little changed, rising +1,500 to 368,000. Continuing claims fell by -2,000 to a seasonally adjusted 3.25 million and reflect the number of people already receiving benefits. About 4.92 million people received some kind of state or federal benefit in the week ended October 6th down -84,525 from the prior week. Total claims are reported with a two-week lag.
Orders for durable goods soared +9.9% in September, mainly because of a rebound in aircraft bookings. Economists had expected a +8.3% increase. Excluding transportation, new orders rose a much smaller +2%. Core durable-goods orders, demand for capital goods excluding defense and aircraft - were unchanged last month after rising a scant +0.2% in August. Shipments of core capital goods, a number used to help calculate quarterly gross domestic product, fell -0.3% last month. It declined in all three months of the third quarter. The drop in durable-goods orders in August, meanwhile, was revised slightly to +13.1% from +13.2%.
Yesterday it was reported that Sales of new single-family homes rose +5.7% in September to a seasonally adjusted annual rate of 389,000, the highest pace since April 2010. The sales pace in August was revised down to 368,000 from a prior estimate of 373,000. Economists had expected new-home sales in September to rise to an annual rate of 387,000, given recent gains in other housing-market data, such as confidence among home builders, as well as housing starts and permits. The median sales price in September declined -3.2% to $242,400. The supply of new homes declined to 4.5 months at September's sales rate from 4.7 months in August. By region, sales in September fell only in the Midwest. Despite the gain in September, the pace of new home sales remains relatively low compared with a peak of almost 1.4 million in 2005.
Friday, October 19, 2012 4:03 p.m est.
Today is the 25th anniversary of the 1987 stock market crash where the Dow fell -508.00 points in one day! It doesn’t sound like a lot nowadays but it was down -22.6%, the biggest decline ever in one day! I remember it like it was yesterday because amongst the panic at the brokerage of brokers and their clients, some of us were in buying hand over fist as stocks were so cheap! I still remember waiting about four hours after the market closed to find out some of my fills because the tape was so far behind it took forever to find out your prices!!
This would never happen today in our electronic world as fills are instantaneous but one thing that has happened because of it is a flash crash! The most infamous example being the so-called “flash crash” of May 2010 when the Dow fell -9% and recovered minutes later. If you blinked you missed it!! The most painful crash since the biggest one in 1929 was the crash of 2008 when the market fell for eight straight trading days seeing the Dow drop a total of -2,399.47 points or -22.11%. It was similar to 1987 but every day seemed to give you hope to then end the day down again! I think that was more painful then a one day event!!!
So the question of course is will we see another crash, I’m sure we will and is always something to be wary of especially in October when it seems all of these crashes seem to occur however another thing to be wary of is that the 2008 crash was a major one and they only occur once every decade so were not due for one yet! I also think it will be a while before we see another 1987 or 2008 because it is still in the minds of many traders as volume today is lower on average than the day of the 1987 crash!
We’re also in an election year and they don’t generally happen then.
Today the market seemed to honor the 87 anniversary with the market selling off quite strongly all day! At its lows the Dow was off -240.00 points, S&P 500 -29.00 points and the Nasdaq -75.00 points before bouncing back a little before the closet. At the close the Dow was down by -206.00 points to 13,344.00, S&P 500 -24.00 points to about 1433.00, S&P 100 -11.00 points to 657.00 and the Nasdaq Composite -67.00 points to about 3005.00. Oil was down hard -$2.05 around the $90.05 level.
Sales of existing homes fell -1.7% in September to a seasonally adjusted annual rate of 4.75 million from a slightly upwardly revised rate of 4.83 million in August, the National Association of Realtors reported. Economist had expected a rate of 4.8 million for September. The median existing-home price rose +11.3% from the prior year, the largest annual gain since November 2005. Inventories declined -3.3% to 2.32 million units in September, representing 5.9 months of supply at the current sales rate, the first reading below six months since March 2006.
Thursday, October 18, 2012 4:03 p.m est.
Food stamps enrollment has hit a new record high of 46,681,833 million now enrolled in the social welfare program, according to the United States Department of Agriculture, the federal department that runs the program. They also said the cost is astronomical. "Total spending on food stamps is projected to reach nearly $800 billion over the next 10 years, with no fewer than 1 in 9 people on the program at any given time. Neither food stamp participation nor spending on the program are ever projected to return to pre-recession levels at any point in the next 10 years."
The market had been up all week and was higher today with the Dow up +40.00 points, S&P 500 +4.00 points and the Nasdaq +5.00 points before Google came out with an intraday earnings release that was terrible so the market started selling off! At its lows the Dow was off -20.00 points, S&P 500 -6.00 points and the Nasdaq -40.00 points as all tech stocks have been under pressure of late and under preforming the broader market. At the close the Dow was down by -8.00 points to 13,549.00, S&P 500 -4.00 points to about 1457.00, S&P 100 -3.00 points to 668.00 and the Nasdaq Composite -31.00 points to about 3073.00. Oil was pretty flat down +$.07 around the $92.00 level. As we go into expiration tomorrow were looking great for full profits and settling up nicely for the coming months cycle! The market is now slightly overbought so a pullback is in order but we'll see over the weekend if it will be sustainable or just another break before a turn higher!
Construction on new homes accelerated by +15% in September to an annual rate of 872,000, easily surpassing estimates and marking the highest level in more than four years. Building permits, a sign of future demand, also shot up to a four-year high, rising +11.6% to an annual rate of 894,000. Permits for single-family homes, which account for about three-quarters of the housing market, rose +6.7% to an annual rate of 545,000 last month. Permits for multi-dwelling units, a more volatile category, rose three times faster. The latest report underscores the continued momentum in the housing market, which is gradually recovering from its worst slump in modern times. Economists had expected starts to climb to an annual rate of 770,000 on a seasonally adjusted basis. Housing starts in August, meanwhile, were revised up to 758,000 from an original reading of 750,000. Permits in August were revised down slightly to an 801,000 annual rate. In September, housing starts rose in all regions except the Northeast, with construction almost equally strong in the West and South.
This morning it was reported that Jobless Claims jumped +46,000 to a seasonally adjusted 388,000, erasing the sharp drop from the prior week. Claims had fallen two weeks ago to a four-year low, but the decline mainly stemmed from a statistical quirk in the data that often happens at the end of a quarter and it was not reflective of a rapidly improving labor market. Initial claims from two weeks ago were revised up to 342,000 from an original reading of 339,000, based on more complete data collected at the state level. Economists expected claims to rise to 365,000 in the most recent week. The average of new claims over the past month, meanwhile, edged up by +750 to 365,500. The four-week average reduces seasonal volatility in the weekly data and is seen as a more accurate idea of labor-market trends. Continuing claims decreased by -29,000 to a seasonally adjusted 3.25 million. Continuing claims reflect the number of people already receiving benefits. About 5.0 million people received some kind of state or federal benefit in the week ended Sept. 29th, down -42,664 from the prior week. Total claims are reported with a two-week lag.
Manufacturing activity in the Philadelphia region rebounded to show modest improvement in October, the Fed’s Bank of Philadelphia reported. The Philly Fed diffusion index rose to +5.7% in October from negative -1.9% in September. This is the first positive reading after five straight monthly reading below zero, indicating contraction. The increase in the index was larger than expected. Economists were looking for the index to improve to zero in October. However, details of the report were mixed. The key new orders index slipped into negative territory. There was a sizable gain in shipments. The index for number of employees fell to negative -10.7% from negative -7.3%.
Monday, October 15, 2012.
Interesting: According to The Wall Street Journal: The "Fiscal Cliff" will consist of the following: "Come Jan, 1, under current law, the Bush-era tax cuts will expire. So will the temporary reduction in the payroll tax that has been in place since 2011. So will the extended unemployment benefits that now provide income to two million job seekers. And without a new temporary "patch," millions of Americans will owe money under the Alternative Minimum Tax." The Journal added: "All told, the policies amount to a roughly $400 billion tax increase, according to estimates from the Congressional Budget Office. The Tax Policy Center estimates that nearly 90% of Americans would see their taxes rise, with the average household paying almost $3,500 more in 2013, although the impact would vary widely by income."
Yesterday the market today started the day higher and remained there all day closing near highs but on low volume. At the close the Dow was up by +95.00 points to 13,424.00, S&P 500 +12.00 points to about 1440.00, S&P 100 +5.00 points to 662.00 and the Nasdaq Composite +20.00 points to about 3064.00. Oil was flat up only +$.02 around the $92.00 level.
This is an expiration traded week as all of the October options go off the board and November becomes the front month. We’re looking great going into expiration even five days out and generally the week of expiration remains pretty flat at least until Wednesday when volatility starts to kick up as traders roll into the next month. The market is getting a bit oversold here so we’ll likely see a slightly up week but I wouldn’t expect to much action!!
Retail sales rose a seasonally adjusted +1.1% in September, as spending rose for every segment except department stores, the Commerce Department. Excluding autos, which can have an outsized impact on the report, retail sales also rose +1.1%. Economists expected retail sales to rise by +0.9% last month, or by +0.8% minus autos. In addition, revised sales figures for August and July to show somewhat higher spending. Retail sales climbed +1.2% in August, the fastest rate in almost two years instead of +0.9% as previously reported. And the increase in July sales was revised up to +0.7% from +0.6%. The biggest increase in sales in September took place among stores that sell electronics and appliances, likely boosted by the release of the new iPhone. Sales in that category leaped +4.5%, the biggest increase since October 2011. Gasoline-station sales rose +2.5% and auto sales increased +1.3%.
The Empire State manufacturing index increased slightly but remained in negative territory for the third straight month, the New York Fed said. The index rose to negative -6.2 in October from negative -10.4 in September, which was its weakest reading in almost two years. Economists expected the index to improve to negative -4. The key new orders sub-index rose to negative -9.0 in October from negative -14.0 in September. However, unfilled orders, another forward-looking component, fell to negative -18.3 in October from negative -14.9 in September. Employment conditions weakened, with the index for number of employees falling to negative -1.1 from -4.3 in the previous month. An index of expectations of activity six months ahead slipped to 19.4 in October from 27.2 in September. While positive, it is well below levels seen earlier in the year.
Friday, October 12, 2012
Interesting: Times they are a changing!! PC sales are crash and burning. "Personal computer sales in the third quarter encountered their steepest drop in more than a decade, research firms said. IDC and Gartner Inc. reported that worldwide PC shipments in the third quarter contracted by the highest amount since at least 2001 compared to the same time a year ago. Another research firm, IHS iSupply, said it expected shipments of personal computers around the world to fall -1.2% this year, the first time in over a decade that the market suffered such a decline." Pollster sees no need for Romney to work Florida, North Carolina, and Virginia. According to Business Insider.com: "David Paleologos, the director of the Suffolk University Political Research Center, dropped a bombshell on The O'Reilly Factor last night. He told Bill O'Reilly that the center would not be polling in the three key swing states of North Carolina, Florida and Virginia, because it would not be a prudent use of resources. Why? Because Paleologos said Republican nominee Mitt Romney has all three states in the bag.”
Spain was downgraded to just one point over junk status this week to (BBB-) with a negative credit watch by S&P last but it was more of a "buy on the news" as it's certainly not a shocker that Spain's paper is worthless without the ESM backing. Yields on 10-year Spanish bonds shot up 9 basis points to 5.89% but stopping short of 6% was considered a positive so European markets were a bit higher this morning!
The market has been pretty quiet all week but on the downside every day! The reason is mostly because of plain old profit taking and the earnings outlook for companies is looking pretty dismal. Another factor was that Apple was tanking now down over -10% from its recent record high of $705.00! There was also the news report out earlier in the week that the IMF reported that the world is once again slipping into recession. "The global economy risks skidding toward recession just three years after pulling out of the previous one,"the IMF, International Monetary Fund warned adding that fighting a renewed world-wide downturn will be much more complex than it was in 2009. "Risks for a serious global slowdown are alarmingly high," said the IMF's World Economic Outlook report, which was released this morning, ahead of the fund's annual fall meeting. It was its bleakest assessment of global growth prospects since the 2009 recession. Although this is something very important the most we should see from the market is a sideways move as poor earnings, recessions, the election will likely hold it back from going too high but the downside will also be limited as the Fed will jump in with stimulus to support it from going down too much!! According to Mark Hulbert, from Marketwatch.com: "two of the most prominent market turning points of the last decade occurred on this very date. The first was the beginning of the 2002-07 bull market, which occurred Oct. 9, 2002. The second of those major turning points came as that 2002-2007 bull market was coming to an end. Believe it or not, its exact end was on — you guessed it — Oct. 9, 2007." There are lots of cycle guys out there I’m sure in agreement to this so if it turns out that Hulbert's observation is correct, we may be in the very early stages of a bear market! We’ll see but this week was definitely not a good day for the market.
Today the Dow saw lows of -40.00 points, S&P 500 -8.00 points and the Nasdaq -10.00 points. At the close the Dow was up for the first day all week by +2.00 points to 13,329.00, S&P 500 -4.00 points to about 1429.00, S&P 100 -2.00 points to 657.00 and the Nasdaq Composite -5.00 points to about 3044.00. Oil was down a bit by -$.40 but only remaining around the $92.00 level.
Wholesale prices rose +1.1% in September after seasonable adjustments, led by a strong gain in energy prices. The producer price index has risen +2.1% in the past year. Energy prices advanced +4.7% in September after rising +6.4% in August. Food prices rose +0.2%, the fourth consecutive increase. The core PPI - which excludes food and energy prices, was flat in September, less than expected. Core prices are up +2.3% in the past year. Economists expected a +1% rise in the headline PPI and a +0.2% increase in the core rate. The PPI had risen +1.7% in August, while the core rate was up +0.2%.
Consumer sentiment has jumped up for a second month, pushing past analysts’ expectations to stand at the highest level in more than five years, according to the University of Michigan-Thomson Reuters consumer-sentiment gauge rising to 83.1% in a preliminary October reading, the highest level since September 2007 from a final September reading of 78.3%. Economists had expected little change, forecasting the index to fall to 78% in early October.
According to the University of Michigan, a gauge of consumer expectations rose to 79.5% from 73.5% in September, while the barometer of consumers’ views on current conditions increased to 88.6% from 85.7%. The sentiment gauge, which covers how consumers view their personal finances as well as business and buying conditions, averaged about 87% in the year before the most recent recession. Economists watch sentiment data to get a feel for the direction of consumer spending.
Yesterday it was reported that Jobless claims for state unemployment benefits fell sharply in the latest week to their lowest level since mid-February, the Labor Department. The number of initial claims fell -30,000 to 339,000. The decline was unexpected. The forecast was for claims to rise +1,000 to 368,000 however one State didn’t report so the numbers were skewed. The four-week average fell -11,500 to 364,000 and is the lowest level since late March.
Monday, October 8, 2012
Yesterday the market was pretty quiet being a half holiday as the bond market was closed. The market was lower on the day. The market was down again today more on plain old profit taking as the earnings outlook for companies is looking pretty dismal and the IMF reported that the world is once again slipping into recession. The Dow saw lows of -110.00 points, S&P 500 -15.00 points and the Nasdaq -50.00 points just before the close. Another factor was that Apple was tanking now down over -10% from its recent record high of $705.00!
"The global economy risks skidding toward recession just three years after pulling out of the previous one,"the IMF, International Monetary Fund warned adding that fighting a renewed world-wide downturn will be much more complex than it was in 2009. "Risks for a serious global slowdown are alarmingly high," said the IMF's World Economic Outlook report, which was released this morning, ahead of the fund's annual fall meeting. It was its bleakest assessment of global growth prospects since the 2009 recession. Although this is something very important the most we should see from the market is a sideways move as poor earnings, recessions, the election will likely hold it back from going to high but the downside will also be limited as the Fed will jump in with stimulus to support it from going down too much!!
At the close the Dow was down by -110.00 points to 13,473.00, S&P 500 -14.00 points to about 1441.00, S&P 100 -6.00 points to 663.00 and the Nasdaq Composite -47.00 points to about 3065.00. Oil was up huge today +$3.00 but only being around the $92.00 level still as it has been under pressure of late.
Friday, October 5, 2012
Poll: Those who earn at least $250,000 per year plan to hold on to their wallet in a second Obama term. According to CNBC.com: "a new poll shows that people earning at least $250,000 a year will spend more money if Mitt Romney wins the election. The latest Mendelsohn Affluent Barometer showed that 43% of the $250,000-plus earners would spend more if Romney is elected. Only 18% of them would spend more if President Barack Obama is re-elected. Just 39% said the election will have no impact on their spending."
The Dow market has been slightly up all week and with today’s report on Employment coming out, lets say interesting, the market rallied some more. The Dow saw highs of +90.00 points, S&P 500 +10.00 points and the Nasdaq +25.00 points. Midday there was a lot of talk out about the numbers being “manipulated” to help Obama look better! The market also fell because Apple was down over -$14.00 and oil over -$2.00.
At the close the Dow was up by +35.00 points to 13,610.00, S&P 500 -.50 points to about 1461.00, S&P 100 +-.75 points to 672.00 and the Nasdaq Composite -13.00 points to about 3136.00. Oil was down -$2.00 around the $90.00 level.
Employment came in this morning at +114,000 jobs in September, but the unemployment rate fell to 7.8% from 8.1%, the lowest level since January 2009. Economists expected a +110,000 increase in jobs. The unemployment rate, which is drawn from a separate survey of households, was forecast to move to 8.2% from 8.1%. Yet the jobless rate fell sharply after the biggest increase in employment as measured by the household survey since 1983. Some +873,000 people in the household survey said they found jobs however +600,000 of these were only part time so the number was skewed quite a bit. Employment gains for August and July, meanwhile, were revised higher by a combined +86,000. The number of new jobs created in August was revised up to +142,000 from an original estimate of +96,000. July's figure was revised up to +181,000 from +141,000. Average hourly wages rose +7 cents, or +0.4%, to $23.58. The average workweek edged up 0.1 hour to 34.5.
Monday, October 1, 2012
Very Interesting: France unveiled their austerity budget on Friday revealing that they would tax business and the super rich at a 75% rate!! In reality they say the super rich are people or companies making more than about $1.29 million American dollars!
The market started the day higher because many EU countries passed the supposed stress tests for their banks over the weekend and Spain declared that they would get some new loans next year to take their debt to GDP level to 91%! Nothing to worry about there!! It then took off when the National number about manufacturing came out a bit better than expected and wasn’t negative for a fourth straight month! The Dow saw highs of +160.00 points, S&P 500 +18.00 points and the Nasdaq +35.00 points. When tech stocks started to slip, aka Apple, selling took over and the final hour saw most of the gains disappear and the Nasdaq actually fall -15.00 points. At the close the Dow was up by +78.00 points to 13,515.00, S&P 500 +4.00 points to about 1444.00, S&P 100 +2.00 points to 665.00 and the Nasdaq Composite -3.00 points to about 3114.00 on weaker volume. Oil was up +$.31 around the $92.50 level.
The manufacturing sector expanded in September for the first time in four months, according to the Institute for Supply Management's manufacturing gauge rising to 51.5% last month from 49.6% in August, the highest reading since May. Economists had expected the index to be at 49.7%. Reading over 50% indicate that more manufacturers are expanding instead of contracting. The ISM had been below 50% for three straight months until the September reading. The ISM's new-orders reading jumped to 52.3% from 47.1% to power the increase in the overall index, while the production index rose to 49.5% from 47.2%.
Construction projects fell for the second month in August. Construction spending fell -0.6% in August, well below analysts' expectations of a +0.5% gain. The decline in July construction spending was revised up to a -0.4% decline from the previous estimate of a -0.9% drop. In August, spending on private construction fell -0.5% while spending on public projects fell -0.9%. One bright spot was a +0.9% gain in private homebuilding in the month.
Thursday, September 27, 2012
The market was up today as the market was quite oversold in the shortest of terms. The Dow saw highs of +90.00 points, S&P 500 +15.00 points and the Nasdaq +45.00 points. The final hour saw It pull back a bit, at the close the Dow was up by +72.00 points to 13,486.00, S&P 500 +14.00 points to about 1447.00, S&P 100 +6.00 points to 667.00 and the Nasdaq Composite +43.00 points to about 3137.00. Oil was up also +$2.00 around the $92.00 level.
There are signs that a global economic slowing is gathering steam. The world's largest shipping company, Maersk, is cutting capacity and the announcement coincides with two other significant developments. One is that bond yields are starting to fall and the other is that oil prices may have broken down. When viewed by the context of a new round of aggressive easing from global central banks, suggests that a sudden drop in the global economy may lie ahead. When you add the election issues into it, it makes you think!
The Social Cycle describes the evolution of societies through four distinct eras. The Laborer Era, where people start to revolt against the establishment, the Warrior stage where the military takes over but eventually the Intellectual Stage softens the Warrior Stage, which gives way to what is called the Acquisitor Stage where the accumulation of wealth is in itself the power. America has been in an Acquisitor Stage for the past 30 or so years but it broke down when the sub-prime mortgage crisis erupted. The transition back to a Laborer Stage began at that time. It has been more visible in the Arab Spring, and Greece but it is spreading. Spain is on the verge of such a stage being fully manifested and ever so slowly the U.S is becoming more evident.
Much of this could depends on who wins the election. The Obama administration actually thwarts big business from hiring workers because it favors wealth redistribution and government control of the means of production, distribution and so on. Reuters reported "Some 34% of U.S. CEOs plan to cut jobs in the United States over the next six months, up from 20% a quarter ago, according to a Business Roundtable survey released on yesterday. Only 30% plan to raise capital spending, compared with 43% previously."
It then makes sense to consider the possibility that an Obama re-election could well lead to massive layoffs at all levels of industry and business, as business owners fear an acceleration of government controls, higher taxes, regulation and all of the things that have already become evident in an Obama presidency. This mornings economic data seems to reveal that going into the election a contraction is clearly on its way and if Obama wins it will continue. What will be interesting to watch is how the market will move discounting the possible winner. It appears that if Obama is going to win the market will likely be flat to down going into the election. If Romney looks like he might win we could see a rally going into it! For us its perfect to see neutral polls because it means the market should remain flat, perfect for our trading methods!!
Orders for durable goods sank -13.2% in August, the biggest one-month decline in more than three years, as bookings for autos and aircraft fell sharply, obviously the Fed knew something when they were talking about. Economists had expected a decline of -5.3%. Excluding the volatile transportation sector, whose bookings can swing sharply from month to month, orders fell a much smaller -1.6%. Orders for core capital goods, which exclude defense and aircraft, actually rose +1.1% after a -5.2% decline in July. Shipments of durable goods fell -3% in August, while inventories rose +0.6%. Orders for July were revised down to a +3.3% increase from an initial report of a +4.1% gain. Shipments of core capital goods, a number used to help calculate gross domestic product, fell -0.9% in August to mark the second straight decline.
The government cut its calculation of U.S. growth in the second quarter to +1.3% from +1.7% in its third and final review, citing less consumer spending and business investment than previously estimated. Consumer spending rose +1.5% in the previous quarter instead of +1.7% as initially forecast. and business investment, excluding residential housing, was revised down to a +3.6% increase from +4.2%. The government also said corporate profits climbed $21.8 billion in the second quarter, compared to a $53.0 billion decline in the first quarter. The economy grew at a +2% pace in the first three months of the year.
Jobless Claims dropped -26,000 to a seasonally adjusted 359,000. That's the lowest level since late July. Economists expected claims to fall to 375,000 so that's sort of good news after dismal Durable Goods and GDP numbers. Initial claims from two weeks ago were revised up 385,000 from an original reading of 382,000, based on more complete data collected at the state level. The four week average fell by -4,000 to 374,000. The four-week average reduces seasonal volatility in the weekly data and is seen as a more accurate barometer of labor-market trends. Continuing claims decreased by -4,000 to a seasonally adjusted 3.27 million. About 5.17 million people received some kind of benefit in the week ended September 8th, virtually unchanged from the prior week. Total claims are reported with a two-week lag.
Pending home sales retreated in August after hitting a two-year high in the previous month, a trade group reported. The pending-home-sales index fell to 99.2% from a upwardly revised 101.9% in July, the National Association of Realtors said. The NAR initially said the July index was at 101.7%. "The performance in month-to-month contract signings has been uneven with ongoing shortages of lower prices inventory in much of the country," said Lawrence Yun, chief economist of the NAR. Compared to the same period in 2011, pending home sales were up +10.7%, marking the 15th straight month of year-on-year gains. A sale is listed as pending when the contract has been signed but the transaction has not closed, and an index of 100 is equal to the average level of contract activity during 2001.
Wednesday, September 26, 2012
The market was down again today although at the start of the day the Dow was resistant but eventually gave way as Spain’s Eurobond yield hit fresh new highs and there were more Greek protests over future cutbacks the government is trying to implement!! The Dow saw lows of -60.00 points, S&P 500 -12.00 points and the Nasdaq -40.00 points. It came back midday to almost get back into positive territory but in the end at the close the Dow was down by -44.00 points to 13,413.00, S&P 500 -8.00 points to about 1433.00, S&P 100 -4.00 points to 6651.00 and the Nasdaq Composite -24.00 points to about 3094.00. Oil was down all day now under the $90 level even though gas is at record highs. It closed down by -$1.00 around the $90.00 level.
Sales of new single-family homes fell slightly in August to a 373,000 annual pace from July's slightly revised level of 374,000. The sales pace in July, originally reported as 372,000, was the highest since April 2010. Economists expected new home sales last month to total about 380,000 on an annualized basis. The median sales prices, meanwhile, soared +11.2% in August to $256,900, the single biggest monthly increase ever recorded. The supply of new homes on market remained steady at 4.5 months. Sales rose in all regions except the South, where the housing market has generally been strongest.
Tuesday, September 25, 2012
Interesting: Pensions are still in trouble despite cuts! According to The Wall Street Journal: "Almost every state in the U.S. has made cuts to its public-employee pensions,but the measures have fallen short of bridging a nearly $1 trillion funding gap."
Guess what the market can go down! The market was up pretty good this morning with the Dow seeing highs of +80.00 points, S&P 500 +8.00 points and the Nasdaq Composite +20.00 points but after some Federal Reserve leaders came out talking about tighter fiscal policy the market started to sell off and the Dow saw lows of -110.00 points, S&P 500 -16.00 points and the Nasdaq -45.00 points basically the lows of the day. At the close the Dow was down by -101.00 points to 13,457.00, S&P 500 -15.00 points to about 1442.00, S&P 100 -6.00 points to 665.00 and the Nasdaq Composite -43.00 points to about 3117.00. Oil has been under pressure for the past week down again today by -$1.00 around the $91.00 level. Its good that the market is finally correcting a bit here and it would be good to see even a further correction to relieve the overbought condition it is in.
Led by expectations, a gauge of consumer confidence jumped up in September to the highest level in seven months, but remained relatively low, the Conference Board reported. The consumer-confidence index increased to 70.3% in September, the highest level since February, from a revised 61.3% in August. A prior estimate for August pegged the level at 60.6%. September expectations increased for employment and business conditions, while consumers views on the present situation also rose. Economists had expected confidence to increase to 65% in September, driven by higher stock prices.
Home prices rose in July for the fourth straight month to reach their highest level in nearly two years, according to an index. The S&P/Case-Shiller 20-city composite posted a +1.6% increase in July, following s +2.3% advance in June. For the third month in a row, all 20 cities in the index recorded prices gains. The rise in prices reflect growing demand for new and pre-owned homes following the real-estate market’s worse slump in modern times. Ultra-low interest rates make owning a home more affordable and a mildly improved economy is drawing in buyers who previously were reluctant to make such a big financial commitment. Although home prices have risen +1.2% over the past 12 months, they are still about 30% lower compared to the market’s peak in 2006, the Case-Shiller index found. The biggest price increases in July occurred in Minneapolis, Detroit, Chicago and Atlanta. The smallest was in Cleveland.
Thursday, 10:30 am est. September 20, 2012
Interesting: 49 million people in American don’t know where their next meal is coming from and 16 million of them are children!
So far this has been a quietly traded expiration week! The market was down both Monday and Tuesday but only about -0.5% in total and was up pretty good Wednesday as we moved into the final two days of trading until the September quadruple witch expiration. Gains didn’t hold in the final hour though so it once again closed mostly flat. At the close the Dow was up by +13.00 points to 13,577.00, S&P 500 +2.00 points to about 1461.00, S&P 100 +.50 points to 672.00 and the Nasdaq Composite +5.00 points to about 3183.00. Oil has been collapsing this week as it entered the week around the $100 level closing down hard again today by -$4.00 around the $92.00 level. This morning the market is down pretty hard because of poor economic data out of China and here but is most likely being expiration related as traders roll over into October. The Dow so far has seen lows of -80.00 points, S&P 500 -12.00 points and the Nasdaq 30.00 points!!!
The biggest thing is that it seems that the euphoria about another stimulus program last week has seemed to have worn off!! Maybe they need another fix? The market has been flat but China's Shanghai Composite index has fallen -3% in the first two days of the week, giving up all of the Fed’s gains of QE3, not to mention China's own generous stimulus last week and Japan’s this week, falling back to levels not seen since 2009!!! Our own data continues to come in poorly with Monday's Empire State Manufacturing Survey at a poor -10.41%, putting us steeply into contraction!! Later in the week we see another reading on the Global PMI reading possibly confirming the Global Recession. China’s PMI came in at 48.7% up very slightly from 47.6% last month. This is China's 11th consecutive month of contraction in manufacturing and the Shanghai Composite index dropped another -2% overnight to re-test the 3-year low at 250.
There was good news on the Housing area as optimism from home builders climbed in September for the fifth straight month to reach the highest level in more than six years, according to a closely followed index on Tuesday. The National Association of Home Builders/Wells Fargo housing market index gained 3 points to a seasonally adjusted reading of 40%, the highest the index has been since June 2006. Economists had anticipated a reading of 38%. The index is still not at the 50 level indicating good conditions but has climbed from as low as 8% during the recession. The index didn't even break 20% until December 2011.
This morning it was released that Jobless claims fell by -3,000 to a seasonally adjusted 382,000. Economists expected claims to drop to 375,000. Initial claims from two weeks ago, partly inflated by hurricane Isaac, were revised up to 385,000 from an original reading of 382,000. The four week average meanwhile, rose by +2,000 to 377,750, the highest level since late June. The four-week average reduces seasonal volatility in the weekly data and is seen as a more accurate on market trends. Continuing claims decreased by -32,000 to a seasonally adjusted 3.27 million. About 5.17 million people received some kind of state or federal benefit, down -217,823 from the prior week. Total claims are reported with a two-week lag.
Business among manufacturers in the Philadelphia region improved modestly in September, the Philadelphia Fed said. The bank's business-conditions index rose to -1.9% from -7.1% in August. Economists expected the index to rise to -4. The Fed also reported that the index for new orders rose to 1.0 in September from -5.5 in the prior month. The index for employment increased to -7.3 from -8.6 in August. The shipments index, however, dropped to -21.7 from -11.3.
Economic growth is "unlikely to change much" in the near term, the Conference Board said as it reported that its leading economic index ticked down -0.1% in August, matching forecasts, while a longer-term trend remained positive. "The economy continues to be buffeted by strong headwinds domestically and internationally...Weak domestic demand continues to be a major drag," said Ken Goldstein, an economist at the Conference Board, a New York research group. The LEI increased a revised +0.5% in July, compared with a prior estimate of +0.4%. The LEI is a weighted gauge of 10 indicators that are designed to signal business cycle peaks and troughs. Six of the 10 indicators made negative contributions in August, led by new orders for manufacturers. The biggest positive contribution came from the interest-rate spread.
Friday, September 14, 2012
The market was up once again today but volume dropped off the board! The Dow saw highs of +110.00 points, S&P 500 +14.00 points and the Nasdaq up +40.00 points but the final hour saw selling so at the close the Dow was up by half, +53.00 points to 13,593.00, S&P 500 +6.00 points to about 1466.00, S&P 100 +2.00 points to 673.00 and the Nasdaq Composite +28.00 points to about 3184.00. Oil was up closing +$.65 around the $99.00 level. As we move into expiration next week it will be interesting to see if the gains hold or we pull back as it is incredibly overbought in the short to medium term.
A gauge of consumer sentiment is at its highest level in four months, led up entirely by brighter expectations in what could be a bounce from political conventions. The University of Michigan and Thomson Reuters preliminary sentiment barometer rose to 79.2% from a final August level of 74.3%. Economists had expected the index to tick up to 75%, with stock gains offsetting a weak jobs report and higher gas prices. Expectations rose to 73.4% from 65.1% in August while, the barometer of views on current conditions ticked down to 88.3% from 88.7%.
Consumers Prices for gas in August was much higher as the index jumped +0.6% last month to mark the biggest advance since June 2009. The bulk of the increase stemmed from a +9% gain in the gas index, which also rose by the fastest amount in more than three years. As a result, energy prices surged +5.6%, marking the first increase in five months. The cost of food rose at a much slower +0.2% pace on the month. A gauge of consumer sentiment reaches its best level in four months, led up entirely by brighter expectations. Economists had expected the consumer price index, which tracks inflation at the retail level, to rise by +0.7%. Despite the big increase in August, consumer prices have only risen +1.7% over the past 12 months though. The low level of inflation made it easier for the Fed to start on a new round of billions of dollars in bond purchases meant to reduce interest rates and once again hopefully stimulate the economy.
On the brighter side, consumers increased spending for the second straight month, particularly on autos. Retail sales jumped +0.9% in August yet spending cannot keep up that pace unless paychecks rise or more workers find jobs, economists say. Without faster consumer outlays, businesses would not be able to sell enough goods and services to justify new hires or increase investment. The effect would likely be to keep the economy shackled and leave the unemployment near its current level of 8.1%. The jobless rate has been above 8% for 43 straight months, the longest period of high unemployment since the Great Depression in the 1930’s.
Industrial production fell -1.2% in August, the largest one-month percentage drop since March 2009, the Fed said. Hurricane Isaac's impact on Gulf Coast region output was responsible for 0.3% percentage points of the drop, the Fed said. Economists had expected a -0.3% +drop for August. July's growth was revised down to 0.5% growth from a previously estimated +0.6% rise. Compared to August 2011, industrial production is up +2.8%. Capacity utilization fell to 78.2% from 79.2% in July.
Thursday, September 13, 2012
By an 11-to-1 vote, the Fed decided to launch a new program of “open-ended” bond purchases so-called QE3 saying it will buy $40 billion of agency mortgage-backed securities each month, starting tomorrow. Incredible we can basically rename the country to Jamerica now as that is basically what Japan did over 20-years ago and there economy is still flatter than a board! It's also keeping in place “Operation Twist”, which consists of swapping short-dated securities for longer-term securities, as well as reinvesting the proceeds of maturing securities, so the central bank will be adding $85 billion of long-term securities each month through the end of the year. The Fed also extended its pledge to keep interest rates exceptionally low. Fed funds rates are currently targeted at a rate between 0% and 0.25%, from late 2014 to "at least through mid-2015." The Fed said it's acting "to support a stronger economic recovery" and expects the new program to put downward pressure on longer-term interest rates, support mortgage markets and help make financial conditions more accommodative even though everything they have done so far has actually seen the economy contract because the problem isn’t money supply its getting business’s to invest that money and with the policy’s that are in place now, it is better for companies to keep this basically free cash flow to move overseas where taxes and regulation is more reasonable. So I would suspect the winners of this whole thing will once again be the big banks!! Richmond Fed President Jeffrey Lacker, the only dissent, opposed both the asset purchases and the description of the time period will remain exceptionally low.
The market was basically flat before hand but after the Fed released their news it took off with the Dow seeing highs of +240.00 points, S&P 500 +28.00 points and the Nasdaq up +55.00 points. At the close the Dow was up by +207.00 points to 13,540.00, S&P 500 +23.00 points to about 1460.00, S&P 100 +12.00 points to 671.00 and the Nasdaq Composite +42.00 points to about 3156.00. Oil was up closing +$1.30 around the $98.00 level.
Wholesale prices jumped a seasonally adjusted +1.7% in August, mainly because of higher fuel prices. Excluding the volatile and unimportant food and energy costs because who needs that, the so-called core rate rose a much smaller +0.2%. Economists had predicted a +1.5% increase in the overall producer price index and a +0.2% rise in core PPI. The energy index surged +6.4%, led by a +13.6% increase in gas and an +11.9% rise in natural gas. The wholesale cost of food, meanwhile, rose a sharp +0.9%, as the price of eggs and dairy went up. Over the past year wholesale prices have risen an unadjusted +2%, or +2.5% at the core level.
Jobless Claims jumped by +15,000 to a seasonally adjusted 382,000 with about half the increase related to tropical storm Isaac. That's the highest level of claims since mid-July. The government said about +9,000 claims stemmed from the storm that passed through the Gulf Coast in late August. Some people could not work because of storm damage, but they did not apply for benefits right away. Economists expected claims to rise to 370,000. Initial claims from two weeks ago were revised up to 367,000 from an original reading of 365,000, based on more complete data collected at the state level. The average of new claims over the past month, meanwhile, rose by 3,250 to 375,000, also the highest level since mid-July. The four-week average reduces seasonal volatility in the weekly data and is seen as a more accurate barometer of labor-market trends. Continuing claims fell by -49,000 to a seasonally adjusted 3.28 million in the week ended September 1st. Continuing claims reflect the number of people already receiving regular unemployment insurance. About 5.39 million people received some kind of state or federal benefit, down -78,465 from the prior week. Total claims are reported with a two-week lag.
The prices paid for Imports rose +0.7% in August, the first increase in five months. That compared to a revised -0.7% drop in July. The decline in July was originally reported as -0.6%. A +4.1% rise in imported fuels accounted for the increase. Excluding fuel costs, import prices fell -0.2%. The price of U.S.-made goods exported to other nations, meanwhile, rose +0.9% in August after a +0.4% gain in the prior month.
Tuesday, September 11, 2012
This is a special day which strangely brings out so many emotions and memories about 9/11! Although I was all the way on the other side of the country and not in America I felt it because my work is in the stock market and many of the analysts I knew of and had listened to for years were suddenly gone. Although it was 11 years ago, it seems like yesterday in so many ways. This is an important day to remember and our thoughts and prayers are with those who lost loved ones and coworkers today!!
Analysts at Moody's Investors Service would like to see some constructive action taken by the White House and Capitol Hill on the federal debt, saying in a report that this would be a key factor in determining whether the agency will change its ratings outlook for American government debt. The rating stands at Aaa with an outlook of "negative." If budget negotiations "lead to specific policies that produce a stabilization and then downward trend" in the ratio of federal debt to gross domestic product in the medium term, Moody's said it would likely reaffirm the Aaa rating and change the outlook to "stable." Moody's also noted that its ratings outlook makes the assumption that Congress and the Obama administration will again agree to increase the U.S. debt limit and do so in a "relatively orderly" manner.
Even with this news the market remained higher with the Dow seeing highs of +75.00 points, S&P 500 +8.00 points but tech didn’t follow along with the Nasdaq only up +10.00 points. At the close the Dow was up by +69.00 points to 13,323.00, S&P 500 +5.00 points to about 1434.00, S&P 100 +2.00 points to 658.00 and the Nasdaq Composite +.50 points to about 3104.00. Oil was up a little closing up +$.25 around the $97.00 level.
The Trade deficit widened a slight +0.2% in July to $42.0 billion, just marginally above the 18-month low set June, the Commerce Department said. The July trade deficit was well below the consensus forecast of economists. Analysts had expected the sharp decline in the deficit in June to be partially reversed with the deficit widening to a projected $43.5 billion. The July gap came in slightly above the revised deficit of $41.9 billion for June, originally estimated at $42.9 billion. The trade gap had averaged $49.2 billion in the first five months of the year. Both exports and imports fell in July, with exports dropping at a slightly faster pace. Both sectors, economists said, are suffering from sluggish global and domestic demand, a trend that’s likely to continue. Net exports should make a positive contribution to U.S. gross domestic product for the third quarter. Exports fell -1% to $183.3 billion in July, led by a drop in exports of industrial supplies. Offsetting the decline, exports of civilian aircraft jumped in July, and exports of agriculture products set a record in the month. Imports fell -0.8% to $225.3 billion. The lion’s share of the improvement was due to a smaller bill for crude-oil imports. Imports of autos, parts and engines hit a record. The trade deficit with China widened to a record $29.4 billion in July compared with $27.0 billion in the same month last year. Imports from China hit a record $37.9 billion. There were also signs the European banking debt crisis was negatively impacting U.S. trade.
Monday, September 10, 2012
Interesting: Young Americans who grew up during the Great Recession apparently did not seem to learn much from their parents money problems. There is a major disconnect between many of their financial wishes and realities as nearly 40% of Generation Z, those ages 13 to 22, expect to receive an inheritance, according to a recent TD Ameritrade study. As a result, they don't believe that they will need to save for retirement. Only 16% of parents said that they expect to provide an inheritance, says the TD Ameritrade study. The fact that many parents are scaling back does not necessarily mean that they can't afford to provide an inheritance however. Among adults with at least $100,000 in investable assets, 58% say leaving an inheritance is not a primary concern, according to a PNC survey. Instead, 42% say that saving for retirement is their primary financial goal, while passing on money to a future generation is far down the list. Only 2% said it is a primary financial goal.
Can someone please shoot me, you would never think that this being an expiration traded week volume would remain so incredibly low and the market barely moving!! I’m even thinking of getting another job its so boring! Then again I guess I can just play more tennis!! After the disgusting employment report that was out on Friday which saw the market actually close up, traders maybe came to their senses today but nothing happened as the market was mostly flat all day with the Dow seeing lows of -60.00 points, S&P 500 -9.00 points and the Nasdaq -40.00 points. At the close the Dow was down by -53.00 points to 13,253.00, S&P 500 -9.00 points to about 1429.00, S&P 100 -4.00 points to 656.00 and the Nasdaq Composite -32.00 points to about 3104.00. Oil was flat closing down -$.05 around the $95.00 level.
Since the last election in November 2008, the market is up about over +35%. Looking at the prior 28 elections, the median return from election to election was +20% for the market. To look at the market from this view, what’s interesting is that the incumbent party wins more frequently when the return beats the median. In fact, the incumbent wins almost twice as often 11 victories versus 6 and if history repeats, that's good news for President Obama. In 17 of the past 28 elections, there has been an incumbent candidate, the incumbent has won 13 of these 17 contests and in the nine elections where there has been an incumbent and the market has gained at least 20% since the prior election, the incumbent has won eight times. The only sitting president to have lost was President Bush Senior, in 1992. He lost the election to then-Governor Bill Clinton, despite the market rising +50% from the 1988 election to the 1992 election. It will be very interesting to see if this works out this time around as no sitting President has ever won with unemployment over 8%!!
Speaking of that Job growth was reported on Friday to have slowed sharply in August with employment increasing by only +96,000, lower than the +125,000 gain expected by economists. Adding to the sense of weakness, job growth in the past two months were revised down by -41,000. The unemployment rate declined to 8.1% in August from 8.3% in the previous month but the drop was due to -368,000 dropping out of the workforce!! The jobless rate has held above 8% for more than three years, the longest stretch since the Great Depression!! Economists forecast the unemployment rate to hold steady at 8.3%. While unemployment dropped by -250,000 to 12.5 million for August, employment also fell, dipping -119,000 to 142.1 million. The participation rate dropped by two-tenths of a percentage point to stand at 63.5%. An alternative measure of unemployment, which includes discouraged workers and those forced to work on a part-time basis because of the weak economy, fell to 14.7% from 15%.
Thursday, September 6, 2012
The market had been flat to slightly down during this shortened trading week but today the market took off after “decent” economic data and that European Central Bank President Mario Draghi said their central bank would launch an "outright monetary transaction," or OMT, program in the secondary market, under strict conditionality.” The Dow saw highs of +250.00 points, S&P 500 +29.00 points and the Nasdaq +70.00 points. At the close the Dow was up by +244.00 points to 13,292.00, S&P 500 +29.00 points to about 1432.00, S&P 100 +13.00 points to 658.00 and the Nasdaq Composite +67.00 points to about 3135.00. Oil was higher but lost most of a +$2 gain to only closing up +$.17 around the $95.50 level. This was nice but again mostly expected and part of it could have been due to the discounting of the employment report that is coming out tomorrow morning on the hopes of a good report!
This morning it was reported that Private-sector job growth picked up in August, recording the largest employment gain in five months, according to data released by payrolls processor Automatic Data Processing Inc. Private-sector payrolls rose by +201,000 in August, led by small businesses and the service-providing sector. ADP revised July’s level to an increase of +173,000 from a prior estimate of +163,000. “The gain in private employment in August is strong enough to suggest that the national unemployment rate may have declined,” said Joel Prakken, chairman of Macroeconomic Advisers, which produces the report for ADP. Everyone looks to ADP’s report on private-sector payrolls to provide some guidance. Also out was the outplacement consultancy Challenger, Gray & Christmas reported that the number of announced layoffs fell to -32,000 in August, the lowest level since December 2010, from -37,000 in July. Cuts announced in August were 37% lower than last year.
Jobless claims fell by the largest amount in more than a month in the latest week, by -12,000 to 365,000. The forecast was for claims to fall a slight -1,000 to 373,000. There was no indication Hurricane Isaac played any role in the numbers this week. The four-week average inched up by +250 to 371,250. Claims in the previous week were revised to an increase of +3,000 to 377,000 compared with the initial estimate that they held steady at 374,000.
Thursday, August 30, 2012
Interesting: According to Reuters: "While Samsung Electronics is reeling from a patent pounding by its smartphone rival Apple, this is unlikely to damage the other part of their relationship - where Samsung is the sole supplier of Apple-designed chips that power the iPhone and iPad."
Its been another flat week for the market but as it sunk in more and more that Fed chief Ben Bernanke likely won’t say anything about QE3 at Jacksonhole tomorrow the market started to sell off with the Dow seeing lows of -130.00 points, S&P 500 -14.00 points and the Nasdaq -40.00 points. At the close the Dow was down by -107.00 points to 13,000.00, S&P 500 -11.00 points to about 1399.00, S&P 100 -5.00 points to 643.00 and the Nasdaq Composite -32.00 points to about 3049.00. Oil was also lower closing down -$.40 around the $95.00 level.
1. One could say that the 2000’s was the worst decade in modern history for the middle class. A study released this week by the nonpartisan Pew Research Center pointed out a few things:
2. The portion of the nation’s income earned by people making anywhere from $39,000 to $118,000 is at the lowest level since World War 2.
3. In each decade since the end of World War II to 2000 mean family income had increased but the decade from 2000 to 2010 shows is way different. Mean family income decreased across the board. It was a lost decade.”
4. 85% of middle class say it’s harder to maintain their lifestyle as opposed to a decade ago.
In 1970, the upper income took home 29% of the nation’s income, middle income earners 62% while in 2006, upper income earners took home 46% of the nation’s income while middle income earners decreased to 45% of the nation’s income.
What’s interesting about this is that where I live the average family of four needs to bring in a wage of nearly $72,000 a year to make ends meet within the Central Okanagan. That's the conclusion of the second annual calculation of the Central Okanagan Living Wage. It works out to a yearly increase of more than $600, over figures released in 2011. According to the calculation, in order to meet the most basic needs to keep them out of extreme poverty, each adult in a two parent, two children household, must be employed full-time and earn at least $17.17 per hour. Based on the average work week of 35 hours with a combined hourly wage of $34.34, the family of four would need to earn $1,201 a week and $62,498 per year.
The middle class, a group that has gone through a lost decade for economic well-being and housing prices rocketing then tanking. Since 2000, the middle class has shrunk in size and fallen backward in income and wealth. These stark assessments are based on findings from the Pew Research Center survey that includes people who describe themselves as middle class, supplemented by the Center’s analysis of data from the U.S. Census Bureau and Federal Reserve Board of Governors. Fully 85% of self-described middle-class adults say it is more difficult now than it was a decade ago for middle-class people to maintain their standard of living. Of those who feel this way, 62% say “a lot” of the blame lies with Congress, while 54% say the same about banks and financial institutions, 47% about large corporations, 44% about the Bush administration, 39% about foreign competition and 34% about the Obama administration. Just 8% blame the middle class itself which I find very interesting, its always easier to blame someone else for your woes instead of looking at how you can fix the problem yourself.
Their downbeat take on their economic situation comes at the end of a decade in which, for the first time since the end of World War II, mean family incomes declined for Americans in all income levels. For the middle-income group, the “lost decade” of the 2000s has been even worse for wealth loss than for income loss. The median income of the middle-income tier fell -5%, but median wealth (assets minus debt) declined by -28%, to $93,150 from $129,582. During this period, the median wealth of the upper-income tier was essentially unchanged, rising by +1%, to $574,788 from $569,905. Meantime, the wealth of the lower-income level plunged by -45%, albeit from a much smaller base, to $10,151 from $18,421!!! These are depressing numbers to say the least but in my view has occurred because people of the past two generations have become takers instead of givers wanting the government to take care of them instead of being entrepreneurial and finding solutions themselves. Change is in the air however so this coming decade should be interesting, eight more years and we’ll know how it turns out!!
Consumers increased their spending in July by the biggest amount in five months as aftertax incomes continued to grow modestly, according to the latest government data. Personal spending rose a seasonally adjusted +0.4% on the month to mark the largest increase since February. The higher level of spending was in line with expectations. Slightly rising incomes, not to mention falling gas prices gave consumers a little more money to spend in midsummer. Personal income rose +0.3% for the third straight month, while aftertax income rose by the same amount in July. Since spending rose slightly faster than income, the savings rate dropped to +4.2% in July from +4.3% in June. The savings rate in June was the highest in one year, however. Consumer spending is the single biggest source of growth in the U.S. economy.
Jobless Claims remain at the level that suggests little pickup in hiring, the latest data showed. Initial jobless claims were unchanged at a seasonally adjusted 374,000. Initial claims from two weeks ago were revised up to 374,000 from an original reading of 372,000, based on more complete data collected at the state level. Economists had projected claims would fall to 370,000. The average of new claims over the past month, which smooths out short-term volatility, rose by +1,500 to 370,250. Continuing claims fell by -5,000 to a seasonally adjusted 3.32 million and reflect the numbers of people already receiving benefits. About 5.53 million people received some kind of state or federal benefits, down -62,253 from the prior week. Total claims are reported with a two-week lag.
Gross domestic product increased at a +1.7% rate in the April-to-June period, up from a first read of +1.5%. GDP, the value of all goods and services produced is the broadest measure of an economy’s health. The economy’s current level of growth, however, still falls well short of what’s needed to dramatically lower the nation’s high unemployment rate and eliminate the lingering threat of another recession. America has grown at below-average rates since exiting the last recession in mid-2009, held back mainly by poor job growth. The nation’s unemployment rate has hovered above 8% for 42 straight months, marking the longest period of prolonged labor-market weakness since the Great Depression! Economists don’t expect growth to accelerate much in the near future as they project it to grow +2% in the third quarter and +1.9% in the final three months of the year. Soft consumer spending, weakness in the global economy and the threat of higher taxes and deep spending cuts next year are among the headwinds restraining growth, analysts say. The slight increase in second-quarter GDP matched expectations.
Consumer confidence fell to a nine-month low in August as people grew more worried about business conditions and the chances of finding a job, according to a survey. The Conference Board said its confidence index dropped to 60.6% from 65.4%, marking the lowest level since last November. Economists had forecast the index to rise slightly to 66%. Lynn Franco, director of economic indicators, said "consumers were more apprehensive about business and employment prospects." The board's future expectations sub-index fell to 70.7% last month from 78.4%, while the present-conditions index was basically unchanged at 45.8%. While consumers are less hopeful about the future, however, they said they've seen little deterioration in the economy, either.
Monday, August 27, 2012
And the psychology of the market gets interesting once again! Oil originally was higher this morning by over +$1.00 because practically all of the oil wells in the Gulf were shut down due to hurricane Isaac coming in! This makes sense if they’re not producing but when oil suddenly fell over -$1.50 the media said it was because since all of the oil wells can’t produce and the storm is going on drivers will want to drive less so it should be lower! This doesn’t even make sense but now you know why we do what we do, the market overall has a hard time sticking to one direction for too long!!!
Interesting: According to The New York Times: "After three decades of torrid growth, China is encountering an unfamiliar problem with its newly struggling economy: a huge buildup of unsold goods that is cluttering shop floors, clogging car dealerships and filling factory warehouses." The report added: "The glut of everything from steel and household appliances to cars and apartments is hampering China’s efforts to emerge from a sharp economic slowdown. It has also produced a series of price wars and has led manufacturers to redouble efforts to export what they cannot sell at home. The severity of China’s inventory overhang has been carefully masked by the blocking or adjusting of economic data by the Chinese government — all part of an effort to prop up confidence in the economy among business managers and investors."
The market started the week pretty much flat and remained that way mostly all day with the Dow seeing lows of -40.00 points, S&P 500 -2.00 points but the Nasdaq remained higher as Apple was up strongly after it was announced over the weekend that they won there lawsuit against Samsung. At the close the Dow was down by -33.00 points to 13,125.00, S&P 500 -.70 points to about 1410.00, S&P 100 +.01 points to 649.00 and the Nasdaq Composite +3.00 points to about 3073.00. Oil was a bit lower closing down -$.60 around the $95.50 level. The market is likely to remain this way all week once again as traders await everyone to return from holidays which will be great for premium decay!!
Friday, August 24, 2012
The market has been under pressure all week and today was no different with the Dow seeing lows of -40.00 points, S&P 500 -5.00 points and the Nasdaq -15.00 points first thing in the morning but when there was a sudden appearance of a letter from Ben Bernanke to a Congressman that the Fed is ready to help out with monetary policy it took off. The Dow saw highs in the final hour of +110.00 points, S&P 500 +11.00 points and the Nasdaq +25.00 points. This market seems so fickle, I mean really give me a break did this so called “letter” really appear and less than 400 million shares traded right at the close, what a joke!!!
At the close the Dow was up by +100.00 points to 13,156.00, S&P 500 +9.00 points to about 1411.00, S&P 100 +4.00 points to 649.00 and the Nasdaq Composite +16.00 points to about 3070.00. Oil was a bit lower closing down -$.25 around the $96.00 level.
Today it was reported that Orders for Durable Goods jumped +4.2% in July as demand for airlines and autos surged, but bookings weakened in many other sectors. Economists had expected orders for durable goods to climb +3%. Bookings for transportation equipment, a particularly volatile category, shot up +14.1% last month, as Boeing received its biggest batch of orders since last December. Yet omitting the transportation sector, orders fell -0.4% which is bad and declined for the second month in a row. Orders for core capital goods excluding defense and transportation, a key barometer of business spending, dropped a sharp -3.4% last month. These orders also fell -2.7% in June.
Tuesday, August 21, 2012
Finally this market is getting interesting! This morning it was up once again with the Dow seeing highs of +70.00 points, S&P 500 +9.00 points and the Nasdaq +30.00 points making new intraday highs!! However, it was again on lower and lower volume and the fact that its obvious that Retail sales are indicating a slowdown as Best Buy reported pathetic earnings worldwide for this past quarter we see the market hitting new yearly highs! Interesting, economy slowing, the EU about to come back into session and the volatile fall season is about to be upon us and were hitting new highs!!! Could this be a double top from when the market hit new highs in April, maybe!!!
The signs that the economy is slowing is strongly evident when the growth rate for wages and salaries has been going down from 6% in April 2011 to the current level of 3%. Its apparent that the Fed’s easing’s have helped to hold up the market where they have spent about $100 billion each month to grow incomes by $20 billion yet wages and salaries are dropping. Besides, July’s increase in spending among consumers wasn’t matched by companies filling inventories and are now overstocked suggesting things haven’t changed much. So, businesses either don’t expect a big bump in sales or are too worried about economic volatility and are in a wait-and-see mode. Actually, insiders have been selling stock into these rallies. For the week of August 10th, insiders sold $1.1B worth of stock, while buying only $54M. The previous week, the difference was even more pronounced at $1.68B sales to $43M buys! Overall, the U.S has become a service oriented society, where a larger portion of the labor force has moved to part-time, lower-wage jobs and that contributes to wages falling, which means less sales and a slowing economy, so really how long can the market stay up while all of this is going on or at the least start showing some volatility?
Of course I wrote this while the market was at its highs and midday it turned down with the Dow turning negative seeing lows of -90.00 points, S&P 500 -9.00 points and the Nasdaq -20.00 points! At the close the Dow was down by -68.00 points to 13,203.00, S&P 500 -5.00 points to about 1413.00, S&P 100 -3.00 points to 650.00 and the Nasdaq Composite -9.00 points to about 3067.00. Oil was higher closing up +$.50 around the $97.00 level.
Wednesday, August 15, 2012
The market had another mixed day with it starting a bit lower but then moving up on thin volume! The Dow saw lows of -30.00 points, S&P 500 -3.00 points and the Nasdaq -5.00 points and then the Dow saw highs of +20.00 points, S&P 500 +3.00 points and the Nasdaq +15.00 points. At the close the Dow was up by only +2.00 points to 13,172.00, S&P 500 -.20 points to about 1404.00, S&P 100 +.40 points to 646.00 and the Nasdaq Composite -6.00 points to about 3017.00. Oil was higher closing up +$.77 around the $94.00 level.
Consumer prices were unchanged in July, as lower energy prices offset gains in food and other items. An index of energy prices fell -0.3% in July, while the food index rose +0.1%. The core consumer price index, which excludes the volatile categories of food and energy, rose +0.1%. Economists had expected an increase of +0.2% for both the overall and core price gauges. In June overall consumer prices were also unchanged, while the core gauge rose +0.2%. The CPI rose +1.4% over the year through July, the smallest 12-month change since late 2010. The core rate gained +2.1% over the past 12 months, the smallest gain since late 2011.
Manufacturing activity stayed weak in the New York region during August, with
the Empire State index falling below zero, moving to negative -5.9% in August, worse than the +7.4% reading in July, according to the Empire State manufacturing survey released by the Fed’s Bank of New York. This is the first negative reading since last October.
Builder confidence in the market for newly built single-family homes climbed in August to the highest level in more than five years on expectations the recovery in housing can continue. The National Association of Home Builders/Wells Fargo housing market index rose 2 points to a seasonally adjusted reading of 37%, the best level since February 2007. There's still a way to go for the index to reach the 50% level indicating "good" conditions, which hasn't been the case since April 2006. The component measuring current sales conditions rose 3 points to 39%, and the component measuring traffic of prospective buyers rose 3 points to 31%. The component measuring sales expectations in the next six months rose a point to 44%.
Industrial production picked up in July after two months of slight growth, the Fed said in the latest reading that shows the economy in the third quarter got off to a decent start.
Industrial production rose +0.6% in July after slender +0.1% monthly gains in May and June, the Fed said. The Fed had previously reported a +0.4% gain in June and a +0.2% drop in May. The +0.6% gain was as expected according to economists. Capacity utilization rose to 79.3% in July from 78.9% in May, the highest level since April 2008. Even so, it’s still +1% below its average from 1972 to 2011.
Tuesday, August 14, 2012
Very Interesting! I cannot believe that there was less than 400 million shares traded yesterday on the market! That is less than the day before or after Christmas!!! At the same time the volatility index fell below 14 indicating there is so much complacency out there that it makes me nervous!! Then this morning I was watching the September upcoming option prices and I couldn’t believe how high the prices in some of the call options were moving even though the S&P was barely up! I think part of this is due to the thin volume so the bid/ask prices aren’t reflecting real prices! Thank goodness the CME is still settling prices after the close! Nonetheless this is a very interesting market and I think were going to see volatility kick up as we enter the fall season of trading! Ouch I know I said it fall is almost here already!
Today the market started the day higher with the Dow seeing highs of +60.00 points, S&P 500 +6.00 points and the Nasdaq +15.00 points but after that it flattened out and the final hour saw selling with the Dow seeing lows of -30.00 points, S&P 500 -5.00 points and the Nasdaq -10.00 points. At the close the Dow was up by only +2.00 points to 13,172.00, S&P 500 -.20 points to about 1404.00, S&P 100 +.40 points to 646.00 and the Nasdaq Composite -6.00 points to about 3017.00. Oil was also lower closing down -$.140 around the $93.00 level.
After three straight monthly declines, sales at retailers increased +0.8% in July to a seasonally adjusted $403.9 billion. Details of the report were strong, with monthly sales rising across the board and was the biggest gain in sales since February. Compared with July 2011, sales are up +4.1%. Sales fell a downwardly revised -0.7% in June, compared with a -0.5% decrease originally reported. The sales are seasonally adjusted, but they aren’t adjusted for price changes. The pickup in July’s sales easily beat expectations as economists had been on watch for modest sales growth of +0.2%.
Retail sales account for about half of total consumer spending and about a third of final sales in the economy. In the second quarter, consumer spending decelerated to a 1.5% annual growth rate from a 2.4% pace in the first quarter.
Wholesale prices rose +0.3% in July as higher food costs offset another decline in energy costs. Analysts expected a rise of +0.2% for the month. Core producer prices, excluding volatile food and energy, rose +0.4%, higher than analysts’ expectations of a +0.2% increase. The July gain in PPI was the largest since February. In June, the headline PPI rate had risen +0.1%, while the core rate had risen +0.2%. Wholesale food prices in July rose +0.5% for the second straight month. Corn prices had risen +34.5%, the biggest rise since October 2006!
Monday, August 13, 2012
Well I have been off from writing for a couple of weeks on holiday and I may as well have stayed off as nothing as changed. Europe is still imploding, the Middle east is still fighting and our economy is still moving sideways to down!! There was an interesting statistic out over the weekend that really makes one shake their head!!! 46% of Americans die with less than $10,000 to their name and I don’t think it has anything to do with people wanting to spend their money instead of giving it to their kids!! The S&P 500 had been up for the past six days in a row but closed down today on profit taking! Volume was so incredibly low it was unbelievable and even though it was a down day the volatility index actually moved down! The Dow saw lows of -80.00 points, S&P 500 -7.00 points and the Nasdaq -20.00 points but the final hour saw it come back to close with the Dow down by -40.00 points to 13,169.00, S&P 500 -2.00 points to about 1404.00, S&P 100 -1.00 points to 645.00 and the Nasdaq Composite +2.00 points to about 3023.00. Oil was also lower closing down -$.13 around the $92.00 level.
Friday, July 20, 2012
Profit taking seemed to set in today likely due to expiration being today. The great news is that all of our trades were fully profitable!! The Dow saw lows of -140.00 points, S&P 500 -15.00 points and the Nasdaq -50.00 points. The final hour didn’t see much of a change and at the close the Dow was down by -121.00 points to 12,823.00, S&P 500 -14.00 points to about 1363.00, S&P 100 -5.00 points to 627.00 and the Nasdaq Composite -40.00 points to about 2925.00. Oil was also lower closing down -$1.10 around the $92.00 level.
Thursday, July 19, 2012
The market closed higher yesterday with a decent move of almost 1% but today there was little follow through as economic data wasn’t that great! The market stumbled a bit at the open but because of the thin volume and that expiration is tomorrow it was shallow and the Dow saw highs of +80.00 points, S&P 500 +7.00 points and the Nasdaq +40.00 points. At the close the Dow was up by +35.00 points to 12,943.00, S&P 500 -+4.00 points to about 1376.00, S&P 100 +2.00 points to 632.00 and the Nasdaq Composite +23.00 points to about 2966.00. Oil rallied strongly up +$2.80 around the $93.00 level. The Middle East is starting to heat up as the situation in Syria is getting worse plus there’s a myriad of concerns about the Middle East overall! The Iran premium, largely absent from the oil market two weeks ago, has returned. The oil market is focusing once again on geopolitical issues rather than supply and demand dynamics. Iran is more of a wild-card than ever. More important, the energy complex, both on the commodity and the stock trading side is starting to move up in tandem. That hasn't happened for some time, and it suggests that we could be at the start of some kind of move that could be in place for a few weeks.
Jobless claims jumped +34,000 last week to 386,000, unwinding a sharp drop in the prior week, amid typical summertime fluctuations in auto-industry employment. Auto manufacturers usually schedule brief shutdowns of plants each summer to retool for new models, but the timing and size of temporary layoffs can vary. As a result, the claims report tends to be volatile in July. Economists had projected claims would climb to 365,000 last week. A more accurate barometer of labor-market trends, the four-week claims average, fell -1,500 to 375,500. The four-week average reduces seasonal volatility in the weekly data. Meanwhile, continuing claims inched up by +1,000 to a seasonally adjusted 3.31 million. About 5.75 million people received some kind of state or federal benefit in the week ended June 30th, down -121,985 from the prior week.
Manufacturing activity in the Philadelphia region rebounded only slightly in July, the Fed’s Bank of Philadelphia reported. The Philly Fed diffusion index rose to negative -12.9% in July from negative -16.6% in June. This is the third straight monthly reading below zero, indicating contraction. The increase in the index was smaller than expected. Economists were looking for the index to improve to negative -6.8%.
The index of leading economic indicators fell -0.3% in June to 95.6%, mostly reversing the increase in May. Weakness in new orders, consumer confidence and building permits contributed to the decline. The coincident index, which reflects current conditions, rose +0.2%. The lagging index also climbed +0.2%.
Sales of existing homes in June fell -5.4%, a decline that goes against the grain of more positive indicators from the housing market and one trade group blamed foreclosure delays and tough mortgage availability. The National Association of Realtors said June sales were at a seasonally-adjusted annual rate of 4.37 million, versus an upwardly revised 4.62 million in May. Economists had anticipated a 4.65 million annual rate. Year-over-year, sales rose +4.5%, the 12th straight year-on-year gain. The NAR initially reported a 4.55 million rate for May. Inventories fell -3.2% to 2.39 million units. That corresponds to 6.6 months of supply at current sales rate, up from 6.4 months in May. Median prices jumped for a third month, rising +7.9% from year-ago levels to $189,400. This is due to the mix of homes being sold, rather than re-sale price. CoreLogic, for instance, reported that re-sale prices were up +2% year-on-year.
Yesterday it was reported that three of the 12 Fed’s district banks reported that growth slowed in June and early July, according to the latest Fed’s economic survey, up from only one region in May. The slowdown appeared to be concentrated in the East Coast and mid-Atlantic regions, as the New York, Philadelphia and Cleveland districts saw weaker activity. The majority of Fed districts saw "modest to moderate" expansion, the so-called Beige Book said. This is slower than the "moderate" growth seen in the last survey released in May. There were positive reports on housing markets from across the country. Factory production was said to be expanding slowly, but there were widespread reports of a deceleration in new orders. Wage pressure, a key ingredient of inflation, remained modest. Hiring was seen as "tepid."
Tuesday, July 17, 2012
The market looked as if it was going to have an ugly day after Fed Chief Ben Bernanke came out and made no promises he would save the economy once again. The Dow saw lows of -90.00 points, S&P 500 -9.00 points and the Nasdaq -30.00 points. He did say to the members of Congress that the weaker economic outlook would cause the central bank to be prepared to take further action to try to give the recovery a jolt however and this helped the market to come back. The Dow saw highs of +110.00 points, S&P 500 +13.00 points and the Nasdaq +20.00 points.
In testimony prepared for the Senate Banking Committee as part of his twice-per-year report on Fed monetary policy issues, Bernanke said that the reduction in the unemployment rate in coming months seems likely to be "frustratingly slow." Bernanke urged Congress to move right away to address the fiscal cliff that is coming up fast, saying it threatened the recovery. He said that the European debt crisis was also a significant threat. "Reflecting its concerns about the slow pace of progress in reducing unemployment and the downside risks to the economic outlook, the Fed made clear at its June meeting that it is prepared to take further actions as appropriate to promote a stronger economic recovery and sustained improvement in labor market conditions in a context of price stability," Bernanke said.
At the close the Dow was up by +78.00 points to 12,805.00, S&P 500 -+10.00 points to about 1364.00, S&P 100 +4.00 points to 626.00 and the Nasdaq Composite +13.00 points to about 2910.00. Oil was up +$.50 around the $89.00 level.
The market rallied nicely last Friday with the main reason being the situation in Europe improving enough for the market to stop making it the primary issue for moving the market. The fact is that the market was starting to bet on some kind of maneuvering from the Fed that will increase the amount of money in circulation to the point that banks actually lend money to customers and the economy moves in a positive direction. Unfortunately that seems to still be up in the air in my view but on this thinly traded market even a whiff of it moves the market! The question is will the rally last then!!
Builder confidence for newly built, single-family homes climbed 6 points to 35%, the highest level since March 2007, according to the National Association of Home Builders/Wells Fargo housing market index. Economists had forecast a reading of 30%. The index is designed so that a reading of 50% is considered good, which hasn’t been the case since April 2006. That said, there’s rising confidence by builders. “This is greater evidence that the housing market has turned the corner as more buyers perceive the benefits of purchasing a newly built home while interest rates and prices are so favorable,” said Barry Rutenberg, chairman of the National Association of Home Builders, in a statement. Each of the four regions posted gains, including a strong 12-point surge in the West. The component gauging current sales conditions rose 6 points to 37% and the component measuring traffic of prospective buyers rose 6 points to 29%. The component gauging sales expectations for the next six months gained 11 points to 44%. The builder confidence report has a strong correlation to single-family housing starts. That said, the most recent uptick in sentiment has seen a stronger gain than what has been seen in starts.
Monday, July 16, 2012
The market changed its mind and went down to start the week with no follow through from Friday which is disappointing but in a sideways action its not surprising! This is great for our profits though which is nice and as this is an expiration traded week and al of our trades are looking great! The Dow saw lows of -80.00 points, S&P 500 -8.00 points and the Nasdaq -20.00 points.
At the close the Dow was down by -50.00 points to 12,727.00, S&P 500 -3.00 points to about 1354.00, S&P 100 -2.00 points to 621.00 and the Nasdaq Composite -12.00 points to about 2897.00. Oil was up on concerns about some fighting amongst the Americans in the strait of Hormuzallied today up +$1.00 around the $87.00 level.
Retail sales fell in June for the third straight month as consumers cut spending on most goods and services, reflecting a sharp slowdown in economic growth in the second quarter. Retail sales slumped a seasonally adjusted -0.5% in June following declines in May and April. The last time there were three straight monthly drops in retail spending was in the second half of 2008, midway through the Great Recession. The weak retail report fell well short of expectations as economists had forecast a +0.2% increase in sales.
Manufacturers in the New York region said business improved modestly in early July, after barely expanding in June, according to a report by the New York Fed. The Empire State index rose to 7.4% in July from 2.3% in June. The Great Plains and Midwest are rebounding faster than other parts of the country, but economists say their recoveries aren't enough to lift the rest of the economy. The index had fallen dramatically in June from 17.1% in May. Readings below zero indicate more firms said business was worsening than said it was improving. Economists expected the headline index to rebound to 5%. Tempering any optimism, the new orders index slipped into negative territory in July for the first time since November 2011. The Empire State data is watched closely, because they are the first reading of the health of the manufacturing sector in July. The sector has hit a soft patch in recent months after leading the recovery over the past three years. Weak manufacturing is one reason that economists think the Fed is inching closer to another round of asset purchases, or quantitative easing. On Thursday, the Philadelphia Fed manufacturing index will be released. It dropped very sharply in June to -16.6 from -5.8 in May.
Friday, July 13, 2012
The market has been down for the past six days but on the dreaded Friday the 13th it was up strongly so obviously it isn’t such a bad day after-all! Actually the market is up about +60% of the time on a Friday the 13th!!! The Dow saw highs of +210.00 points, S&P 500 +23.00 points and the Nasdaq +50.00 points basically bringing the market back to where it was at the start of the week! The nice thing with that sideways movement is it just ate up premium in our trades which is always nice!!
At the close the Dow was up by +203.00 points to 12,777.00, S&P 500 +22.00 points to about 1357.00, S&P 100 +10.00 points to 623.00 and the Nasdaq Composite +42.00 points to about 2908.00. Oil rallied today up +$1.00 around the $87.00 level.
Wholesale prices rose a seasonally adjusted +0.1% in June as higher costs for food, light trucks and appliances offset another decline in energy costs. Excluding the volatile categories of food and energy, core wholesale prices rose a slightly faster +0.2%. Economists had predicted a -0.2% decrease in the overall producer price index and a +0.2% gain in the core PPI. Energy prices fell -0.9% last month. The wholesale cost of food, meanwhile, rose +0.5%, mainly because of higher meat prices. Over the past year wholesale prices have risen an unadjusted +0.7%. Just one year ago, the year-over-year increase stood at nearly 7%.
Yesterday it was reported that Jobless claims fell by -26,000 last week to 350,000, but onetime factors such as fewer auto-sector layoffs than normal likely caused the sharp decline. The level of claims is the lowest in four years, although they could move higher in the next few weeks as onetime seasonal factors unwind. The four-week average of claims, meanwhile, fell by a smaller -9,750 to 376,500. The monthly average reduces seasonal volatility in the weekly data and is seen as a more accurate barometer of labor-market trends. Continuing claims fell by -14,000 to a seasonally adjusted 3.3 million in the week ended June 30th. About 5.87 million people received some kind of state or federal benefit in the week ended June 23rd, up +17,011 from the prior week.
The trade deficit fell -3.8% in May to $48.7 billion largely because of lower oil imports, while exports rose slightly! Imports in May fell -0.7% to $231.8 billion on a seasonally adjusted basis. Exports rose +0.2% to $183.1 billion, with all of the increase occurring on the services side of the economy. Exports of goods were unchanged at $130.7 billion. Exports of goods to China climbed by 5.2% and exports of goods to the European Union rose by +2.6%, mainly because of increased trade with France. Imports of crude oil dropped -$2.82 billion in May to $27.42 billion. In April, the trade deficit was revised up to $50.6 billion from $50.1 billion.
Tuesday, July 10, 2012
Yesterday the market started the week on the downside and remained there all day to close with slight losses! Today would have been the fourth down day in a row so it wasn’t surprising the market bounced as in the shortest terms it was oversold with the Dow seeing highs of +90.00 points, S&P 500 +9.00 points and the Nasdaq +25.00 points. It was coming off of an extreme overbought condition however so it still needed more selling so down it went with the Dow seeing lows midday of -130.00 points, S&P 500 -16.00 points and the Nasdaq -40.00 points. It bounced a little at the close to finish the day with the Dow down by -83.00 points to 12,653.00, S&P 500 -11.00 points to about 1341.00, S&P 100 -4.00 points to 616.00 and the Nasdaq Composite -29.00 points to about 2902.00. Oil fell down -$1.75 around the $84.00 level. The market seems to be stuck in nowhere land right now as it appears the economy is slowing and as earnings season gets going we may see it in the numbers so it could be interesting!
Friday's jobs number saw only +80,000 new jobs created, but this came with quite a few questions and one of them is extremely significant. The birth-death model, which approximates the amount of jobs gained through new businesses created too recently to be counted in the formal survey, added +124,000 positions, meaning that without the estimation the total count would have been a loss of -44,000. This is a scary number and could indicate that the economy is contracting now and we may be headed back into a recession. This will likely keep the market volatile and flat for a time to come which will help us to be very profitable!!
Friday, July 6, 2012
Yesterday the market closed down a little after poor economic data came out about the jobs front and indicated that today’s Employment report may be worse than expected. When employment came in this morning much worse than expected the market tanked with the Dow seeing lows of -190.00 points, S&P500 -20.00 points and the Nasdaq -60.00 points midday before bouncing a little! The final hour saw
At the close the Dow was down by -124.00 points to 12,772.00, S&P 500 -13.00 points to about 1355.00, S&P 100 -5.00 points to 620.00 and the Nasdaq Composite -39.00 points to about 292937.00. Oil fell pretty good down -$3.00 around the $84.00 level.
Last month there was only a meager +80,000 jobs created in June, falling short of market expectations and confirming that the labor market cooled off considerably in the second quarter. Economists expected a +100,000 increase. The unemployment rate, meanwhile, was unchanged at 8.2%. Employment gains for May and April were basically unchanged. The number of new jobs created in May was revised up to +77,000 from an original estimate of +69,000, while April's figure was revised down to +68,000 from +77,000. The biggest gains in June occurred in the fields of professional services (47,000), health care (13,000) and manufacturing (11,000). The private sector only added +84,000 jobs in total. The average workweek last month rose +0.1 hour to 34.5, while average hourly earnings climbed +6 cents to $23.50.
Yesterday it was reported that Private-sector payrolls rose +176,000 in June, led by small businesses and the service-providing sector, according to the ADP employment report. The May level was revised to a gain of +136,000 from a prior estimate of +133,000. Markets look to ADP's report on private-sector payrolls to provide some guidance on the jobs estimate, which will be released Friday and includes information on both private- and public-sector payrolls. Economists expect the the report Friday to see employment rise +100,000 in June, compared with +69,000 in May. They also expect that the unemployment rate remained at 8.2%.
The number of people who filed requests for jobless benefits declined by -14,000 last week to 374,000, the lowest level in six weeks. Claims from two weeks ago were revised up to 388,000 from an originally reported 386,000. Economists had projected claims would total 386,000. The average of new claims over the past four weeks, meanwhile, dropped by -1,500 to 385,750, though it's still near the highest level of the year. Continuing claims rose +4,000 to a seasonally adjusted 3.31 million. Continuing claims are reported with a one-week lag. About 5.87 million people received some kind of state or federal benefit in the week ended June 16th, down -20,439 from the prior week. Total claims are reported with a two-week lag.
Wednesday, July 4, 2012
Yesterday the market rallied on incredibly thin volume going into the holiday today with the Dow seeing highs of +80.00 points, S&P500 +10.00 points and the Nasdaq +25.00 points and closed very near there!!! At the close the Dow was up by +72.00 points to 12,944.00, S&P 500 +9.00 points to about 1374.00, S&P 100 +3.25 points to 629.00 and the Nasdaq Composite +25.00 points to about 2976.00. Oil rallied hard closing up +-$4.00 around the $88.00 level. The market is getting overbought in the short term so it will be interesting to see how it closes out the week!
Manufacturing activity shrunk in June for the first time in three years as new orders dried up with the Institute for Supply Management’s manufacturing index falling to 49.7% from 53.5% in May, in the first reading below the 50% line indicating contraction in the economy not seen since July 2009. The report was worse than forecast of 52.3%. The -12.3% point drop in the new-orders index was the largest since the -12.4% point drop in October 2001, just a month after the terrorist attacks on the World Trade Center! The production index dropped sharply by -4.6% points to 51%, while the employment index edged back modestly to 56.6% from 56.9%. Meanwhile it was reported Construction spending grew a little after nearly a one-third drop in both prices and activity from when the bubble burst.
Monday, July 2, 2012
The market started the day a little higher with the Dow seeing highs of +25.00 points, S&P500 +4.00 points and the Nasdaq +15.00 points but then fell after more poor economic data came out just after the open with the Dow seeing lows of -90.00 points, S&P 500 -7.00 points, and the Nasdaq -15.00 points. Of course it came back in the final hour to close mixed with the Dow down by -9.00 points to 12,871.00, S&P 500 +3.00 points to about 1366.00, S&P 100 +1.50 points to 625.00 and the Nasdaq Composite +16.00 points to about 2951.00. Oil also fell on the poor economic data closing down -$1.10 around the $83.00 level.
Manufacturing activity shrunk in June for the first time in three years as new orders dried up with the Institute for Supply Management’s manufacturing index falling to 49.7% from 53.5% in May, in the first reading below the 50% line indicating contraction in the economy not seen since July 2009. The report was worse than forecast of 52.3%. The -12.3% point drop in the new-orders index was the largest since the -12.4% point drop in October 2001, just a month after the terrorist attacks on the World Trade Center! The production index dropped sharply by -4.6% points to 51%, while the employment index edged back modestly to 56.6% from 56.9%. Meanwhile it was reported Construction spending grew a little after nearly a one-third drop in both prices and activity from when the bubble burst.
Sunday, July 1, 2012
Yesterday the market was down hard on worries about the EU having no resolutions for its continued economic and debt problems with some countries and the fact that economic data over here was poor but when rumors started coming out that there may be a resolution the market came back from some pretty steep losses to close only slightly lower. When it was announced that the latest EU summit in Brussels had policy makers agreeing to relax repayment conditions for Spanish banks and to lower the bar to possibly give aid to Italy, along with proposing a $149 billion economic-growth plan for the region it seemed like great news and the market rallied hard! When you think about it however all it is is throwing more money at the problem and “hoping”,,,,, it will be in a better position to pay it back at some date in the future. The problem is that if this is essentially their plan it doesn’t really address the problem so it will be interesting to see how the market acts next week when month end window dressing isn’t factored in anymore and questions come to the forefront once again!
The Dow saw highs basically right at the close with the Dow up by +278.00 points to 12,880.00, S&P 500 +33.00 points to about 1362.00, S&P 100 +15.00 points to 624.00 and the Nasdaq Composite +85.00 points to about 2935.00. Oil really rallied as the to close up +$6.00 around the $85.00 level.
Consumer spending fell slightly in May and was revised downward in April. Spending declined by less than -0.1% last month. Spending for April was revised down to a +0.1% increase from an original +0.3% gain. Personal income, meanwhile, rose +0.2% in May, while disposable income adjusted for inflation climbed +0.3%, reflecting a decline in energy costs. Economists forecast no increase in spending and a +0.2% rise in personal income. Since incomes rose faster than spending, the personal savings rate rose to +3.9% from +3.7%. Also in May, inflation as gauged by the PCE price index fell +0.2%. Excluding food and energy, the price index rose +0.1%.
Yesterday it was reported that the economy grew +1.9% in the first quarter, unchanged from the government's prior estimate. In the third and final release of first-quarter GDP, the biggest changes took place in corporate profits, exports and imports. Corporate profits actually fell $6.8 billion, the biggest drop since late 2008 - instead of rising $11.4 billion as previously estimated. Exports, meanwhile, rose a slower +4.2% in the first three months of 2012, down from the prior estimate of +7.2%. Imports climbed a smaller +2.7% vs. the earlier reading of +6.1%. Also, personal consumption expenditures rose +2.5% instead of +2.7% as previously reported. Disposable income climbed a faster +0.7% vs. +0.4%.
Jobless Claims fell by -6,000 last week to 386,000. Claims from two weeks ago were revised up to 392,000 from an original reading of 387,000. Economists had projected claims would fall to a seasonally adjusted 385,000. The average of new claims over the past four weeks, meanwhile, edged down by -750 to 386,750, remaining near a seven-month high. Continuing claims decreased by -15,000 to a seasonally adjusted 3.29 million. Continuing claims are reported with a one-week lag. About 5.89 million people received some kind of state or federal benefit in the week ended June 9th, up +71,724 from the prior week. Total claims are reported with a two-week lag.
Wednesday, June 27, 2012
The market continued to move up today after closing slightly higher yesterday and saw highs midday with the Dow seeing +110.00 points, S&P 500 +14.00 points and the Nasdaq +35.00 points. Selling took hold in the final hour but it was able to still hold decent gains to see the Dow close up by +92.00 points to 12,627.00, S&P 500 +12.00 points to about 1332.00, S&P 100 +6.00 points to 611.00 and the Nasdaq Composite +21.00 points to about 2875.00. Oil rallied as the market was higher the past couple of days to close up +$1.00 around the $80.00 level.
The market has bounced mainly as a relief rally as the market was getting quite oversold but we could see more downside as the EU is looking like it will remain in trouble for a while longer as Chancellor Angela Merkel told Germany's parliament today that there is no quick fix for the euro-zone's debt crisis and that the introduction of euro bonds at this stage would be "economically wrong," and not in my lifetime will I allow it news reports said. "Joint liability can only happen when sufficient controls are in place," Merkel said, according to Reuters. Merkel is set to meet with French President Francois Hollande in Paris later as European leaders prepare for a two-day Brussels summit that begins Thursday. Merkel is resisting pressure from Hollande and other European leaders to facilitate a move toward mutualizing euro-zone debt in an effort to bring down borrowing costs for countries such as Italy and Spain.
How could this affect us over here. It has just been reported that Stockton California is about to become the nation's largest city to seek protection under the U.S. bankruptcy code. The city stopped making bond payments, and City Manager Bob Deis said he expected to file bankruptcy papers immediately as they are about $700 million dollars in debt. Stockton has been in negotiations with its creditors since late March under AB 506, a new California law requiring mediation before a municipality can file for reorganization of debt. It was the first use of the law, and policy analysts who watched its torturous and tedious progress have titled their report on it "Death by a Thousand Meetings." Mediations ended Monday at midnight.
How Stockton found itself so mired in debt can be seen everywhere in the city's core. There is a sparkling marina, high-rise hotel and promenade financed by credit in the mid-2000s, mere blocks from where mothers won't let their children play in the yard because of violence. During the economic boom, this working-class city with pockets of entrenched poverty tried to reinvent itself as a draw to Bay Area refugees and a popular site for conventions. It offered generous city employee pension plans and benefits such as retiring fireman and police at the age of 50 getting lifetime pensions of $100,000 per year. Vast housing tracts of two-story homes were built at the city's edges. Private citizens, like the city, bought on credit. Those neighborhoods would soon have among the highest rates of foreclosures in the nation. Indeed, when the bust came, few places fell as hard as Stockton. The city has the second-highest rate of foreclosures in the country and the second-highest rate of violent crime in the state. The city made $90 million in drastic cuts from the general fund in the last three years, including reducing the Police Department by 25%, the Fire Department by 30%, and cutting pay and benefits to all employees. There is a state investigation into whether Stockton's financial devastation was entirely due to shortsighted optimism or if there was corruption. The state mediation law requires assigning blame.
Orders for long-lasting goods rose +1.1% in May after falling in the prior two months. Economists had expected orders to be unchanged. The biggest increase occurred in the commercial-aircraft segment, with bookings up +4.9%. Omitting the transportation sector, orders rose +0.4%. Orders for core capital goods excluding defense and transportation, a key barometer of business spending, climbed +1.6% last month to mark the first gain since February. Orders for April were revised down to a -0.2% decline from a prior reading of no change.
Pending home sales climbed +5.9% in May to match a two-year high, a trade group said Wednesday. The National Association of Realtors said its pending-home-sales index rose to 101.1% in May from 95.5% in April. The index is +13.3% above May 2011 levels. May marked the highest level since the scheduled expiration of the home buyer tax credit in April 2010. A sale is listed as pending when the contract has been signed but the transaction has not closed. An index of 100 is equal to the average level of contract activity during 2001.
Yesterday it was reported that Consumer confidence has declined for a fourth month, with poor views in June on future business conditions and income, the Conference Board reported. The consumer-confidence index fell to 62% in June, the lowest level since January from a revised 64.4% in May. A prior estimate for May had pegged the level at 64.9%. Generally when the economy is growing at a good clip, confidence readings are at least 90%. Economists had expected confidence to decline to 63% in June, driven by weak jobs data, and ongoing political and economic challenges.
Home prices shot up in April for the first monthly gain since last autumn, according to a closely followed index. The S&P/Case-Shiller 20-city composite index gained +1.3% with 19 out of 20 cities registering gains, to take the year-on-year drop from -2.6% to -1.9%. Of the 20 cities measured, only hard-hit Detroit took a step backward with a -3.6% reversal. Even Atlanta, where prices were -17% below year-ago levels, enjoyed a +2.3% monthly gain. San Francisco enjoyed a +3.4% gain.
Monday, June 25, 2012
The market opened down pretty hard this morning on worries about the EU and the possibility of the Supreme court overthrowing Obama’s health care plan. I also think it was down because polls showed Obama coming back a bit in the Presidential race! Lows were hit midday with the Dow seeing -190.00 points, S&P 500 -26.00 points and the Nasdaq -65.00 points and even though there was a bounce in the final hour the market remained lower for the day. At the close the Dow was down by -140.00 points to 12,502.00, S&P 500 -21.00 points to about 1314.00, S&P 100 -9.00 points to 603.00 and the Nasdaq Composite -56.00 points to about 2836.00. Oil was down all day at one point over a -$1 but came back to close down only -$.55 around the $79.00 level.
Sales of new single-family homes rose +7.6% to an annual rate of 369,000 in May to mark the highest level in more than two. Sales for April were unchanged at 343,000, seasonally adjusted. Economists had expected new-home sales to rise to annual rate of 348,000 in May. The median sales price fell -0.6% to $234,500 last month. Lower prices, low interest rates and warmer weather likely gave a small boost to sales. The supply of new homes on the market, at current sales pace, fell to 4.7 months from 5 in April. Even with the latest increase, however, sales of new homes are far below the normal level and reflect an industry still trying to dig out of its worst slump in modern times.
Friday, June 22, 2012
Today the market not surprisingly jumped higher first thing in the morning as the sell off yesterday was pretty strong and in the shortest of terms it was oversold! We are really loving this volatility right now as this has helped to get great fills on trades. It will be interesting to see how things go next week as we’ll have more economic data out and the ongoing EU saga will likely come into play again! The Dow saw highs of +10.00 points, S&P 500 +13.00 points and the Nasdaq +35.00 points going into the final hour. At the close the Dow was up by +67.00 points to 12,641.00, S&P 500 +10.00 points to about 1335.00, S&P 100 +5.00 points to 613.00 and the Nasdaq Composite +33.00 points to about 2892.00. Oil rallied after a -$6.00 loss in two days closing up $1.75 around the $80.00 level.
Thursday, June 21, 2012
The market started the day slightly higher with the Dow up +30.00 points, S&P 500 +3.00 points and the Nasdaq +5.00 points even though it was reported that Moody's will announce its downgrades of many of the world's biggest banks later on either tonight or this weekend. Then came some very poor economic data just after the open and the market tanked with the Dow seeing lows of -240.00 points, S&P 500 -29.00 points and the Nasdaq -75.00 points. At the close the Dow was down by -250.00 points to 12,574.00, S&P 500 -30.00 points to about 1326.00, S&P 100 -13.00 points to 607.00 and the Nasdaq Composite -71.00 points to about 2859.00. Oil sold off strongly once again closing down another -$3.25 around the $78.00 level even though our gas prices are near record highs! Even Goldman Sachs came out after the close and did a bearish call on the S&P 500 to fall to 1285 so things aren’t looking to good for the market here. It was quite overbought in the medium term though so a pullback was due and as we move into the weekend were not likely to see much of a bounce tomorrow!!
It was the manufacturing activity in the Philadelphia region that was why the market sold off so strongly with it contracting at its faster pace in June, the Fed’s Bank of Philadelphia reported. The Philly Fed diffusion index fell to negative -16.6% in June from negative -5.8% in May. This is the lowest level since August 2011. Readings below zero indicate contraction and the decrease in the index was unexpected. Economists were looking for the index to improve to 0%. The details of the report were generally weaker except for employment data, which was mixed. The new orders index fell to negative -18.8% from negative -1.2%, while the shipments index fell to negative -16.6% from -3.5%. The index for number of employees improved to +1.8% in June from negative -1.3% in the prior month. The average workweek dropped to negative -19.1% from negative -5.4%. Inflationary pressures eased with the prices paid index dropped to negative -2.8% from -5% in the prior month.
Jobless claims fell by -2,000 last week to 387,000, indicating little change in labor-market conditions. Claims from two weeks ago were revised up to 389,000 from 386,000. Economists had projected claims would fall to a seasonally adjusted 385,000. The average of new claims over the past four weeks, meanwhile, climbed by +3,500 to 386,250, marking the highest level in almost seven months. Continuing claims were unchanged at a seasonally adjusted 3.30 million. Continuing claims are reported with a one-week lag. About 5.83 million people received some kind of state or federal benefit in the week ended June 2nd, down -1,164 from the prior week.
Sales of existing homes fell -1.5% in May as fewer cheap homes were sold. The National Association of Realtors said sales in May reached a seasonally adjusted annual rate of 4.55 million, from an unrevised level of 4.62 million in April. Compared to a year ago, sales were up +9.6%, the 11th straight month of year-on-year gains. Though the economy hit a little soft spot, the pullback was largely due to an inventory shortage of lower-priced homes, according to Lawrence Yun, chief economist of the NAR. Median prices gained +7.9% year-on-year to $182,600, the highest since June 2010, when the first-time homebuyer tax credit was about to expire. That big gain is due to a shift in the types of homes being sold, rather than re-sale price gains, which is how other home-price gauges are calculated.
The risk of a downturn in the second half of this year is relatively low as it reported that its index of leading economic indicators rose +0.3% in May. "Economic data in general reflect a U.S. economy that is growing modestly, neither losing nor gaining momentum," said Ken Goldstein, economist at the Conference Board, a private research group. However, he added that ongoing U.S. and international challenges are making economic strengthening "difficult." Economists had expected a May gain of +0.1%, following a decrease of -0.1% in April. The LEI is a weighted gauge of 10 indicators that are designed to signal business cycle peaks and troughs. Among the 10 indicators that make up the LEI, seven made positive contributions in May, led by building permits. In the six months through May, the LEI rose +1.8%, compared with a decline of -0.1% in the prior six months.
Wednesday, June 20, 2012
The market started the day on the downside as traders awaited the Fed’s decision on interest rates and if they would continue “operation twist” to keep feeding the market. After the 12:30 est announcement that said interest rates would remain the same and Bernanke told reporters at his press conference that he was watching the labor market closely the market rebounded after an initial sell off with the Dow seeing lows of -100.00 points, S&P 500 -12.00 points and the Nasdaq -20.00 points. “We still do have considerable scope to do more and we are prepared to do more,” Bernanke said. “If we’re not seeing sustained improvement in the labor market that would require additional action.” Keeping “Operation Twist” in place “should put downward pressure on longer-term interest rates and help to make broader financial conditions more accommodative,” according to the central bank. This helped the market to bounce with The Dow seeing highs of +45.00 points, S&P 500 +4.00 points and the Nasdaq +15.00 points.
At the close the Dow was down by -13.00 points to 12,824.00, S&P 500 -2.00 points to about 1356.00, S&P 100 -.70 points to 620.00 and the Nasdaq Composite +.70 points to about 2930.00. Oil sold off strongly today closing down -$3.20 around the $81.00 level.
Tuesday, June 19, 2012
The market was basically straight up today as there was no news from the EU and the Fed started the first of two days of meetings. Many analysts are hoping for another round of stimulus and that was the reason given for the rally today. Volume was incredibly low however indicating that the move may be getting old!! The Dow saw highs midday up +160.00 points, S&P 500 +19.00 points and the Nasdaq +50.00 points. Selling or should I say rationality came into play in the final hour however at the close the Dow was up by +96.00 points to 12,837.00, S&P 500 +13.00 points to about 1358.00, S&P 100 +6.00 points to 621.00 and the Nasdaq Composite +34.00 points to about 2930.00. Oil was up all day closing up +$.90 around the $84.00 level.
Construction on new homes fell -4.8% in May to an annual rate of 708,000, but permits climbed +7.9% to the highest level in nearly four years. Economists had expected starts to total 720,000 on an annualized basis. Housing starts in April were revised up to 744,000 from an original reading of 717,000, the best move in construction since October 2008. And permits for new construction, viewed as a gauge of future demand, jumped to an annual rate of 780,000 from April's upwardly revised level of 723,000. This is the highest rate since September 2008. Permits for single-family homes, which account for three-quarters of the housing market, rose +4% to an annual rate of 494,000 last month and is the highest level since March 2010.
Monday, June 18, 2012
Well the start of this expiration started strongly to the downside with the Dow seeing lows of -70.00 points, S&P 500 -8.00 points and the Nasdaq -20.00 points. It then came back as the day wore on for no real reason except to ignore the problems in the EU with the Dow seeing highs of +25.00 points, S&P 500 +6.00 points and the Nasdaq +25.00 points midday. At the close the Dow was down by -25.00 points to 12,742.00, S&P 500 +2.00 points to about 1345.00, S&P 100 +.50 points to 615.00 and the Nasdaq Composite +23.00 points to about 2895.00. Oil was down all day closing down -$.70 around the $83.50 level.
The market is still at an interesting place and there is more evidence that the economy may be slowing. Starbucks stock has been rolling over in the last few weeks. It makes sense to ask if the stock is telling us something about consumer spending. Starbucks topped in the middle of April about ten days before its most recent earnings report failed to meet expectations. The company has been doing a lot of things right in the last few years, and the stock had been moving nicely higher. Now it seems the stock is falling steadily. Of course this could mean the economy is slowing but Starbucks has expanded aggressively in China and has a growing presence in the Middle East as well as Europe and all of those areas are weakening. One thing that confirms it may be seeing slowing sales here is that the most recent set of employment numbers in the U.S. showed a fair amount of weakness which led to selling in Starbucks, along with the rest of the market.
There has also been a slowing of consumer spending on credit cards in the last month and retail sales were lower in the most recent reading. It all adds up to one thing, a slowing economy. When people feel are feeling good they often go to Starbucks, where a good jolt of caffeine energizes as well as provides a reward to the taste buds but if they’re feeling a bit worse about things they may not want to spend big bucks for a latte. Starbucks may be telling us that the global economic problems may be starting to have an effect on the U.S. economy, especially among those who have managed to find work during these troubled times.
Friday, June 15, 2012
This was one of the quietest quadruple witching expirations that I have seen in a while although volume was pretty good all day. The good news is that we saw full profits on both sides of trades as volatility really kicked up this past cycle. It was interesting that it was up today as Greece is voting in a new government this weekend so that could have an effect on their future and how the EU deals with them and an example of what may happen to other troubled countries such as Spain and Italy. The market continued to climb all day with the Dow seeing highs of +125.00 points, S&P 500 +15.00 points and the Nasdaq +40.00 points in the final hour. At the close the Dow was up by +115.00 points to 12,767.00, S&P 500 +14.00 points to about 1343.00, S&P 100 +6.00 points to 615.00 and the Nasdaq Composite +36.00 points to about 2873.00. Oil was flat closing up +$.10 at one point around the $85.00 level.
The Empire State manufacturing index declined sharply to only 2.3% in June, the New York Fed said. The decline was larger than expected as economists expected the index to pull back to 12.8% in June. The index had rebounded in May to 17.1% after having fallen sharply in April. In June, underlying conditions were also poor. The new orders and shipment indices decreased. Two readings on employment were weaker. The index for prices paid pulled back. A reading of expected conditions in six-months fell back to 23.1% from 29.3% in May, the fifth straight monthly decline.
Industrial production weakened in May as output of cars and other items slowed, according to data that show the impact of a deteriorating global economy. The Fed said Industrial Production fell to a seasonally adjusted 0.1% in May after gaining +1% in April. April's reading was downwardly revised from an initially reported 1.1% expansion. Economists had expected no change in May. Industrial output was +4.7% stronger than the same period of last year. Capacity utilization declined -0.2 percentage point to 79%, though that still tied for the second-highest reading of the year.
Thursday, June 14, 2012
Just wanted to say thanks for all the birthday wishes, another year flew by, who knew that once you hit 20 they start going faster haha!!
Yesterday the market closed down almost a full percent as economic data wasn’t that great with Retail Sales down for the second month in a row but of course this being the day before expiration the market started the day higher even though economic data wasn’t that good this morning. As the day went on it was starting to turn negative until the final hour when news broke that central banks were preparing a coordinated effort to provide liquidity after the Greek election! This caused the Dow to see highs of +205.00 points, S&P 500 +20.00 points and the Nasdaq +25.00 points in the final hour. At the close the Dow was up by +155.00 points to 12,651.00, S&P 500 +14.00 points to about 1329.00, S&P 100 +7.00 points to 609.00 and the Nasdaq Composite +18.00 points to about 2836.00. Oil was higher all day closing up +$2.00 at one point around the $85.00 level.
The market has a lot of headwinds going against it right now as world bank after bank is being downgraded by Fitch, Moddy’s or S&P. It’s no wonder as country after country is literally melting down and instead of reigning in spending they’re just borrowing more like Spain who is going to be given 5 years before having to pay back their loans and supposedly it will be around 10-years at 3%! Why not, at least that way they can pretend they are going to pay everyone back, rather than watch them default just a few months after we lend them the money, like Greece!! Italy is the next crisis it looks like as their 10-year bond yields climbed over 6% as Italy's $2.4Tn debt (120% of GDP) running at 6% interest ($144Bn a year = 7.5% of GDP) is going to require a lot more than $100Bn to stop the problems. At the same time they have decided to “tax the rich” or everyone for that matter and guess what, those type of austerity measures have choked economic growth, causing Italy's economy to contract -0.8% in the first four months of the year. I can’t see this ending well but its appearing it will be a slow drip type process until no one can lend anymore and we actually see a default!
This morning it was reported that Jobless Claims climbed by +6,000 to a seasonally adjusted 386,000 while claims from two weeks ago were revised up to 380,000 from an original reading of 377,000, based on more complete data collected at the state level. Economists had projected claims would fall to 376,000. The level of claims is a rough gauge of whether layoffs are rising or falling. The average of new claims over the past month rose by +3,500 to 382,000, the highest level in six weeks. The four-week average reduces seasonal volatility in the weekly data and is seen as a more accurate gauge of labor-market trends. Continuing claims fell by -33,000 to a seasonally adjusted 3.28 million. Continuing claims reflect the numbers of people already receiving benefits. About 5.82 million people received some kind of state or federal benefit in the week ended May 26th, down -145,990 from the prior week. Total claims are reported with a two-week lag.
Consumer prices fell -0.3% in May to mark the biggest decline in three and a half years, as the cost of gas fell sharply. The gas index sank -6.8%, the largest drop since December 2008. So-called core prices, which take out the unneeded food and energy costs, rose a seasonally adjusted +0.2% last month. Economists had forecast a -0.2% decrease in the main CPI but a +0.2% hike in the core rate. Consumer prices have risen an unadjusted +1.7% over the past 12 months, down from +2.3% in April. The core rate has increased +2.3% over the past 12 months, the same as in April. The government also reported that inflation-adjusted hourly wages, on average, climbed +0.3% in May. A +0.1% increase in average hourly earnings, combined with the +0.3% drop in the cost of living, accounted for the gain.
The nation’s current account deficit widened to a three-year high of $137.3 billion in the first quarter. The wider gap reflected a decrease in the surplus on income and a greater deficit on goods and services. It’s the largest deficit since the fourth quarter of 2008. The current account is the broadest measure of international flows of goods, services and capital in and out of the United States. Figures aren’t adjusted for price changes.
In essence, it measures how much Americans need to borrow from abroad to fund their consumption and investment. In the first quarter of 2012, the current account deficit totaled 3.6% of gross domestic product, the highest percentage since the fourth quarter of 2008. The surplus on income decreased to $47.6 billion in the first quarter from $59.9 billion in the final three months of 2011, in part due to rising dividend payments to foreigners.
Yesterday it was reported that Retail sales fell -0.2% in May, largely because of less spending on gas, as consumers cut overall purchases for the second month in a row. The Commerce Department also revised April sales lower to a -0.2% decline from an original reading of a +0.1% increase. It was the first back-to-back drop in two years. Excluding autos, sales fell -0.4%. Excluding gas, overall retail sales rose a slight +0.1% and were a mixed bag. Sales fell -2.2% at gas stations to reflect a sharp decline in oil prices. And sales fell -1.7% at building materials and home-improvement stores, -0.5% at general-merchandise stores and -0.2% each at bars, restaurants and grocery stores. Yet auto sales climbed +0.8%, as did sales at electronics and appliance stores. Internet retailers posted a +1.3% increase and clothing stores saw a +0.9% gain last month.
Tuesday, June 12, 2012
Wow here’s a shocker! The Federal Reserve reported this morning that the median wealth of families in America fell by a staggering -39% or $126,400 to $77,300 from 2007-2010 and is now back to 1992 levels which means an entire generation of people have lost it all. Of course this is mostly due to the housing crisis and the scary thing is that home values have since hit new lows so it could be even lower now!!!
The market started the day higher but as it wore on and worries about Spain, Italy and Greece grew it became mixed but because this is the last week for June option trading before expiration it rallied a bit with the Dow seeing highs of +170.00 points, S&P 500 +16.00 points and the Nasdaq +35.00 points in the final hour. At the close the Dow was up by +163.00 points to 12,573.00, S&P 500 +15.00 points to about 1324.00, S&P 100 +7.00 points to 606.00 and the Nasdaq Composite +33.00 points to about 2843.00. Oil was lower most of the day but rallied at its close up almost +$2.00 at one point around the $83.50 level.
Monday June 11th 4:03 pm est.
The market took off yesterday morning as Spain made a deal over the weekend to accept $100 billion dollars to push their problems to the back burner for another six months!!
The Dow shot up in the first few minutes of trading up +100.00 points, S&P 500 +10.00 points and the Nasdaq +25.00 points. Of course reality hit later on and the market started to pull back as the Euro weakened against the dollar. This of course hit oil as it also started to fall so commodities were no help. When Apples conference didn’t bring out anything really exciting like the Apple TV many analysts were waiting for, there was nothing to hold the market back and it sold off in the final hour with the Dow down -160.00 points, S&P 500 -18.00 points and the Nasdaq -55.00 points.
At the close the Dow was down by -143.00 points to 12,411.00, S&P 500 -17.00 points to about 1309.00, S&P 100 -49.00 points to 599.00 and the Nasdaq Composite -49.00 points to about 2810.00. Oil sold off down almost -$3.00 at one point around the $81.50 level.
Friday, June 8, 2012 4:03 pm est.
Interesting: Consumer debt shows signs of slowing. According to The Wall Street Journal: "U.S. consumer credit grew at a slower pace than expected in April while March figures were revised downwards, the latest indications of headwinds facing the U.S. economy." The interesting part of this in the statement is that they make it sound bad that people are getting out of debt and not running up their credit cards!!
The market was down first thing this morning because going into the weekend there is a possibility that something bad good happen Europe. The Dow was down -70.00 points, S&P 500 -7.00 points and the Nasdaq -15.00 points. It didn’t last though as volume fell off the cliff so on incredibly thin volume with the Dow hitting highs in the final hour up +10.00 points, S&P 500 +11.00 points and the Nasdaq +30.00 points. The market ended the week pretty strongly but on incredibly light volume so it appears that no one is rolling into the July options yet so the question is will volatility pick up once again next week!!
At the close the Dow was up by +93.00 points to 12,554.00, S&P 500 +11.00 points to about 1326.00, S&P 100 +5.00 points to 605.40 and the Nasdaq Composite +27.00 points to about 2858.00. Oil sold off strongly today down almost -$2.00 at one point before turning around to close down by -$.40 around the $84.40 level.
This morning it was reported that the Trade deficit narrowed by a seasonally-adjusted -4.9% in April to $50.1 billion. The trade deficit was above the consensus forecast of economists of a deficit of $48.0 billion. The report included annual benchmark revisions which shifted the level of the deficit in March up to $52.6 billion from the prior estimate of $51.8 billion. Both imports and exports declined in April after hitting record highs in the prior month. The trade deficit with China widened to $24.6 billion in April compared with $21.6 billion in the same month last year. The country specific trade data is not seasonally adjusted.
Thursday, June 7, 2012 4:03 pm est.
The market started the day strongly on hopes that Fed chief Ben Bernanke’s testimony to Congress this morning would confirm a stimulus plan coming down the pike for Quantitative Easing #3, (QE3) and the fact that China lowered interest rates overnight to help stimulate their economy! The Dow was up +140.00 points, S&P 500 +14.00 points and the Nasdaq +30.00 points. Unfortunately after his statement was released and he never mentioned anything, gains were cut in half and when Spain was downgraded by Fitch from A to BBB that pulled all the steam out of the market and it closed mixed on the day!!!
At the close the Dow was up by +46.00 points to 12,461.00, S&P 500 -.15 points to about 1315.00, S&P 100 +.50 points to 600.60 and the Nasdaq Composite -14.00 points to about 2831.00. Oil started the day stronger but pulled back by the close to finish the day down by -$1.25 around the $84.00 level.
This afternoon it was reported that Spain's sovereign debt rating was slashed three steps Thursday by credit rating agency Fitch, which warned that the nation is at risk of being downgraded into junk bond status. The nation's debt rating was cut from "A" all the way to "BBB," the lowest rating that is considered investment grade. And the new rating was given a negative outlook, meaning it at risk for further downgrades. Fitch pointed to the estimated cost of a Spanish bank bailout, which it said is likely to cost between €60 billion to €100 billion, as well as a prolonged recession that Fitch now expects to run throughout 2013. "Spain's high level of foreign indebtedness has rendered it especially vulnerable to contagion from the ongoing crisis in Greece," the agency said in the note. "The much reduced financing flexibility of the Spanish government is constraining its ability to intervene decisively in the restructuring of the banking sector and has increased the likelihood of external financial support." At first the market didn’t react much to the report as countries are being downgraded all over the world but as the day went by it did seem to have an effect.
China's central bank lowered interest rates on loans and deposits, and moved to allow rates to float more freely, in a bid to support economic growth and advance reform of the financial system. The reason of course was to ease concerns about a slowdown in China's economy because it worked so well here, haha!!! The Bank of China said in a statement on its website it will lower benchmark one-year lending and deposit rates by -0.25 percentage point, effective Friday. It also will begin allowing deposit rates to float higher and lending rates to float lower than under current regulations. In effect, maximum deposit rates will rise slightly after the changes, and minimum lending rates will fall sharply.
This morning it was reported that the Fed stands ready to act to protect the financial system and the economy in the event that financial stresses from the European crisis escalate, Fed Chief Ben Bernanke said this morning. In testimony prepared for delivery to the Joint Economic Committee of Congress, Bernanke stuck to his April forecast that growth will continue at a moderate pace. He said the recovery had been helped by consumer spending, as people had more money to spend given the drop in gasoline prices. Business caution continued to restrain the economy, he noted. Bernanke said some of the apparent slowing in economic data, including last Friday's weak jobs number, might be due to unusually warm weather this past winter, which may have brought forward some activity. There have been a few encouraging signs in the housing market, he also noted. The Fed's incredibly low interest rate policy is justified given high unemployment, subdued inflation and "the presence of significant downside risks," he said even though it hasn’t really worked!!
Jobless Claims fell by -12,000 last week to 377,000 while claims from two weeks ago were revised up to 389,000 from 383,000. Economists had projected claims would fall to a seasonally adjusted 380,000. The average of new claims over the past four weeks, meanwhile, edged up by +1,750 to 377,750, the highest level in a month. Continuing claims increased by +34,000 to a seasonally adjusted 3.29 million. Continuing claims are reported with a one-week lag. About 5.97 million people received some kind of state or federal benefit in the week ended May 19th, down -167,133 from the prior week. Total claims are reported with a two-week lag.
Wednesday, June 6, 2012 4:03 pm est.
Well today was the day that saw the market basically ignore all bad news coming out of the EU and poor economic data and rally hard because guess what,,,, everyone is just going to add more stimulus to the system!!! Maybe a third attempt at adding billions will work this time to get the economy moving or give time for countries like Greece to get their fiscal house in order!!! What a joke is all I have to say,,,, until we see economic reform the same problems will just come up again so it will be interesting to see how long this rally lasts! Nonetheless the market rallied closing basically at its highs with the Dow up by +287.00 points to 12,415.00, S&P 500 +30.00 points to about 1315.00, S&P 100 +14.00 points to 600.00 and the Nasdaq Composite +67.00 points to about 2845.00. Oil was a bit higher by a little less than a dollar around the $85.00 level.
The productivity of workers and businesses fell more sharply in the first quarter than originally estimated, as output was revised lower and hours worked rose slightly faster. Productivity dropped -0.9% in the first three months of the year, compared to an initial estimate of a -0.5% decline. Economists projected a revised -0.8% decrease. Output, the amount of goods and services produced was revised down to a +2.4% increase from +2.7%. The increase in hours worked was revised up to +3.3% from +3.2%. Because of this, unit-labor costs climbed +1.3% in the first quarter instead of +0.9% as originally reported. Adjusted for inflation, hourly wages fell -2% in the first quarter, more than double the initial estimate of a -0.9% decline.
Tuesday, June 5, 2012 4:03 pm est.
The market was down to start the day today and after an initial bounce it went back down again with the Dow seeing lows of -40.00 points, S&P 500 -5.00 points and the Nasdaq -20.00 points. It turned around again though in the afternoon and the final hour saw the Dow up +50.00 points, S&P 500 +10.00 points and the Nasdaq +25.00 points. At the close the Dow was up by +27.00 points to 12,128.00, S&P 500 +7.30 points to about 1286.00, S&P 100 +2.00 points to 586.00 and the Nasdaq Composite +18.00 points to about 2778.00. Oil was a bit higher by a little less than a dollar around the $84.00 level.
Monday, June 4, 2012 4:03 pm est.
Interesting: A poll that was done at the end of last year and a latest one by AIG indicates many people in America feel they will need to work until they are 80 before they can retire! I guess that means more Dunkin Donuts in the U.S and Tim Hortons in Canada!
This morning the market started higher as Europe didn’t implode over the weekend with the Dow up +30.00 points, S&P 500 +6.00 points and the Nasdaq +25.00 points. It fell then however on poor economic data with the Dow seeing lows of -85.00 points, S&P 500 -12.00 points and the Nasdaq -25.00 points midday. The final hour saw another push higher with all indices moving into the green but by the close the market was mixed with the Dow down by -17.00 points to 12,101.00, S&P 500 +.10 points to about 1278.00, S&P 100 -.45 points to 584.00 and the Nasdaq Composite +13.00 points to about 2760.00. Oil was virtually flat all day to finish the day around the $83.00 level.
Europe is a slow motion train wreck of un-paralleled proportions and that is why were seeing this volatility. The mess is so large that no one will ever really know how bad things are and its been going on so long we may miss it when its all over. In the end the only real solution is to scrap everything and start over but of course, that won't happen as the Fed and or EU will pump more money into the system to keep it going for a while longer! What they need to do is let people face reality, take their lumps and move on. We’re following what has been going on in Japan for decades and they still don’t see any resolutions and look at their stock market, new index lows from its highs 20 plus years ago!! This could make for a very interesting summer and fall!! The one thing for sure is that its great for our trading style!!
Orders for goods produced in Factories fell -0.6% in April. Economists expected orders to rise by +0.1%. Factory orders fell a revised -2.1% in March, down from a prior estimate of a -1.5% decline. Orders for durable goods meant to last at least three years were flat while orders for nondurable goods fell -1.1%.
Friday, June 1, 2012 4:03 pm est.
Okay this isn’t a good sign for the European Union. The yield on two-year German government bonds dipped into negative territory for a second day as investors proved willing to pay for the privilege of parking their money in a perceived safe haven amid rising uncertainty over the outlook for the euro zone. With the poor jobs number this morning the American 10-year bond yield at one point hit the 1.42% level!! This is insane and shows incredible signs of distress in Europe!
This morning the market tanked on an incredibly poor employment report out with the market moving lower and lower each hour with the Dow seeing lows of -290.00 points, S&P 500 -34.00 points and the Nasdaq -80.00 points in the final hour. The only good thing was that the lower it went the lower volume went.
At the close the Dow was down by -275.00 points to 12,118.00, S&P 500 -32.00 points to about 1278.00, S&P 100 -14.00 points to 584.00 and the Nasdaq Composite -80.00 points to about 2747.00. Oil really took a hit off -$3.35 to be around the $83.00 level.
Employment saw only +69,000 jobs in May, the smallest increase in a year, the government reported. Economists expected a +170,000 increase. The unemployment rate, meanwhile was bad rising to 8.2% from 8.1%, mainly because more people entered the labor force even as hiring slowed. The private sector added only +82,000 positions. Government jobs dropped by -13,000, dragged down by ongoing belt-tightening by local governments. Construction employment fell -28,000 in May, the fourth straight decline while manufacturing, the recovery's star performer, added +12,000 jobs. Employment gains for April and March were revised lower. The number of new jobs created in April was reduced to +77,000 from an original estimate of +115,000, while March's figure was moved down to +143,000 from 154,000. The labor force participation rate, the share of working-age Americans who either have a job or are looking for one rose to 63.8% after dropping to a 30-year low in April. The actual under or unemployment rate is 14.8% according to the private sector numbers. The average workweek fell -0.1 hour to 34.4 in May, while average hourly earnings climbed +2 cents to $23.41.
The savings rate for households fell in April as spending grew faster than incomes, the Commerce Department estimated. The personal savings rate declined to 3.4% in April from 3.5% in March. The April level matches the February level, which prior to that month was the lowest savings rate since December 2007! Consumers had built up savings during the recession. Economists noted that the savings rate hit a high of 5.6% as recently as the third quarter of 2010. Real (inflation-adjusted) spending increased a seasonally adjusted +0.3% in April after a downwardly revised flat reading in March. Real after-tax incomes rose +0.2% in April, compared with a +0.2% gain in disposable incomes in March. In nominal terms, income rose +0.2% and spending rose +0.3%. Economists had expected +0.3% gains in both income and spending. The personal consumption expenditure price index, a key measure of inflation, was flat in April compared with March and is up +1.8% in the past year. This is down from a +2.1% rate in March. The annual rate in April is below the Fed's +2% inflation target. The core PCE rate rose 0.1% in April, down from the 0.2% gain forecast. Core prices are up 1.9% year-on-year, down from 2% in March.
Conditions for the nation's manufacturers slipped in May after reaching its highest level since last summer in April, the Institute for Supply Management reported. The ISM index fell to 53.5% in May from 54.8% in April and was weaker than expected. Estimates were for the index to fall to 54%. Readings above 50% indicate expansion. Below the headline, the report had some strong elements. The new-orders index rose to 60.1% in May from 58.2% in the prior month. The employment index slipped to 56.9% in May from 57.3% in April. Production fell 5 points to 55.6% while prices dropped sharply.
Construction spending rose +0.3% in April, matching analysts estimates, to a seasonally adjusted annual rate of $821 billion. Private residential construction rose +2.8%, while private nonresidential construction fell -0.2%. Public construction spending fell -1.4%. Compared with April 2011, total construction spending is up +6.8%. Spending in March was revised to a +0.3% gain from a prior estimate of a +0.1% increase.
Thursday, May 31, 2012 4:03 p.m est.
The market was down again this morning with EU worries but more on poor economic data indicating that the economy is slowing once again. The Dow saw lows of -110.00 points, S&P 500 -15.00 points and the Nasdaq -40.00 points. Tomorrow we get the all important employment report out and from what today’s data looks like and the fact that Manpower the hiring company has seen their stock hit more record lows, the job picture may be worse than the expected +170,000 jobs forecast. Another factor was that the yield on the 10-year bond hit 1.52% this morning at one point but turned around because of its overbought condition. This helped the stock market turn around with the Dow seeing +80.00 points, S&P 500 +8.00 points and the Nasdaq +10.00 points until sell programs took the market down at the close to finish in the red. The rally may continue though even if we see a bad jobs number because of the negativity today and its becoming quite oversold in the short term.
At the close the Dow was down by -26.00 points to 12,393.00, S&P 500 -3.00 points to about 1310.00, S&P 100 -1.00 points to 597.00 and the Nasdaq Composite -10.00 points to about 2827.00. Oil was hit again closing down -$1.00 to be around the $86.50 level.
Private-sector payrolls increased +133,000 in May, led by small businesses and the service-providing sector, according to the ADP employment report. The April level was revised to a gain of +113,000 from a prior estimate of +119,000. Markets look to ADP's report on private-sector payrolls to provide some guidance on the employment jobs estimate, which will be released tomorrow and includes information on both private- and public-sector payrolls.
Also out on the jobs picture was the Challenger Job report on layoffs and it revealed that last week's massive -27,000 layoff announcement from Hewlett-Packard made for a strong -61,887 headline in Challenger's layoff count. This compares with -40,559 in April and -37,135 in May last year. But the Hewlett-Packard layoffs, which will extend out to October, are not likely to be a factor for tomorrow's monthly employment report. Outside of computers, layoff announcements in May were heaviest in the transportation and financial sectors.
Jobless Claims were up by +10,000 last week to 383,000, the highest level in five weeks, while claims from two weeks ago were revised up to 373,000 from 370,000. Economists had projected claims would fall to a seasonally adjusted 370,000. The average of new claims over the past four weeks, meanwhile, rose by +3,750 to 374,500. Continuing claims decreased by -36,000 to a seasonally adjusted 3.24 million. Continuing claims are reported with a one-week lag. About 6.14 million people received some kind of state or federal benefit, down -30,753 from the prior week. Total claims are reported with a two-week lag.
Finally on jobs was a report out from Reuters that said: "Small businesses hired fewer workers in May and cut hours for those on their payrolls, an independent survey showed on Wednesday, raising prospects of another disappointing employment report. Businesses added 40,000 new jobs, after increasing payrolls by an upwardly revised 60,000 jobs in April, according to Intuit, a payrolls processing firm. April's job count was previously reported as 40,000."
The economy expanded at a +1.9% annual rate in the first quarter, slower than the +2.2% gain estimated a month ago. The revisions to real gross domestic product were largely due to lower inventory building and trade. Economists were predicting a revision to about +1.8% rate. The economy expanded at a +3% rate in the fourth quarter. Consumer spending rose +2.7% in the first quarter, down from the prior estimate of a +2.9% gain. A key measure of inflation, the personal consumption expenditure price index, rose a revised +2.5%, compared with the initial estimate of a +2.4% gain. Corporate profits before-tax rose +13.2% in the quarter, up from a -0.4% decline in the fourth quarter. Over the past year, corporate profits were up +14.9%.
Wednesday, May 30, 2012 4:03 p.m est.
The market was down pretty hard first thing in the morning as EU worries came back to the forefront as Spain saw money moving out of smaller banks into the bigger ones and this caused the American 10-year bond to fall to a new record low yield in this latest move of 1.62%. The market saw early lows but then bounced a bit during the day before hitting them in the final hour with the Dow off -190.00 points, S&P 500 -23.00 points and the Nasdaq -60.00 points. At the close the Dow was down by -161.00 points to 12,420.00, S&P 500 -19.00 points to about 1313.00, S&P 100 -7.50 points to 598.00 and the Nasdaq Composite -34.00 points to about 2836.00. Oil was hit hard today collapsing under the $90 level closing down -$3.00 to be around the $87.50 level.
An index of pending home sales fell in April for the first time in four months, the National Association of Realtors said. The index dropped -5.5% to 95.5% from a downwardly revised 101.1% in March. March's pending home sales index was initially reported to be 101.4%. Pending sales are still +14.4% higher compared to one year earlier, NAR noted. "Home contract activity has been above year-ago levels now for 12 consecutive months. The housing recovery momentum continues," said Lawrence Yun, the trade group's chief economist. A sale is listed as pending after a contract is signed but the deal has not closed, though the purchase usually is completed within a few months. For the full year, NAR predicts that existing-home sales will reach 4.66 million, up from 4.26 million in 2011. Sales of existing homes are expected to climb to 4.92 million in 2013. Home prices, meanwhile, could rise +2% to 3% in 2012 and +4% to 5% in 2013, the NAR figures but in todays market I think its tough to forecast.
Tuesday, May 29, 2012 4:03 p.m est.
The market took off today on this shortened trading week with hopes that the employment report coming out Friday will be decent and the fact that talk about a Eurobond may come to pass to help alleviate the pressure on some of the Southern European Union countries! The Dow saw early highs of +160.00 points, S&P 500 +18.00 points and the Nasdaq +50.00 points. It almost lost it midday however but buying in the final hour saw it come back near its old highs. At the close the Dow was up by +126.00 points to 12,581.00, S&P 500 +15.00 points to about 1332.00, S&P 100 +6.50 points to 606.00 and the Nasdaq Composite +33.00 points to about 2871.00. Oil was up on the day early on but by the close was flat down -$.03 cents around the $91.00 level.
Home prices were unchanged in March, according to the S&P/Case-Shiller 20-city composite index. The three-month rolling index includes transactions that took place from January to March. Over the past 12 months, prices have fallen -2.6% as measured by the Case-Shiller index, which is now at a post-recession low. "While there has been improvement in some regions, housing prices have not turned," says David M. Blitzer, chairman of the index committee at S&P Indices.
A gauge of Consumer Confidence has declined for a third month, with even worse views in May on present and future conditions, the Conference Board reported. The consumer-confidence index fell to 64.9% in May, the lowest level since January from a revised 68.7% in April. A prior estimate for April pegged the level at 69.2%. The data suggests a moderating pace of economic growth in coming months. Generally when the economy is growing at a good clip, confidence readings are at least 90%. Economists had expected a reading of 69% for May.
Friday, May 25, 2012 4:03 p.m est.
As we went into the long weekend the market continued under pressure all day with the Dow seeing lows of -120.00 points, S&P 500 -7.00 points and the Nasdaq -15.00 points on incredibly low volume in the final hour. One of the reasons was most likely the concerns about the EU and if Greece will be leaving or not. This put pressure on the Euro thus helping the U.S dollar to be strong. There’s also the fact that the economy is definitely slowing according to recent economic data. Gas however has fallen quite a bit which will automatically help the economy as people will be able to spend money on other things other than gas. At the close the Dow was down by -75.00 points to 12,455.00, S&P 500 -3.00 points to about 1318.00, S&P 100 -2.20 points to 599.00 and the Nasdaq Composite -2.00 points to about 2838.00. Oil was up only +$.20 around the $91.00 level.
Brighter views on employment led consumer sentiment higher in May, according to the University of Michigan. The consumer-sentiment index rose to 79.3% in May, the highest level since October 2007, from 76.4% in April. Improved prospects for jobs and wages were the main drivers of the gain, according to the survey. “While gas prices and economic policy debates played a role in the pull backs, changes in job expectations also had a critical impact,” said Richard Curtin, the survey’s chief economist. The brighter view on jobs is somewhat of a surprise given that official government reports indicate slowing employment gains in recent months. Economists had expected a final May reading of 77.8% matching the preliminary estimate for the month. The index averaged about 87% in the year before the recession. Lower gas prices are also cheering consumers, according to the report. Per-gallon gas prices in May have declined about -12 cents to an average of $3.71. The sentiment gauge, which covers how consumers view their personal finances as well as business and buying conditions, is used by economists to get a feel for the direction of consumer spending.
Hope everyone has a great weekend!
Thursday, May 24, 2012 4:03 p.m est.
The market started the day lower once again with the Dow seeing -80.00 points, S&P 500 -9.00 points and the Nasdaq -35.00 points. As volume dwindled the market came back though with the final hour seeing a push higher likely preparing for the upcoming long weekend!!
At the close the Dow was up by +34.00 points to 12,530.00, S&P 500 +2.00 points to about 1321.00, S&P 100 +1.00 points to 601.40 and the Nasdaq Composite -11.00 points to about 2840.00. Oil was actually up +$.60 around the $91.00 level.
Jobless Claims fell by -2,000 last week to 370,000. Claims from two weeks ago were revised up to 372,000 from 370,000. Economists had projected claims would rise to a seasonally adjusted 373,000. The average of new claims over the past four weeks, meanwhile, dropped by -5,500 to 370,000, the lowest level in six weeks. Continuing claims fell by -29,000 to a seasonally adjusted 3.26 million. About 6.17 million people received some kind of state or federal benefit in the week ended May 5th, down -105,004 from the prior week. Total claims are reported with a two-week lag.
Orders for Durable Goods, long-lasting goods edged up +0.2% in April, the second rise in three months after demand for cars and car parts picked up. Durable-goods orders reached a seasonally adjusted $215.5 billion after dropping -3.7% in March. Economists had anticipated a slight fall of -0.4% in April, and March's orders were revised to show a -3.7% drop instead of a previously reported 4% decline. Excluding transportation, orders fell -0.6%, the third decline in four months. Another closely followed element in the report showed weakness, as core capital-goods orders fell -0.2%.
Wednesday, May 23, 2012 4:03 p.m est.
After the big rally on Monday the market closed basically flat and mixed yesterday but today it gave up all of the strong gains on Monday down at one point almost -1.5%. The Dow saw lows of -190.00 points, S&P 500 -20.00 points and the Nasdaq -45.00 points. Oil was off over -$2.00 under the $90 level now. The final hour saw a complete turnaround though with a huge rally and the market once again closed mixed. At the close the Dow was down by -7.00 points to 12,496.00, S&P 500 +2.25 points to about 1319.00, S&P 100 +.55 points to 600.50 and the Nasdaq Composite +11.00 points to about 2850.00. Oil was down but off lows down -$1.15 around the $90.42 level. I must say I’m loving this volatility as the premiums in our sold options are fluctuating greatly and it is being eaten up on both sides as there is no real direction. With the market being so oversold technically and sentiment getting so bad I think we’ll likely continue to see volatility continue here for awhile.
It was reported this morning that Sales of New Homes rose +3.3% in April as the real-estate market continued a slow climb back with them sold at an annual rate of 343,000 last month. Economists expected new home sales last month to total 330,000 on a seasonally adjusted basis. In March, the sales rate was revised up to 332,000 from an original reading of 328,000. The slow housing market recovery took further root in April as sales of existing homes rose +3.4% in April and median prices shot up by over +10%. Over the past three months, sales have averaged 344,000 compared to just 301,000 in the same period one year earlier a +14% increase. A recent survey showed that the confidence of builders is at the highest level in several years. Sales rose +28.% in the Midwest, +27.5% in the West and +7.7% in the Northeast. Only the South reported a decline, with sales down -10.6% in April. Still, more than half of all the new homes sold last month were purchased in the South. The median sales price of new homes, meanwhile, edged up +0.7% last month to $235,700. The supply of new homes on the market dipped to 5.1 months from 5.2 months in March.
Monday, May 21, 2012 4:03 p.m est.
Interesting: Coffee seems to extend lifespan of daily drinkers. According to Bloomberg.com: "Coffee, caffeinated or decaffeinated, appears to extend the lives of people who drink it daily, a U.S. study found. Men who drank 2 to 3 cups a day had a 10 percent chance of outliving those who drank no coffee, while women had a 13 percent advantage, according to research published today in the New England Journal of Medicine." "The study found that men who drank 2 to 3 cups a day had a 14 percent lower risk of dying from heart disease, 17 percent lower risk of dying from respiratory disease, 16 percent decreased chance of dying from stroke and a 25 percent lower risk of dying from diabetes than those who drank no coffee." Finally: "2 to 3 cups of coffee a day had a 15 percent lower chance of dying from heart disease, 21 percent lower risk of dying from respiratory disease, 7 percent decreased chance of dying from stroke and a 23 percent lower risk of dying from diabetes. In most cases, drinking six or more cups a coffee a day for men and women lowered the risk even further, the study showed."
The market popped today which wasn’t that surprising because it was down so hard last week. As volume continued to peter out as the day went on new highs were hit with the Dow seeing highs in the final hour of +140.00 points, S&P 500 +22.00 points and the Nasdaq +70.00 points.
At the close the Dow was up by +135.00 points to 12,505.00, S&P 500 +21.00 points to about 1316.00, S&P 100 +8.00 points to 600.00 and the Nasdaq Composite +68.00 points to about 2847.00. Oil even rallied up +$1.35 around the $93.00 level.
The economy continues to show signs of slowing and one interesting outlook is from the auto parts business as it was hit hard last week as one company warned investors that its business was experiencing a "meaningful slowdown" during the month of April. The auto parts sector had been pushing higher on the notion that people were willing to hold on to their cars longer during a tough economy and now, even that concept is in question. A look at Ford, GM, Toyota, and Honda show that none of those stocks is in an up trend and recent data shows that new car sales have slowed in their growth rates as well. So now, we have fewer new car sales and a "meaningful slowdown" in replacement autoparts. When you add the fact that the 10-year bond yield fell to a new low late last week, you have to consider the notion that the economy may be starting to have its own meaningful slowdown.
Friday, May 18, 2012 4:03 p.m est.
The market ended the week on a sour note down for the third week in a row and off a strong -4% this week alone on poor news about Europe, Apple under pressure and the much touted Facebook IPO basically falling flat on its face! Like no one saw that one coming with the media in hysterics over it!! The good news though is we saw full profits on all trades. The Dow saw lows in the final hour of -110.00 points, S&P 500 -13.00 points and the Nasdaq -40.00 points.
At the close the Dow was down by -73.00 points to 12,369.00, S&P 500 -10.00 points to about 1295.00, S&P 100 -4.00 points to 592.00 and the Nasdaq Composite -35.00 points to about 2779.00. Oil sold off again down another -$1.25 to the $91.30 level.
The market hasn’t seen this hard of a correction in a while but it was much needed as it wasn’t a healthy advance. Although getting incredibly oversold and negative sentiment into extreme territory pressure for the downside could remain for a little while longer however as we are now approaching the summer trading season and June which has always been one of the most up months of the year we could see some strong upside moves also so I think volatility will remain which will be perfect for us!!
Thursday, May 17, 2012 4:03 p.m est.
The past couple of days have seen the market under pressure down about -1% in total both days. This morning it opened down once again with worries about the EU and China slowdown but when some economic data came in way worse than expected indicating that there really may be a slowdown in our economy, the market tanked! Apple was also contributing as it was down pretty good once again now off almost -18% from its high. The Dow saw lows right at the finish of the day of -160.00 points, S&P 500 -20.00 points and the Nasdaq -65.00 points.
At the close the Dow was down by -160.00 points to 12,442.00, S&P 500 -20.00 points to about 1305.00, S&P 100 -8.00 points to 596.00 and the Nasdaq Composite -61.00 points to about 29814.00. Oil continues to move down -$.50 to the $92.50 level. With the market now down 11 of the past 12 sessions it is starting to get oversold technically in the medium term and sentiment is moving into a negative extreme situation as it is now down about -8%, approaching that -10% level from recent highs. Because of this and one day left to expiration it wouldn’t be surprising to see a bounce start anywhere around here even though things all around the world are getting so messed up.
I have been talking about volume in the stock market for the past couple of years as it has been going down and down and this year has seen volume drop to holiday level trading every day. Some days it hasn’t even seen 600 million shares traded. This past weekend it was declared that the stock market is "dead" so said Morgan Stanley's David Darst telling a crowd of "silent" hedge fund managers at the SALT conference in Las Vegas last week, while Senator Rand Paul told a crowd over the weekend that there was a "sickness" in the U.S. This isn’t what people want to hear as the most important election in years is just six months away and they have already started fighting about who will be best. This means that were stuck in the business world and in the political world as governments fall in the Middle East and Europe, and China is now facing its own economic crisis.
Besides that your getting corruption again just like what happened in 2008 with Yahoo's CEO, a victim of his own lies about his qualifications fired over the weekend. Then the problems at J.P. Morgan keep building, making the same kind of self-centered trading mistake that got the economy and banks into trouble in 08. People that work there are getting fired in a hurry. CEO Jamie Dimon fell on his own sword rapidly but its too late. Then you have the FDIC's Vice-Chairman is calling for Wall Street banks to stop trading their own accounts and the President begging for even more stringent rules on the way they can trade.
Then if you look at France. Sarkozy's gone, Italy’s Berlusconi and his Bunga-Bunga room are gone and Germany’s Merkel keeps losing ground in local and state elections. And don't look at Greece because it's too painful and you might get frightened as what happened there could happen anywhere. No wonder the markets are volatile. The whole world is upside down. And there is no apparent solution in sight because the politicians in charge, and their constituents don't want to take responsibility for what has happened. Everyone has screwed up. Expectations got out of control on all sides. And as usual, a few people took advantage of a lot of fools and here we are. In the end the market is facing problems from every which way which is generally when you know your getting closer to a bottom so it will be interesting to see what happens how the summer turns out.
Business conditions at manufacturing firms in the Philadelphia region worsened in May, according to the monthly survey issued Thursday by the Federal Reserve Bank of Philadelphia. The Philly Fed index fell to -5.8 from 8.5 in April, well below expectations. Economists polled by MarketWatch had expected the index to increase to 10.0. Reading below zero indicate that more companies are contracting instead of expanding. The new-orders index dropped to -1.2 from 2.7 in April and the employment index, a gauge of hiring expectations, also turned negative.
Jobless Claims were unchanged last week at 370,000 from two weeks ago were revised up to 370,000 from an initial reading 367,000. Economists had projected claims would fall to 365,000. The average of new claims over the past four weeks, meanwhile, fell by -4,750 to 375,000. Continuing claims increased by +18,000 to a seasonally adjusted 3.27 million. Continuing claims are reported with a one-week lag. About 6.27 million people received some kind of state or federal benefit in the week ended April 28th, down -149,759 from the prior week.
The economy is "still struggling to gain momentum," though long-term trends remain expansionary even though Leading Economic indicators fell -0.1% in April, the first decline since September. Economists had expected an April gain of -0.1%, following an increase of +0.3% in March. The LEI is a weighted gauge of 10 indicators that are designed to signal business cycle peaks and troughs. Among the 10 indicators that make up the LEI, four made negative contributions in April, led by building permits. In the six months through April, the LEI rose +1.8%, compared with a gain of +0.1% in the prior six months.
Yesterday morning it was reported that Construction on new homes rose +2.6% in April to an annual rate of 717,000 units, while permits fell -7% to 715,000 one month after reaching a nearly four-year high. Economists had expected housing starts in April to rise to total 690,000 on a seasonally adjusted basis. Housing starts in March were revised up sharply to 699,000 from 654,000, while permits were revised up to 769,000, the highest level since September 2008, from an original reading of 747,000. In April, permits for single-family homes, which account for three-quarters of the housing market, edged up +1.9% to an annual rate of 475,000. Permits for new construction are viewed as a gauge of future demand.
Home builder sentiment improved in May to the highest reading since the recession on an upturn in sales and traffic. The National Association of Home Builders/Wells Fargo housing market index rose to 29% from 24% in April. The April index was initially reported to be 25. Economists had expected a reading of 27% for May. The reading, though the best since May 2007, is still well short of the 50% level that indicates that more builders view conditions as good than poor.
Retail spending in the grew a meager +0.1% in April after sharp gains in the first three months of the year. Sales excluding the auto sector also rose +0.1% last month. Economists expected both retail-sales figured to be unchanged. The sales increase in March was revised down to +0.7% from +0.8% and the increase in February was revised down to +1% from +1.1%. Purchases by consumers account for as much as 70% of growth, so the slowdown in spending suggests the economy may be slowing, at least temporarily.
Consumer prices were unchanged in April as a drop in gasoline offset rising food, apparel and car prices. The so-called core prices, which exclude food and energy because they are so unnecessary , rose +0.2%. Both sets of data were in line with forecasts.
Monday, May 14, 2012 4:03 p.m est.
Interesting: " This should come as no surprise to anyone, but somehow it has. The Chinese economy is slowing. And it may be slowing faster than anyone anticipated. That's why China's central bank lowered reserve requirements on Saturday night. According to The Wall Street Journal: "The cut is aimed at kick-starting lending, but banks already appear to have ample credit, with interbank lending rates falling to 3.2% on Friday, down from a high of 5.4% in the second half of February. Song Yu, a Goldman Sachs analyst, said that lowering the reserve-requirement ratio to 20% was simply a "signaling device used by the government to show its willingness to loosen policy," and wouldn't itself have much effect on the economy."
That is to say that according to The Wall Street Journal: "Some immigration lawyers have seen a new increase in the number of Chinese seeking foreign citizenship, a trend they suggest is tied to worries about political turmoil and economic slowdown in China, especially among businesspeople and politicians seeking to protect their families and wealth."
There is a bit of a twist, though. There is a program that basically lets the Chinese buy their way into the U.S. According to The Journal, the program promises "(U.S> citizenship in exchange for investments." More specifically, "applicants and their immediate families receive permanent U.S. residency if an investment of at least $1 million in the U.S. leads to 10 full-time jobs within two years. The requirement is only $500,000 if the U.S. jobs created are in a rural or high-unemployment area."
The market opened sharply lower on news that things in Europe are kicking up once again with interest rates seeing sharp increases as the deal with Greece on their loans from the EU are now basically dead. This means they will have to leave the EU and raise their own money which means interest rates could go even higher, likely into the 20% range!!! This is evident as Spain’s interest rates are already on the rise over 15% now! Could that happen here, well I remember having a second mortgage on my first home of 24% from the bank back in the 1900’s!! If we had those today look out below!! The Dow saw lows first thing in the morning of -140.00 points, S&P 500 -15.00 points and the Nasdaq -40.00 points. It came back a bit midday but sold off at the close as Moody’s released information that they were downgrading most of Italy’s banks!!
At the close the Dow was down by -125.00 points to 12,695.00, S&P 500 -15.00 points to about 1338.00, S&P 100 -7.00 points to 609.00 and the Nasdaq Composite -31.00 points to about 2903.00. Oil continues to move down -$2.00 to the $94.00 level. It looks like the market will continue under pressure tomorrow with this Moody’s news and with worries about China’s slowdown and the rest of the EU it could be warranted. The one problem is that the low volume is holding the market back from getting a decent correction occur and until it does we’ll continue to muddle around here.
Friday, May 11, 2012 4:03 p.m est.
Yeah the world isn’t ending after all!!! There was a new Mayan calendar discovered that goes all the way to 3500 so obviously they just ran out of space on the wall when they were predicting the end for 2012!!!
Interesting: " According to CNBC.com: "T. Boone Pickens says his effort to convert the government trucking fleet to natural gas is his last go-round with Washington politicians, whom he insists don't care about the country's energy independence." CNBC added: ""When this one's over for me, I am through with Washington," Pickens, founder and CEO at BP Capital, said during a discussion at the Skybridge Alternatives SALT hedge fund conference. Pickens has been trying — and failing — to get Congress to pass what is now called the Energy Security Act, aimed particularly at the development of natural gas and breaking the country free of its dependence on Middle East oil. While he said he has no plans on retiring from business, he has given up on working with national politicians."
Basically the market has been closing quietly mixed every day this week but still down about -1% on the week because of worries about Greece leaving the European Union and problems in Spain, Italy and other European countries starting to kick up. This morning it was ugly because JP Morgan reported a -$2 billion loss in their quarterly report. The Dow saw lows of -80.00 points, S&P 500 -10.00 points and the Nasdaq -20.00 points but once again on low volume so it was able to come back at the close to finish the day mixed. At the close the Dow was down by -35.00 points to 12,821.00, S&P 500 -5.00 points to about 1353.00, S&P 100 -3.00 points to 615.00 and the Nasdaq Composite +.20 points to about 29434.00. Oil was once again sharply lower closing down -$1.20 to the $95.90 level.
The market remains in a tough spot right now as the problems in Europe could really become bad quickly so we could still see a very sharp decline come out of the blue. Fitch announced today that if Greece does default and go back to their Drachma from the Euro, they will put all of Europe on negative watch. Outside of this though what needs to be watched are places like China, where their Industrial Production was reported to be at its slowest pace since 2009 and India’s Industrial Production falling -3.5% in March versus a +1.7% gain expected. Retail Sales are also slowing over here and, worst of all revenue grew at just +6.9%, down sharply from +18.7% in March. Experts like the morons at JPM who bet on Global Markets making new highs in May lost because of all of this but the one thing it does reveal is that world economies are slowing down and that may keep .
This morning it was reported that a drop in gas prices dragged Producer Prices down a seasonally adjusted -0.2% in April to mark the biggest decline since October, according to data. The unadjusted 12-month rise of +1.9% was the weakest since October 2009. Excluding food and energy, core producer prices edged up +0.2% as prices for pharmaceuticals and civilian aircraft rose. That marks the second month in a row where core prices exceeded the headline rate. Economists had anticipated a -0.1% drop in producer prices and a +0.2% gain for core wholesale prices.
Yesterday it was reported that The Trade Deficit widened by +14.1% in March to $51.8 billion, the Commerce Department. The trade deficit was above the consensus forecast of economists of a deficit of $50 billion. Economists had expected the deficit to snap back, believing that imports were held down in February due to the timing of the Chinese New Year. In March, imports rose +5.2% while exports increased +2.9%. The trade deficit with China widened to $21.7 billion in March compared with $18.1 billion in the same month last year and $19.4 billion in February. The wider deficit in March was broadly in line with government forecasts in the initial estimate of first quarter GDP.
Import prices fell -0.5% in April after a revised +1.5% spike in March, mainly as the price of oil receded. Economists expected a -0.2% decline. The government's index of imported petroleum prices fell -1.8% and the fuel index dropped a sharper -2.1%. Excluding fuel, import prices rose +0.1% last month. Imported autos posted the biggest increase since June 2011, up +0.4%, while food, feedstuff and beverages edged up +0.1%. Import prices have risen just +0.5% over the past 12 months. Export prices, meanwhile, rose +0.4% in April following a +0.8% increase in March.
Jobless Claims fell by a mere -1,000 last week to 367,000. Claims from two weeks ago were revised up to 368,000 from 365,000. Economists had projected claims would total 365,000 on seasonally adjusted basis. The average of new claims over the past four weeks, meanwhile, dropped by -5,250 to 379,000. Continuing claims decreased by -61,000 to a seasonally adjusted 3.23 million in the week ended. Continuing claims are reported with a one-week lag. About 6.4 million people received some kind of state or federal benefit in the week ended April 21st, down -174,529 from the prior week. Total claims are reported with a two-week lag and are not seasonally adjusted.
Tuesday, May 8, 2012 4:03 p.m est.
Interesting: Baby Boomers leaving the workforce changes the whole dynamic of looking at how the latest employment report was affected by people leaving the workforce. So many aging baby boomers are leaving the workforce that +100,000 new jobs per month could keep the unemployment rate steady. At least that's what two economists are saying. According to USA Today: "some fear the unemployment rate will rise again when better job prospects draw discouraged workers back to the market." But that may not be the case if " A Boomer exodus could more than offset the re-entry of discouraged workers." The report added: "Many more employed than unemployed Americans dropped out of the labor force last month, likely indicating that most were retirees rather than discouraged workers, says Mark Zandi, chief economist of Moody's Analytics. Of the 6.7 million people who dropped out of the labor force last month, about 60% were employed.
Yesterday the market closed mixed very near the unchanged level but today the market opened down as the reality that Europe is headed towards tough times started to sink in. The Dow saw lows of -210.00 points, S&P 500 -22.00 points and the Nasdaq -60.00 points but on low volume it was able to come back a bit. At the close the Dow was down by -76.00 points to 12,932.00, S&P 500 -6.00 points to about 1364.00, S&P 100 -3.00 points to 621.00 and the Nasdaq Composite -12.00 points to about 2946.00. Oil was once again sharply lower closing down -$1.00 to the $97.15 level. The market is in a very tenuous spot right now as the problems in Europe could really become bad quickly so we could see a very sharp decline.
According to The Wall Street Journal: "Political tumult in Greece stoked new worries about the fragility of Europe's monetary union on Monday, as talks to form a new government among the winners of the weekend's elections quickly fell apart in Athens. The collapse revived fears that political turmoil will keep Greece from meeting the stiff terms of its European bailout, ultimately leading to its exit from the euro zone, a move that would threaten the euro's future and reverberate through other troubled economies, such as Spain and Italy."
The one thing this is creating is disorder over in Europe. The big headline isn't that Sarkozy lost in France, it's that the so called "fringe" groups moved closer to power. In Greece Neo-Nazis won parliament seats. In Germany, Angela Merkel's party lost seats. And in France, the conservatives lost everything to socialists. That move away from anything that was in office shows one thing; the people are fed up with what their leaders delivered, nothing, except maybe putting money into their own pockets. So, what we're seeing in Europe is similar to over in Egypt where Arab Spring started. If you've been following the news, the Arab Spring is a bloody mess, literally. Whether Europe's voter revolt will turn into its own war we’ll see but it's not out of the question.
What we're seeing is a classic transition from what Sarqar and Batra describe as an Acquisitor Age to a Laborer Stage in the Social Cycle. An Acquisitor Stage is one where the rulers covet money and nothing else and where wealth is so poorly distributed that society snaps. A Laborer Stage is one where disorder is the rule of the day and where economies struggle to meet the basic needs of the people. What follows a Laborer stage is usually a Warrior stage where the military takes over. Just look at Egypt for guidance on that front right now. France just went from an acquisitor stage to what could be the start of a Laborer stage. Greece has been in a Laborer stage for over a year and finally America seems to be in the death throes of its own Acquisitor stage. The bottom line is that the Social Cycle is playing out and something we need to watch!
Friday, May 4, 2012 4:03 p.m. est.
Interesting: According to Business Insider.com: "The rate of new company creation in America dropped to a record low in 2010, according to a survey by the US Census Bureau's Center for Economic Studies and the Ewing Marion Kauffman Foundation." The report added: "Researchers found the business startup rate fell to 7.87%," which is "the first time it’s dipped below 8%. The startup rate was at its highest in 1987, when it was 13.02%."
The market sold off today as the employment report came in at negative levels not seen in over 30-years! -522,000 dropped out of the work force last month making 88.4 million now out of the workforce!! Although the unemployment came in down to 8.1% because of the drop off of people, the real unemployment or under employed number came in at 14.5%! These numbers were very ugly so its not surprising the market opened strongly lower and it had already discounted this possibility selling off about -1% for the week already. The Dow saw lows of -190.00 points, S&P 500 -24.00 points and the Nasdaq -65.00 points. At the close the Dow was down by -168.00 points to 13,038.00, S&P 500 -23.00 points to about 1369.00, S&P 100 -10.00 points to 623.00 and the Nasdaq Composite -68.00 points to about 2956.00. This was a very negative way to end the week and doesn’t bode well for the market next week as we’re likely to see more selling in anticipation of a further slowing in the economy! Oil sold off big once again off over -$4.00 to close down -$4.00 around the $98.50 level.
With the market selling off this week it's interesting that the defensive move in the actual Dividend Pay-Out Ratio has never being lower, barely holding 27 from a high of 63 in 2008, the last time the dividend-payers were anywhere near this popular. What's going on is the S&P 500 has a lot of cash on their books and, just like the Fed, investors are sitting around waiting for more free money from the Fed! Many stocks pay dividends, in part, to attract investors. What’s interesting is that no amount of bad data or poor earnings will scare investors out of owning stock, well the little guy as the professional money is bailing out in droves. The little guy is right once in a while but, as a general practice the small spec is on the losing side, especially when they are the only people on the long side of a trade.
The economy added +115,000 jobs in April as hiring pulled back for the second straight month. Economists expected a +170,000 increase. The unemployment rate, meanwhile, fell to 8.1% from 8.2%, as -522,000 people dropped out of the labor force. The average work week was unchanged at 34.5 hours, while average hourly earnings rose 1 cent to $23.38. The increase in employment in March was revised up to +154,000 from an initial reading of +120,000 and the gain in February was revised up to +259,000 from +240,000.
Thursday, May 3, 2012 4:03 p.m. est.
Interesting: This is one thing that is going to bite America in the you know what eventually as Standard and Poor’s did say that they would downgrade America once again if they don’t start making some changes to reduce the huge debt problem. The other day Greenspan said that Obama "should have embraced" Simpson-Bowles idea to reduce the deficit. According to The Wall Street Journal: 'Former Federal Reserve Chairman Alan Greenspan said President Barack Obama should have immediately embraced the 2010 Simpson-Bowles deficit-reduction proposal. “The worst mistake the president made was not embracing that vehicle right away,” Greenspan said at the Bloomberg Washington Summit.'
The market continues under pressure and when Apple and especially oil really sold off the market sold off with the Dow seeing lows of -70.00 points, S&P 500 -12.00 points and the Nasdaq -40.00 points in the final hour. At the close the Dow was down by -62.00 points to 13,207.00, S&P 500 -11.00 points to about 1392.00, S&P 100 -4.00 points to 633.00 and the Nasdaq Composite +36.00 points to about 3024.00. Oil closed down -$3.00 around the $103.00 level.
Jobless Claims were down -27,000 to 365,000. Economists had projected claims would drop to a seasonally adjusted 378,000. The average of new claims over the past four weeks, meanwhile, edged up by +750 to 383,500, the highest level since early December. Continuing claims fell by -53,000 to a seasonally adjusted 3.28 million in the week ended April 21st. Continuing claims are reported with a one-week lag. About 6.6 million people received some kind of state or federal benefit in the week ended April 14, down 85,523 from the prior week. Total claims are reported with a two-week lag. Also out this morning was Challenger's layoff count rising to 40,559 in April vs 37,880 in March and vs 36,490 in April last year. Layoff announcements were in the low 50,000 area in February and January. For April, education is the sector hit the heaviest as school districts continue to cut costs.
Productivity fell -0.5% in the first quarter, but none of the decline occurred in manufacturing. Economists expected productivity to fall by -1%. The amount of goods and services produced, known as real output, grew at an annual rate of 2.7%. Hours worked rose +3.2%. Hourly compensation, adjusted for inflation fell -0.9%. Unit-labor costs climbed -2.0%. Productivity jumped +5.9% in the manufacturing sector, however. In the fourth quarter, meanwhile, productivity was revised up to a +1.2% increase from a prior reading of +0.9%.
The Institute for Supply Management said its services sector index in April dropped to 53.5% from 56% in March to mark the worst reading since November. Economists had forecast a 55.4% reading. The production index dropped 4.3 points to 54.6%, the new orders index fell -5.3 points to 53.5% and the employment index dropped -2.5 points to 54.2%. Any reading above 50% indicates expansion.
Wednesday, May 2, 2012 4:03 p.m. est.
The market sold off once again today as preliminary employment data came out this morning much weaker than expected with the Dow seeing lows of -100.00 points, S&P 500 -12.00 points and the Nasdaq -25.00 points. As the day went by the market slowly came back on thin volume though to close mixed with the Dow down by -10.00 points to 13,269.00, S&P 500 -4.00 points to about 1402.00, S&P 100 -2.00 points to 637.00 and the Nasdaq Composite +10.00 points to about 3060.00. Oil closed down -$.80 around the $105.00 level.
Recent hiring has slowed down, according to a private employment in April. Private-sector employment increased only +119,000 on the month, led by the service-providing sector and small and medium businesses, according to payrolls-processor Automatic Data Processing Inc. The April gain is down from monthly employment increases of about +200,000 averaged over the first quarter of 2012, according to ADP. “This deceleration seems consistent with other incoming data,” said Joel Prakken, chairman of Macroeconomic Advisers, which produces the report for ADP. “There is some evidence that unusually warm weather boosted employment during the winter months, with a ‘payback’ now coming due.” Prakken added ADP’s low private-sector growth pace means it’s unlikely that the national unemployment rate declined for the month, unless there was a substantial contraction in the labor force. The ADP level for March was revised to a gain of +201,000 from a prior estimate of +209,000. Markets look to ADP’s report on private-sector payrolls to provide some clue as to what the main employment number will be, which includes information on both private- and public-sector payrolls. Leading up to ADP’s report, some economists had expected that the private-payrolls data would substantially overshoot the official data. Economists expect the Labor Department to report Friday that employment will rise +163,000 in April, compared with +120,000 in March. They also anticipate that the unemployment rate remained at 8.2%
Tuesday, May 1, 2012 4:03 p.m. est.
Yesterday the market was mostly flat and closed down a little. Today it started lower once again but when economic data was a bit better than expected it rallied at one point with the Dow seeing highs of +130.00 points, S&P 500 +18.00 points and the Nasdaq +45.00 points. The final hour saw a bunch of selling occur so at the close the Dow was up by only +66.00 points to 13,279.00, S&P 500 +8.00 points to about 1406.00, S&P 100 +3.00 points to 639.00 and the Nasdaq Composite +4.00 points to about 3050.00. Oil closed up once again a strong $1.50 around the $106.00 level.
The markets continue to struggle with everything going on in Europe, the U.S. election, and the economy. The market seems to be stalling around here and in the short term, Friday's employment report looms large along with the fact that it appears the Fed may be done with its money printing. Europe is in significant trouble. Greece is a shambles and Spain is already in a recession almost depression given their economic contraction and their 24% unemployment. Other countries in Europe may be on the way to the same sort of situation or may already be there also. We still need to have it confirmed however but does mean that there are some big problems looming. It is plausible though that money leaving Europe is making its way to the U.S., at least partially and this, aside from the economic fundamentals, may be why the market is holding fairly well, all things considered.
One thing that could move the market lower however is the employment report on Friday and if shares of Manpower are any indication it has an ominous looking chart suggesting that there is trouble ahead on the employment front. Manpower is a reasonably good bellwether for the jobs market and in Europe where it does a good deal of business. The stock seems to be turning lower ahead of the employment data to be released Friday and that's concerning.
This morning it was reported that the manufacturing sector expanded at a slightly faster pace in April, according to the closely followed ISM index. The index climbed to 54.8% last month from 53.4% in March, the Institute for Supply Management said. Any reading over 50 indicates that more manufacturers are expanding instead of shrinking and that was good news for the market. Economists had forecast the index to dip to 53.3%. The new-orders index rose to 58.2% from 54.5% in March, while the employment index edged up to 57.3% from 56.1%.
Construction spending rose a slight +0.1% in March. While it was the first increase in construction spending in three months, the gain was well below analysts' expectations of a +0.5% rise. Another sign of weakness was that February construction spending was revised down to show a -1.4% decline from the previous estimate of a -1.1% drop. In March, spending on private construction rose +0.7% and residential construction rose +0.7%. Private non-residential construction rose +0.7% in March after two straight declines. However, the strength in private construction was partially offset by weakness in the government sector. Spending on public projects fell -1.1% in March to its lowest level since February 2007. State and local construction fell -1.6% in March to hit its lowest level since November 2006.
Yesterday it was reported that the Chicago PMI dropped in April to 56.2% from 63.3% in March to reach a 29-month low, as gauges for production and new orders slowed dramatically, ISM-Chicago said. Though still well over the 50% it was much worse than expected as economists expected a 60.8% reading.
Friday, April 27, 2012 4:03 p.m. est.
Although Standard & Poor's lowered Spain's long-term sovereign credit rating by two notches to BBB+ from A with a negative outlook and the fact that economic data this morning wasn’t that good with quarterly Gross Domestic Product coming in at a mere +2.2% the market still opened higher. The ratings agency said the downgrade reflects concerns about mounting risks of the country's government debt against the backdrop of a shrinking economy as well as increased likelihood of additional support for the banking sector. S&P also cut its gross domestic product growth forecast for Spain to a contraction of -1.5% this year from a growth of +0.3% previously. The Dow saw highs of +65.00 points, S&P 500 +7.00 points and the Nasdaq +30.00 points.
At the close the Dow was up by +24.00 points to 13,228.00, S&P 500 +3.00 points to about 1403.00, S&P 100 +2.00 points to 638.00 and the Nasdaq Composite +19.00 points to about 3069.00 even with Apple down again for the second day in a row. Oil closed up a strong $1.00 around the $104.00 level.
A major problem right now is the global debt crisis. While it is currently centered in Europe, it is merely the location where the first dominoes are likely to fall as it makes itself around to the United States eventually. The sad fact is that major banks are choking on bad sovereign debt, some of which they hold with leverage of 30:1 or greater. This debt is non-performing and at some point must be written off. Unfortunately, such action will bankrupt these banks, so, in order to keep the everything spinning, all manner of effort is being made to "restructure" this debt, that is to change the terms of the loan so that it can be imagined that the debt will actually be repaid. Now they can pretend that the loan is a performing loan, a healthy asset instead of a rotting hole in their portfolio. Unfortunately, these re-structurings are really a temporary measure that are not going to fix the problem long term as the borrowers will eventually default, but they do briefly allow for a "suspension of disbelief" among investors. The end result is that one day there will be news that encourages people to believe (pretend) that the problems will be fixed but then the next day there is news that reveals just how hopeless the situation really is. This is great for our style of trading because it creates volatility but we need to recognize that everything is not going to be okay, and take it from there. So the news may swing from one extreme to another, but we can stay focused in the reality of knowing that things are eventually going to get worse.
The economy slowed more than expected in the first quarter, as Real gross domestic product rose at a +2.2% annualized rate in the first quarter, down from a +3% increase in the fourth quarter. Economists had expected a stronger +2.7% growth rate. The big story for the first quarter was the slowdown in business spending and inventory investment. The government sector also dampened growth. This weakness was partially offset by stronger consumer spending and exports. At the same time as the economy slowed, inflation accelerated. The personal consumption expenditure index rose +2.4% in the first quarter, the fastest pace since the second quarter of 2011. The core personal consumption index rose +2% after a +1.4% gain in the fourth quarter.
Compensation costs for civilian workers increased a seasonally adjusted +0.4% in the first quarter. Wages and salaries, which make up about 70% of compensation costs, increased +0.5%, and benefits also rose +0.5%. Year-over-year, compensation costs were up +1.9% versus the +2% gain in the year to March 2011, with wages and salaries up +1.7% and benefits up +2.7%.
Thursday, April 26, 2012 4:03 p.m. est.
Interesting: Social Security has 21 years left. According to The Wall Street Journal: "Social Security, which pays retirement and disability benefits to 56 million Americans, will exhaust its reserves by 2033, three years sooner than previously estimated, a new government report said Monday." Think about that. If it comes to pass, there will be no money for millions of people who have contributed to the fund.
Greece's economy will contract a deeper than expected -5% this year, the country's central bank chief said today which will put more pressure on to its citizens, already battered by crippling austerity and record joblessness. Spain's borrowing rate nearly doubled in a short-term debt auction as investors worried over the Euro zone's determination to deal with its debts. As I mentioned yesterday, the Netherlands government collapsed yesterday after failing to reach agreement over austerity measures, placing its AAA credit rating at risk.
Since Monday the market was a little higher on Tuesday but really took off on Wednesday after Apples earnings were way better than expected with the market rallying about +1.5%. The Fed’s decision to leave interest rates alone didn’t seem to have an effect on the market. Today it rallied again at the end of the day for no real reason except that volume is thin and the market may have been anticipating a very good GDP report tomorrow. The Dow saw highs of +140.00 points, S&P 500 +12.00 points and the Nasdaq +30.00 points.
At the close the Dow was up by +114.00 points to 13,205.00, S&P 500 +9.00 points to about 1400.00, S&P 100 +4.00 points to 637.00 and the Nasdaq Composite +21.00 points to about 3051.00. Oil closed flat again up around $.20 around the $103.00 level.
The past couple of days have seen the market make a nice move from an oversold indication but its also apparent that the European markets are continuing to put pressure on the market as things are heating up once again. After the bell today Spain was downgraded by Standard & Poor’s and globex futures are trading lower. The Fed however is a bit more upbeat but they are fairly committed to keeping interest rates low until 2014 just in case things slow down again. We also know that many American companies are making money after having downsized their work forces and that unemployment has improved, but that last month's new jobs number may be an indication that worse things that lie ahead for workers. Then we have an upcoming election to worry about. Both sides are going to play dirty and they are going to fight to the bitter end. The ideological incentives are too great. The incumbent is looking to increase government control rapidly while the challenger wants to slow down that process. In the end, the move toward bigger, more intrusive, and less responsive government is well underway. This is all indicating that at the least the market will remain flat which is good for us but there is a growing problem that the economy over here and in Europe is slowing again so we could see a decent correction as we move into May.
Jobless Claims were virtually unchanged last week at 388,000, keeping claims near their highest level of 2012. Claims from two weeks ago were revised up to 389,000 from 386,000. Economists had projected claims would drop to a seasonally adjusted 375,000. The average of new claims over the past four weeks, meanwhile, climbed by +6,250 to 381,750, matching the highest level of the year. Continuing claims increased by +3,000 to a seasonally adjusted 3.32 million. Continuing claims are reported with a one-week lag. About 6.68 million people received some kind of state or federal benefit in the week ended April 7th, down -87,160 from the prior week.
An index of pending home sales climbed +4.1% in March to reach the highest level since April 2010. The index rose to +101.4 in March from an upwardly revised +97.4 in February, which represents a +12.8% gain from March 2011. February's pending home sales index was initially reported to be 96.5%. A sale is listed as pending when the contract has been signed but the transaction has not closed, though the sale usually is finalized within one or two months of signing. Sales of existing homes during the first quarter were the strongest in five years, and the trade group said the pending home sales data suggests the second quarter will be equally good.
Yesterday it was reported that Home prices dropped sharply in February to hit the worst level in nearly a decade, according to a closely followed index released today. The S&P/Case-Shiller 20-city composite fell -0.8% compared to January levels to take the year-on-year drop to -3.5%. The index is at its lowest level since October 2002, a decade ago! Of the 20 cities measured, 16 had negative readings and only three showed gains. The decline may be due to the typical pattern of diminished interest during the winter and heightened interest in housing during the spring and summer, as prices rose +0.2% on a seasonally adjusted basis.
New homes were sold at an annual rate of 328,000 in March, slightly above market forecasts. Yet sales fell by -7.1% last month because purchases of new homes in February were revised sharply higher. In February, the sales rate was revised up to 353,000 from an original reading of 313,000. Economists expected new home sales in March to total 325,000 on a seasonally adjusted basis. The median sales price, meanwhile, fell -1% last month to $234,500. The supply of new homes on market dipped to 5.3 months from 5.4 months in February.
A gauge of Consumer confidence has declined for a second month, ticking down in April on lower expectations, even as views on the present situation increased, the Conference Board reported Tuesday. The consumer-confidence index fell to 69.2% in April from a revised March reading of 69.5%. A prior estimate had pegged March's confidence level at 70.2%. "As was the case last month, the slight dip was prompted by a moderation in consumers' short-term outlook, while their assessment of current conditions continued to improve," said Lynn Franco, director of the Conference Board's consumer research center. "Overall, consumers are more upbeat about the state of the economy, but they remain cautiously optimistic." Generally when the economy is growing at a good clip, confidence readings are at least 90%. Economists had expected a reading of 70% for April.
Orders for long-lasting goods sank -4.2% in March, largely because of fewer booking for commercial aircraft. Economists had expected orders to fall by -2.9% on a seasonally adjusted basis. Orders for transportation equipment fell -12.5%, the biggest drop since November 2010 as bookings plunged 47.6% for commercial aircraft. Yet orders also fell in most other categories, with the notable exception of autos, appliances and electrical equipment. Orders for autos and parts rose a scant +0.1% after a +2% gain in February. Excluding the volatile transportation sector, orders declined -1.1% in March. And orders for core capital goods, which exclude defense and transportation, fell -0.8% last month. Shipments of core capital goods, a number used to help calculate gross domestic product, rose +2.6% in March to mark the second straight rise. The increase in durable-goods orders for February, meanwhile, was revised down to +1.9% from +2.4%.
Monday, April 23, 2012 4:03 p.m. est.
Interesting: According to The Wall Street Journal: "The Dutch government was close to collapse, with the prime minister widely expected to resign after top-level talks on an austerity package failed."
European debt soars in face of economic crisis. According to Bloomberg: "The debt of the euro region rose last year to the highest since the start of the single currency as governments increased borrowing to plug budget deficits and fund bailouts of fellow nations crippled by the fiscal crisis. The debt of the 17 euro nations climbed to 87.2 percent of gross domestic product in 2011 from 85.3 percent the previous year, official European Union figures showed today. That’s the highest since the euro was introduced in 1999. Greece topped the list with debt at 165.3 percent of GDP, while Estonia had the least at 6 percent of GDP."
Today the market fell out of bed this morning as worries about Europe came to the forefront and the possibility that the economy is slowing once again. At one point the Dow saw lows of -180.00 points, S&P 500 -20.00 points and the Nasdaq -55.00 points. It did bounce back by the close but still remained lower. Tuesday will likely see the market move a bit higher as the market is quite oversold and Apple will be reporting earnings after the bell. Historically, this stock has done its own thing after prior reports, rarely affecting the broad market but it's different this time around as it is having such a heavy weighting in the Nasdaq and S&P 500 now. We also have the Fed starting a two day meeting to decide about a change in interest rates which is isn’t going to happen and we’ll see some new housing numbers which have been weak of late.
At the close the Dow was down by -100.00 points to 12,927.00, S&P 500 -12.00 points to about 1367.00, S&P 100 -5.00 points to 621.00 and the Nasdaq Composite -30.00 points to about 2970.00. Oil closed down about -$1.00 around the $103.00 level.
Friday, April 20, 2012 4:03 p.m. est.
Interesting: Banks in Europe are running out of newly printed money already. According to The Wall Street Journal: "Europe's bold program to defuse its financial crisis by injecting cash into the banking system is running out of steam. The European Central Bank's roughly €1 trillion ($1.31 trillion) of emergency loans caused interest rates of troubled euro-zone countries to plummet earlier this year, easing fears about Europe's debt crisis. But lately rates have again been marching higher. One big reason: After months of using that cash to buy their government's debt, banks in Spain and Italy have little left, say analysts and other experts." It also said that "German and French banks, meanwhile, have cut holdings of those countries’ bonds, as well as Irish and Greek debt, by as much as 50 percent since 2010 in some cases. That leaves domestic firms on the hook for a restructuring such as Greece’s last month and their main financier, the European Central Bank, facing losses. Like Greece, governments would have to rescue their lenders with funds borrowed from the European Union."
The Netherlands could also be among the next European nations with bad credit ratings. According to The Wall Street Journal: "The housing market slump in the Netherlands is causing headaches for the country's banks, which were just on their way to recovering from the financial crisis in 2008 and could now face rising losses and tighter funding conditions." Volatility has finally seemed to have started in the market as it rallied strongly on Tuesday but Wednesday and Thursday saw it down pretty good! Today being expiration it was up pretty strong early on but pulled back by the close once again. Today the Dow saw highs of +130.00 points, S&P 500 +12.00 points and the Nasdaq +45.00 points but the final hour saw some heavy selling so it became mixed with the Nasdaq down -10.00 points because Apple was once again being sold, hitting the -10% level from its highs.
At the close the Dow was up by +65.00 points to 13,029.00, S&P 500 +1.60 points to about 1379.00, S&P 100 +1.40 points to 627.00 and the Nasdaq Composite -7.00 points to about 3000.00. Oil has been rallying a bit on war threats over in the middle east but it has only moved a little closing up again today about +$1.30 around the $104.00 level.
So far this current rally from the bottom is 789 days old and up over +100%. There aren't many rallies that this has happened to and looking at the rallies from 1982 and 1995, the results were interesting, to say the least. First, we are roughly in line with both of those rallies and if we keep following the returns from each of those previous rallies, the market will be up near new all-time highs by the end of this year. Of course there are some headwinds and they are starting to come about now, but it does make the point that we've seen rallies this strong before, and stocks very well could continue to move higher. The things that could effect the market this summer besides the upcoming election this fall is that a slowdown in China is starting to happen and issues in Europe are heating up once again. Besides all that volume has disappeared so at the least I would think that volatility is going to kick up which is going to be great for us!
Monday, April 16, 2012 4:03 p.m. est.
The market started the day on the upside as traders decided that some poor earnings from Citibank were good after all. The Dow saw highs of +125.00 points, S&P 500 +10.00 points and the Nasdaq +15.00 points but when sell programs hit Apple it tanked the Nasdaq as the company now has a 20% weighting in the index. The Dow saw lows of +40.00 points, S&P 500 -4.00 points and the Nasdaq -45.00 points. At the close the Dow was up by +72.00 points to 12,921.00, S&P 500 -.70 points to about 1370.00, S&P 100 +.15 points to 623.00 and the Nasdaq Composite -23.00 points to about 2988.00. Oil was mostly flat closing down about -$.20 around the $103.00 level.
Home-builder sentiment dropped in April for the first time in seven months, as growing traffic at new-build sites hasn't yet led to sales. The National Association of Home Builders/Wells Fargo housing market index dropped -3 points to a seasonally adjusted 25 in April, on a scale of 0 to 100. Economists had anticipated a steady reading of 28. The index hasn't been in decent territory, or at 50, since April 2006. Each of the components fell in April. The components measuring current sales conditions and sales expectations in the next six months dropped -3 points, while the traffic measuring prospective buyer traffic fell -4 points.
Consumers bought a wide range of goods and services for the third straight month, suggesting the economy is growing somewhat faster than expected except houses as the above report noted! Consumers increased spending in virtually every category, whether at online stores or traditional bricks-and-mortar retailers. Automobiles, electronics and appliances, building materials, and clothing stores saw the biggest gains. Retail sales climbed +0.8% in March, following revised increases of +1% in February and +0.7% in January. February’s gain was revised down slightly and January was revised up a tick. Consumer spending accounts for as much as 70% of economic growth, so the recent upsurge in spending likely means the nation’s growth in the first quarter will be faster than expected. While sales at resurgent automobile companies jumped during the first quarter, other retailers also benefited. Sales excluding the auto sector were still up a sharp +0.8% last month. Economists expected retail sales to rise by +0.4% overall, or by +0.6% excluding the automobile sector. Spending has been fueled by an acceleration in hiring since last fall. With more people working, there’s more money to spend. Retailers have also been helped by one of the warmest winters in decades. Whether consumers can continue to spend at their current pace, however, remains to be seen. Inflation-adjusted wages have fallen over the past year, and people are saving somewhat less. In March, sales of building materials and garden equipment jumped +3% to mark the biggest increase in almost a year and a half. Sales also rose +0.9% for auto and parts dealers, +1.1% for sellers of home furnishings, +1% for electronic and appliance stores and +0.9% for apparel retailers. Although consumers did have to spend more money to fuel their cars, sales leaped +1.1% at gas stations, it did little to deter them from spending on other things. The only retail segment to post a drop in sales was health and personal-care stores. Sales dipped -0.2% last month. Overall retail sales are +6.5% higher compared with a year ago.
Business inventories rose a seasonally adjusted +0.6% in February to $1.58 trillion. Economists had forecast a +0.5% gain. The increase was led once again by the auto sector, whose inventories jumped +1.8%. Inventories also rose sharply, up +1.1% for, building-materials suppliers. Inventories, which aren't adjusted for price, were +7.6% higher than the same period in February 2011. The ratio of inventories to sales, meanwhile, rose to 1.28 from 1.27 in January.
A reading of New York–area manufacturing conditions pointed to a significant slowdown in April, as purchasing managers reported slowing shipment growth and falling unfilled orders. The New York’s Empire State index dropped to 6.56% in April from 20.21% in March, a reading that also was much slower than the 18% projected by economists. A big 12-point drop in shipments and a negative reading for unfilled orders dragged the headline index down. The important new-orders component was essentially unchanged at 6.48%, while the index for number of employees rose to its highest level in nearly a year. Though lower on the month, the prices-paid index was still a very high 45.78%. The New York Fed gauge, like the Philadelphia Fed index due out later this week, is a diffusion index, which subtracts the percentage of respondents who say activity fell during the month from those who say it increased. Any reading above zero is considered positive.
Friday, April 13, 2012 4:03 p.m. est.
Interesting: California kelp had radioactive particles from Japan. According to The L.A. Times.com: "Radioactive particles released in the nuclear reactor meltdown in Fukushima, Japan, following the March 2011 earthquake and tsunami were detected in giant kelp along the California coast, according to a recently published study. Radioactive iodine was found in samples collected from beds of kelp in locations along the coast from Laguna Beach, “a place I love to vacation at”, to as far north as Santa Cruz about a month after the explosion, according to the study by two marine biologists at Cal State Long Beach." The levels were deemed to be "most likely not harmful to humans," yet "were significantly higher than measurements prior to the explosion and comparable to those found in British Columbia, Canada, and northern Washington state following the Chernobyl disaster in 1986, according to the study published in March in the journal Environmental Science & Technology."
The market bounced back the past couple of days with strong gains of about +2% but it wasn’t that surprising as it was strongly oversold technically. Today however saw more downside as worries about the EU banking situation crept back in and overnight China reported much slower growth than expected, if you can say an +8.1% reading in one quarter is slow, haha! We could only dream of that type of growth over here and yes I know that their data is skewed anyhow.... Sentiment was also reported a bit lower after the open so the market fell with the Dow seeing lows of -110.00 points, S&P 500 -15.00 points and the Nasdaq -45.00 points mid day but it then bounced back a bit to really sell off again in the final hour, basically finishing the day at new lows on the Dow of -140.00 points, S&P 500 -17.00 points and the Nasdaq -45.00 points.
At the close the Dow was down by -137.00 points to 12,850.00, S&P 500 -17.00 points to about 1370.00, S&P 100 -8.00 points to 624.00 and the Nasdaq Composite -44.00 points to about 3011.00. Oil has been mostly flat closing down about -$.80 around the $103.00 level.
Although we saw a mid week correction the bounce back indicates that it will be hard for the market to really go anywhere for the next little while I suspect. Volume is so thin its easy to push the market around. I’m declaring that were already in the summer trading doldrums and spring is barely in the air. Although this will be incredibly boring for us profits will be very nice!!!
The cost of living rose again in March even as the price of gas leveled off! The consumer price index climbed +0.3% last month as the cost of most goods and services rose. The increase outstripped the rise in wages, so inflation-adjusted earnings for the average worker fell -0.1% last month. Economists expected a +0.2% increase in the cost of living. Energy costs, for example, climbed +0.9% last month, though that was far smaller than February’s +3.2% increase as gas prices pulled back. A retreat in the price of oil from recent highs should offer a bit of additional relief to consumers, at least temporarily. Over the past year, consumer prices have risen an unadjusted +2.7%, but that’s down from -2.9% in February. Excluding food and energy which the government thinks isn’t very important because so few people eat or drive, came in with the core index climbing +0.2% in March and matched expectations.
Yesterday it was reported Jobless Claims jumped by +13,000 last week to 380,000, the highest level since late January. Claims from two weeks ago were revised up to 367,000 from 357,000, an unusually sharp adjustment. Economists had projected claims would total a seasonally adjusted 359,000. The average of new claims over the past four weeks, meanwhile, rose by a smaller +4,250 to 368,500, the highest level in a month. The monthly average is seen as a more accurate gauge of labor-market trends because it reduces seasonal volatility in the weekly data. Continuing claims fell by -98,000 to a seasonally adjusted 3.25 million in the week ended March 24th. About 6.95 million people received some kind of state or federal benefit in the week ended March 17th, down -97,833 from the prior week. Total claims are reported with a two-week lag.
Wholesale prices were unchanged in March as a recent surge in energy prices was mostly reversed. Excluding the volatile but unimportant categories of food and energy, core wholesale prices rose a seasonally adjusted +0.3%. Economists had predicted a -0.1% decrease in the overall producer price index and a +0.2% rise in core PPI. Energy prices fell -1% last month, led by a sharp reduction in gas. The wholesale cost of food, however, rose +0.2% to mark the first increase in five months. Over the past year wholesale prices have risen an unadjusted +2.8%, the smallest year-over-year increase since June 2010.
The trade deficit narrowed to $46 billion in February from $52.5 billion in January for a -12.4% drop, the largest percent decline since May 2009. Economists had expected the trade gap to narrow following a holiday-related increase in imports from China earlier this year. The trade deficit with China narrowed -26% in February, hitting $19.4 billion, compared with $26 billion in January. Overall exports rose +0.1% in February to $181.2 billion, while imports fell -2.7% to $227.2 billion. Exports and imports are an important component of gross domestic product. Deficits subtract from economic growth.
Tuesday, April 10, 2012 4:03 p.m. est.
The market continued correcting today as everyone started to look towards the start of earnings season with Alcoa after the bell!! The sell off wasn’t to bad but as bonds over in Europe started to sell off as Spain is looking like the next disaster, stocks sold off even more with the Dow seeing lows of -220.00 points, S&P 500 -25.00 points and the Nasdaq -60.00 points and barely bounced in the final hour.
At the close the Dow was down by -214.00 points to 12,716.00, S&P 500 -24.00 points to about 1359.00, S&P 100 -10.00 points to 619.00 and the Nasdaq Composite -56.00 points to about 2991.00. Oil fell once again as it is starting to approach the $100 level once again closing down about -$1.60 around the $100.80 level. Its nice to see the market finally starting to correct a bit here. Even though its only off a couple of percent its amazing how oversold it is already which kind of indicates at the most this will be mostly a sideways consolidation!
Wholesale inventories climbed a more-than-expected +0.9% in February, while wholesale sales rose +1.2%. At February's sales pace, the inventory-to-sales ratio was unchanged at 1.17 months. Inventories grew +0.6% in January while sales were flat in that month. The increase in inventories over the past two months suggest that companies are experiencing higher demand for their goods. Inventories of durable goods rose +0.5%, while inventories of nondurables increased +1.4%.
Monday, April 9, 2012 4:03 p.m. est.
The market tanked this morning after it was reported that employment came in way worse than expected on Friday while the market was closed. The Dow saw lows of -160.00 points, S&P 500 -20.00 points and the Nasdaq -50.00 points but because volume was so low it did bounce back but the final hour saw it sell off again.
At the close the Dow was down by -131.00 points to 12,929, S&P 500 -16.00 points to about 1382.00, S&P 100 -6.00 points to 630.00 and the Nasdaq Composite -33.00 points to about 3047.00. Oil fell pretty hard at one point over -$2 but rallied a bit closing down about -$.90 around the $102.00 level.
The employment report on Friday saw +120,000 jobs added, well below expectations. Economists expected an increase of +210,000, seasonally adjusted. This was far less than expected and an indication that momentum could be slowing. The March report also contained other signs of weakness. While the unemployment rate fell to 8.2%, the lowest level since January 2009, the decline was entirely from people dropping out of the labor force. That’s usually a negative sign because it suggests jobs have become somewhat harder to find. Yet a raft of other economic data indicate that more companies plan to hire, so a decline in the labor force in March could be temporary. The labor force had risen by almost 1 million in the first two months of 2012.
The weakness in hiring last month was concentrated in the vast private services sector, which added only +90,000 after increasing employment by +204,000 in February. Retail employment dropped -33,800 after falling -28,600 the prior month. Construction hiring fell -7,000, the second straight monthly decline. Temporary help fell -7,500 after rising +54,900 in February. However, manufacturing enjoyed another month of strong job gains, with factories adding +37,000 new positions, helped by carmakers trying to meet pent-up demand for motor vehicles. Factory jobs increased by +31,000 in February. The workweek dipped to 34.5 hours from 34.6 hours in February.
Thursday, April 5, 2012 4:03 p.m. est.
The market continued lower this morning with the Dow seeing lows of -70.00 points, S&P 500 -7.00 points and the Nasdaq -10.00 points but as volume dwindled because everyone was leaving early for the long weekend it came back with the Dow seeing highs of +15.00 points, S&P 500 +3.00 points and the Nasdaq +15.00 points. It couldn’t hold up under the pressure though as it fell back again midday. The final hour saw it become mixed however as Apple was higher helping to lift the Nasdaq.
At the close the Dow was down by -15.00 points to 13,060, S&P 500 -1.00 points to about 1398.00, S&P 100 -.25 points to 636.00 and the Nasdaq Composite +12.00 points to about 3081.00. Oil rallied a bit closing up about +$1.80 around the $103.00 level.
Jobless Claims fell slightly last week and remained at a four-year low, down -6000 to 357,000 from an upwardly revised 363,000 in the prior week. Claims from two weeks ago were initially reported at 359,000. The four week average dropped by -4,250 to 361,750, the lowest level since April 2008. The monthly average gives a clearer look at labor-market trends by reducing the effects of seasonal quirks. Claims usually range from 300,000 to 400,000 when the economy is expanding at a moderate or fast pace. New applications for benefits have remained below the 400,000 threshold since mid-October. Continuing claims fell by -16,000 to a seasonally adjusted 3.34 million in the week ended March 24th. For tomorrows employment report the estimate is for +205,000 jobs last month, keeping with recent trends. The strange thing is that the stock market and bonds will be closed but Globex futures will be open until 9:15 a.m. so it will be interesting to see how the market could open on Monday. The economy generated an average of +245,000 jobs from December to February, the biggest move of hiring since the recession ended in 2009. Even at that rate, however, it will take several years or longer for the unemployment rate to return to precession levels of around 6% or less. The jobless rate stood at 8.3% in February, a number that economists forecast to be unchanged in March.
Wednesday, April 4, 2012 4:03 p.m. est.
The market really sold off today as news about the Feds disclosure that there may not be any more stimulus worked through the system with the Dow seeing lows of -170.00 points, S&P 500 -17.00 points and the Nasdaq -50.00 points. It came back a bit at the close but still saw a pretty good loss.
At the close the Dow was down by -125.00 points to 13,075, S&P 500 -14.00 points to about 1399.00, S&P 100 -6.50 points to 636.00 and the Nasdaq Composite -45.00 points to about 3068.00. Oil was down closing about -$2.00 around the $102.00 level.
Private-sector payrolls increased +209,000 in March, led by the service-providing sector and small businesses, according to the ADP employment report. The February level was revised to a gain of +230,000 from a prior estimate of +216,000. Markets look to ADP's report on private-sector payrolls to provide some guidance on the employment report which will be released Friday and includes information on both private- and public-sector payrolls. Economists expect the report to show employment rose +200,000 in March, compared with +227,000 in February. They also expect that the unemployment rate declined to 8.2% from 8.3%. The interesting thing is the report is out on Friday which is a holiday for the market!!
The Institute for Supply Management's services-sector index for March fell to 56% from 57.3% in February. The gauges for new orders and production fell, accounting for most of the decline. Economists expected the ISM services index to pull back to 56.8% last month. Still, any reading over 50% indicates that more firms are expanding than contracting. The ISM index has now been above the 50% mark for 27 months. The service sector includes fields such as health care, retail, finance and entertainment and accounts for three-fourths of all economic activity. These sectors also employ about 80% of the nation's workers.
Tuesday, April 3, 2012 4:03 p.m. est.
Interesting: It’s pretty obvious that the Chinese government does fix numbers!! According to Reuters/CNBC.com: "China's official PMI (Purchasing Managers' Index) jumped to an 11-month high of 53.1 in March, up from February's 51 and comfortably ahead of forecasts of 50.5." According to CNN.com: "At the same time, banking company HSBC issued a report that showed factory output fell in March for the fourth time in five months."
According to Bloomberg.com: "The fastest expansion in oil cargoes since 2004 is exceeding demand and filling up storage tanks from Egypt to Japan, creating a glut that threatens to reverse the biggest gain in shipping rates in five years. Tankers will be carrying 488.8 million barrels by April 14th, +3.9% more than the week earlier, estimates Oil Movements, which has tracked cargoes for 25 years. Rates for very large crude carriers, each holding 2 million barrels, will fall -58% to average $19,750 a day.
Yesterday the market was higher by about +3/4% on even more abysmal volume because there was a lot of talk about the Fed doing more stimulus in the economy. Interestingly it was also the day that America was declared to have the highest corporate taxes in the world and the trade deficit continues to grow at an outstanding pace. Today the market turned down as there was some question as to the Fed’s next move and after their minutes were released midday indicating more and more members thinking of a rate increase instead of stimulus, the market sold off with the Dow seeing lows of -120.00 points, S&P 500 -14.00 points and the Nasdaq -25.00 points. Of course it came back a bit at the close because it couldn’t really be true that the economy was on its own so losses were cut significantly by the close.
At the close the Dow was down by -65.00 points to 13,200, S&P 500 -6.00 points to about 1413.00, S&P 100 -3.00 points to 643.00 and the Nasdaq Composite -6.00 points to about 3114.00. Oil was down closing about -$1.20 around the $104.00 level.
Last week ended the first quarter, and what a quarter it was. The +12% return gained by the S&P 500 is the best first three months of the year since 1998, when the market saw a first quarter gain of +13.5%. March's return of +3.1% means that every month this year has seen at least a +3% return with January and February both over +4%. That has never happened before, going back to 1950! The best first quarter ever was in 1987 and this one is looking similar but that’s just something to keep in the back of your mind as we likely won’t have to worry about it until fall. Usually April has seen some volatility anyhow and looking back at previous strong quarters it has come true with a correction usually ensuing somewhere and generally turns higher again. The corrections have also been mostly flat to only slightly down so the doomsayers may have to wait till fall.
Yesterday it was reported that growth in the manufacturing sector expanded at a somewhat faster pace in March, according to the Institute for Supply Management's manufacturing gauge rising to 53.4% last month from 52.4% in February. Economists had expected the index to rise to 53.5%. Reading over 50% indicate that more manufacturers are expanding instead of shrinking. Fifteen of the 18 industries tracked, reported growth last month, up from 11 in the prior month. The ISM's production index increased to 58.3% last month from 55.3%, but the new-orders index slipped to 54.5% from 54.9%. Also, the employment index climbed to 56.1% from 53.2%.
Friday, March 30, 2012 4:03 p.m. est.
Interesting: Spain: Barcelona protests turn violent. The situation in Spain is in danger of deteriorating. According to AP, protests in the city turned violent as "hooded protesters smashed bank and storefront windows with hammers and rocks and set fire to streetside trash containers." Spain may become the next bailout candidate in the EU.
Yesterday the market was mostly flat closing mixed but today it started the day higher because it was the last day of the quarter with the Dow seeing highs of +60.00 points, S&P 500 +7.00 points and the Nasdaq +20.00 points. When Apple was lower while the Nasdaq was up it didn’t look good and worries about Spain came more into the forefront, the market started to sell off and the Dow saw lows of -10.00 points, S&P 500 -2.00 points and the Nasdaq -20.00 points. Of course month and quarter end along with low volume helped the market to come back once again and the Dow made new highs of +75.00 points and the S&P 500 +8.00 points midday, but as Apple remained flat the Nasdaq was also unable to make new highs. The final hour saw selling come back in with the market becoming mixed as the Nasdaq turned negative but the Dow and S&PP remained higher.
At the close the Dow was up by +66.00 points to 13,212, S&P 500 +5.00 points to about 1408.00, S&P 100 +1.00 points to 640.00 and the Nasdaq Composite -4.00 point to about 3092.00. Oil was pretty flat closing up about +$.40 around the $103.00 level.
So the market had an incredible first quarter with the S&P 500 up over +11% and the Nasdaq +18%. That is a great start to the year for sure and since 1950 whenever this has happened the entire year has been higher. Does this guarantee that the coming quarter will be higher, no it doesn’t and in the past volatility kicked up because the first quarter was so strong!! The good thing though is that the downside has been limited so trading for us will be great!
Consumer spending in the jumped +0.8% in February but it was mostly because of higher energy costs. Income rose a much smaller +0.2% and as a result, the personal savings rate fell to 3.7% from 4.3%, the lowest level since August 2009. Economists had forecast income to rise by +0.4% and spending by +0.7%. Yet adjusted for inflation, disposable income (money leftover after taxes) fell -0.1% last month. That's because the price index for personal consumption, a key inflation gauge tracked by the Fed, rose +0.3%. The core PCE index, which excludes food and energy, edged up a smaller +0.1%, matching expectations because food and gas mean so little to everyone. I mean really if your needing food or a new Iphone what are you gonna buy!!!
The Chicago PMI, or Chicago business barometer by its formal name, fell in March but marked its fifth straight month above 60%. The PMI fell to 62.2% in March from 64% in February, compared to forecasts of 63.5%. While the production and new orders components rose, the new orders component slowed to 63.3% in March from 69.2% in February, and employment fell to 56.3% from 64.2%. The prices paid component rose to the highest level since August 2011. Readings over 50% indicate expansion.
The final reading for consumer sentiment in March rose to 76.2%, the highest in more than a year, from 75.3% in February, according to the University of Michigan/Thomson Reuters. A preliminary March reading pegged the level at 74.3%. Economists had expected a final March reading of 75%. The sentiment gauge, which covers how consumers view their personal finances as well as business and buying conditions, averaged about 87% in the year before the start of the most recent recession. Economists watch sentiment data to get a feel for the direction of consumer spending.
Yesterday it was reported that Jobless Claims fell by -5,000 last week to a seasonally adjusted 359,000. The latest data includes the government's annual seasonal-adjustment revisions extending back five years, which have resulted in a small increase in weekly claims. The number of new applications for benefits last week, for example, was originally reported at 348,000. The revisions now put last week's level of claims at 364,000, a +4.6% increase. Economists thought claims would fall to 345,000. The four week average dropped by -3,500 to 365,000, a four-year low. Continuing claims fell by -41,000 to a seasonally adjusted 3.34 million. About 7.15 million people received some kind of state or federal benefits in the week ended March 10th, down -131,488 from the prior week.
Gross domestic product for the fourth quarter rose at a +3% annualized rate, unrevised from the earlier estimate. Economists expected second-quarter growth to be revised up to a +3.2% rate. A downward revision to exports was offset by stronger business investment in software. Consumer spending rose +2.1% in the fourth quarter, unrevised from prior estimates. A key measure of inflation, the core personal consumption index, which excludes food and energy prices, increased +1.3%, also unrevised from prior estimates. Corporate profits before-tax fell 0.4% quarter-to-quarter, down from a +1.2 % rise in the third quarter and is the first quarterly decline in profits since the fourth quarter of 2010.
Wednesday, March 28, 2012 4:03 p.m. est.
The market started the day slightly higher but once again it turned lower but selling really took hold with some sell programs taking the Dow to lows of -130.00 points, S&P 500 -16.00 points and the Nasdaq -35.00 points. At the close the Dow was down by -72.00 points to 13,126, S&P 500 -7.00 points to about 1406.00, S&P 100 -3.00 points to 640.00 and the Nasdaq Composite -15.00 point to about 3105.00. Oil sold off as there was more talk about Britain and the U.S using oil reserves to help lower the cost of gas closing down about -$2.00 around the $105.00 level.
Durable Goods Orders rose +2.2% reflecting broad strength in demand across most industries. Economists had expected durable-goods orders to increase a seasonally adjusted +2.9% on the month, snapping back from a sharp drop in January. It was the fourth increase in five months. Durable goods are typically products designed to last at three years, such as trains, computers or furniture. The rise in demand last month was lead by transportation and defense, but almost every sector reported an increase. Bookings rose by +12.4% for large military items such as jets, by +6% for commercial aircraft, by +5.7% for heavy machinery, by +2.7% for computers, by +1.6% for autos and by +1.3% for primary metals. The only category to report a decline was electrical equipment and appliances. Excluding the volatile transportation sector, orders rose +1.6% and minus defense increased +1.7%. Orders for durable goods often fall in the first month of a quarter and rise in the second and third months, based on recent patterns.
Tuesday, March 27, 2012 4:03 p.m. est.
The market rallied pretty strongly yesterday closing up about +1.3% on increasingly lower and lower volume, today barely getting over 500 million shares. This was even though the kettle is starting to boil in Europe with it being quietly reported that Portugal is showing signs of growing problems and Spain’s Finance Minister Luis de Guindos said that his government would need to implement an additional $46.20 billion of fiscal tightening this year and next to achieve its budget deficit goal according to the WSJ. Ireland is also reportedly back in recession with growth falling for the second consecutive quarter. In fact, the Eurozone's purchasing manager's index showed increasing weakness is starting to appear in the whole region. According to The Wall Street Journal: "The euro-zone PMI slid -0.6 points to a three-month low of 48.7% in March. Economists had expected a slight rise. Index readings below 50% signal contraction in activity." Another thing that had helped the market stay up was that Ben Bernanke gave a hint of the possibility of another stimulus plan in the spring.
Today the market started the day slightly higher with the Dow seeing highs of +25.00 points, S&P 500 +3.00 points and the Nasdaq +10.00 points but as the day wore on and some other Fed members said there was no reason for more stimulus the market pulled back closing near lows. At the close the Dow was down by -44.00 points to 13,198, S&P 500 -4.00 points to about 1413.00, S&P 100 -2.00 points to 642.00 and the Nasdaq Composite -2.00 point to about 3120.00. Oil was flat yesterday and today closing up about +$.20 around the $107.00 level.
The market was flat last week and there is still lots of headwinds for the market such as the economy, the election, and Europe still weighing heavily on the markets. Now though a new worry is starting to come around, the potential decline of the BRIC block, as Brazil, China, India and Russia are showing signs of slowing growth. Russia says they need $120 oil to meet their budget requirements next year!! This could be good for the U.S as we are seeing expansion and growing a bit. Questions of growth, especially in China and Brazil are starting to work their way into the markets, creating some volatility. The problem is that over 70% of our economy is based on spending and it was reported last night people don’t have it. Income growth may prove to be the problem for this economy really getting better. According to Investors.com: "Year-over-year growth in real disposable income, the earnings Americans have left after taxes and inflation is still below -1%, a level typically associated with recessions and was just +0.6% in January." IBD notes that the reason for the lack of growth in disposable income is that there is an "unwinding of extraordinary government supports" under way as "some of the income props set up a few years ago are going away." For example the Bush tax cut extensions will expire in 2013 along with the spending cuts scheduled to hit the economy. According to IBD: "Total real private-sector wages rose +3.6% in Q4 vs. a year earlier, Commerce Department data show but disposable income was far behind. In fact, the gap between real private wages and disposable income growth has spiked to a near-record 3 percentage points, unheard of this early in a cyclical expansion." Other factors are that "government social spending has flatlined for more than a year, shrinking in real terms, Commerce data show. That social spending includes the big entitlement programs as well as safety net spending on food stamps and jobless benefits." The report also notes: "other sources of personal income have seen little or no growth. Public employee wages have been flat in nominal terms for about two years, leaving the private sector to carry the full load. Finally, interest income has fallen with rates. That has roughly canceled out dividend gains. Basically there is less money in the hands of more people so that's not a recipe for robust growth.
Speaking of disposable income there isn’t any from housing as home prices fell for the fifth month in a row in January to the lowest level since early 2003, according to a closely followed index. The S&P/Case-Shiller 20-city composite index dropped -0.8% in the first month of 2012. The three-month rolling index includes transactions that took place from November to January. Over the past 12 months, prices have fallen -3.8%. Sixteen of the 20 metropolitan areas posted declines, while only Miami, Phoenix and Washington, D.C, saw increases so it looks like things are starting to equalize. The large number of foreclosed homes, combined with a high unemployment rate, has depressed the home market since a real-estate bubble burst in 2007. Many people especially younger people, lack the financial means to buy a home. Economists say the economy will have to grow a lot faster and add jobs at a more rapid clip to nurse the housing market back to good health. That process could take several years or longer, they say.
Consumer confidence declined in March due to lower employment expectations, while views on the present situation rose to the highest level since 2008, the Conference Board reported. The consumer-confidence gauge fell to 70.2% in March from a February reading of 71.6%. A prior estimate had pegged February's confidence level at 70.8%. Generally when the economy is growing at a good clip, confidence readings are at least 90%. Economists had expected a reading of 71.5% for March.
Yesterday it was reported that Pending home sales dipped slightly in February, according to an industry trade group. The National Association of Realtors said its pending sales index fell to 96.5% last month from a revised 97.0% in January, although it's still 9.2 percentage points above its year-ago level. "The spring home buying season looks bright because of an elevated level of contract offers so far this year. If activity is sustained near present levels, existing-home sales will see their best performance in five years," said Lawrence Yun, NAR's chief economist. By region, pending home sales rose 6.5%% in the Midwest, but dropped 3.0% in the South, 2.6% in the West and 0.6% in the Northeast. An index reading of 100 is equal to the average level of contract activity during 2001. A sale is listed as pending when the contract has been signed but the transaction has not closed. Not all contracts lead to closings.
Friday, March 23, 2012 4:03 p.m. est
The market started the day lower with the Dow seeing lows of -50.00 points, S&P 500 -6.00 points and the Nasdaq -20.00 points. It did rally back though with the Dow seeing +60.00 points, S&P 500 +7.00 points and the Nasdaq Composite +10.00 points. At the close the Dow was up by +35.00 points to 13,081, S&P 500 +4.00 points to about 1397.00, S&P 100 +2.00 points to 636.00 and the Nasdaq Composite +5.00 point to about 3068.00. Oil rallied all day closing higher by about +$1.50 around the $107.00 level. This week saw the market make little progress in either direction and as volume continues to fall it looks more like a correction will ensue or a few weeks of sideways consolidation are at hand.
Thursday, March 22, 2012 4:03 p.m. est.
The market started the day lower as news out of China wasn’t very favorable with the Dow seeing lows of -110.00 points, S&P 500 -13.00 points and the Nasdaq -25.00 points. It did rally back midday but the final hour saw the market retest old lows again before bouncing a little to finish the day. At the close the Dow was down by -78.00 points to 13,046, S&P 500 -10.00 points to about 1393.00, S&P 100 -4.00 points to 634.00 and the Nasdaq Composite -12.00 point to about 3063.00. Oil sold off on worries that China may be slowing closing lower by about -$2.00 around the $105.00 level.
It was released last night that Chinese manufacturing activity has slowed sharply this month with falling employment amid a deepening slowdown in global demand and aggravated by a stall in domestic consumption. China manufacturing activity fell sharply in March at 48.1% on a 100-point scale, down from a final reading of 49.6% in February.
The flash PMI is based on 85% to 90% of the total responses during a given month and is an early indicator of business conditions facing Chinese manufacturers. This indicates actual contraction in the economy. The rate of booking new orders also fell to a four-month low at factories. The deterioration in orders matched a surprise slump in industrial-production growth, adding to the darkening outlook, which will play a role in factory managers decisions.
Jobless Claims fell by -5,000 last week to 348,000, the lowest level since February 2008. Claims from two weeks ago were revised up to 353,000 from 351,000. Economists had projected claims would rise to a seasonally adjusted 353,000. The average of new claims over the past four weeks, meanwhile, declined by -1,250 to 355,000. Continuing claims fell by -9,000 to a seasonally adjusted 3.35 million. Continuing claims are reported with a one-week lag. About 7.28 million people have been receiving some type benefit last week.
Wednesday, March 21, 2012 4:03 p.m. est.
Yesterday the market looked like it was going to start a correction as it sold off in the morning but by the close it came back to only close slightly lower. Today it started higher but selling took hold with the Dow seeing lows of -60.00 points, S&P 500 -5.00 points and the Nasdaq -10.00 points. As the day wore on and volume dwindled it came back with the Dow remaining lower but the S&P 500 saw +2.00 points and the Nasdaq Composite +20.00 points as Apple was rallying. The final hour saw a sell program go through so the S&P and Nasdaq lost all their gains. This was the first sell program I’ve seen in a while and with this low of volume this may be a clue of change in trend. At the close the Dow was down by -46.00 points to 13,125, S&P 500 -3.00 points to about 1403.00, S&P 100 -2.00 points to 638.00 and the Nasdaq Composite +1.00 point to about 3075.00. Oil rallied closing higher by about +$1.20 around the $107.00 level.
Sales of existing homes fell -0.9% in February after an upward revision to the prior month, as improving job prospects, cheaper homes and warm weather led to the best start to the year since the bursting of the housing bubble. The National Association of Realtors said sales in February fell to a seasonally adjusted annual rate of 4.59 million, compared to an upwardly revised 4.63 million in January. January sales initially were recorded at a 4.57 million annual rate. The median price of an existing home rose +0.3% to $156,600 compared to year-ago period. Median prices typically are less in the winter because fewer families move during the school year, so smaller homes are sold. Inventories rose +4.3% to 2.43 million, or 6.4 months of supply. Inventories typically rise from February through the summer months.
Yesterday it was reported that builders started construction on new homes in February at a slightly slower pace, but an increase in permits indicates that work will pick up in the coming months. Housing starts fell -1.1% to an annual rate of 698,000 last month, compared with an upwardly revised 706,000 in January. Economists had expected housing starts to rise to 706,000 from an original reading of 699,000 in January. The data are seasonally adjusted. New construction of single-family homes, which account for three-quarters of the housing market, dropped almost -10% to an annual rate of 457,000. Construction of single-family homes is still +18% higher compared to one year ago, however. Work on multi-dwelling units, apartment buildings and the like jumped nearly +29% to an annual rate of 233,000. Permits to begin new construction, meanwhile, climbed +5.1% last month to an annual rate of 717,000, the highest level since the middle of the last recession in October 2008. Single-family home permits increased +4.9% to an annual rate of 472,000. Permits for condominiums and apartments rose a smaller +3.3% to a rate of 219,000. Permits, which have been gradually increasing since last fall, give an indication of whether demand for new homes is growing or slowing. New construction rose +3% in the Midwest and +1.5% in the South, but it fell -12.3% in the Northeast and -5.9% in the West. Most economists expect the housing market to continue to recover in 2012, but at a very slow pace.
Monday, March 19, 2012 4:03 p.m. est.
Interesting: According to CNBC.com, Meredith Whitney isn't backing off of her call for major municipal bond defaults. According to CNBC: '"There's been so much backroom political maneuvering to keep these cities from going bust...There's been every effort on the part of states to prevent really this tidal wave of defaults which is going to happen sooner or later," Whitney said. "If people want to tell me 'you're wrong because this hasn't played out,' stay tuned."'
The market started the week on the upside with the Dow seeing highs of +40.00 points, S&P 500 +11.00 points and the Nasdaq Composite +35.00 points as Apple rallied on the news of what it was going to do with all of its cash. In the end the market pulled back a bit with the Dow closing up by +7.00 points to 13,239, S&P 500 +6.00 points to about 1410.00, S&P 100 +3.25 points to 641.00 and the Nasdaq Composite +23.00 point to about 3078.00. Oil rallied today closing higher by about +$1.00 around the $108.00 level.
A measure of confidence by builders of new single-family homes remained unchanged in March after a slight downward revision to February's data. The housing market index stayed at 28%, coming in a point under economist forecasts of 29% but nonetheless at the highest level since June 2007. The component measuring current sales conditions fell 1 point to 29% in March, but the component of sales expectations in the next six months rose 2 points to 36%, the highest level in more than four years. The component measuring traffic stayed at 22%. The seasonally adjusted index is designed so that readings over 50% indicate "good" conditions, which hasn't been the case since April 2006.
On Friday it was reported that the cost of living in February rose by the fastest amount in 10 months as people paid sharply higher prices for gas. The consumer price index jumped +0.4% last month on a seasonally adjusted basis and was slightly below the +0.5% increase forecast by a economists. Core prices rose a smaller +0.1% on a seasonally adjusted basis. The core consumer price index strips out volatile food and energy costs because they are unneeded. Economists had forecast a +0.5% increase in the CPI, with a +0.2% rise in the core rate. Consumer prices have risen an unadjusted +2.9% over the past 12 months, unchanged from January. The core rate has increased +2.2% over the past 12 months, down from +2.3% in January. The government also reported that inflation-adjusted hourly wages, on average, fell -0.3% in February as higher prices outstripped a +0.1% gain in earnings.
The output of the nation's factories, mines and utilities was flat in February, the Fed said. This was well below expectations of a +0.4% gain. February production was suppressed by a drop in mining and auto production and a flat reading for utility output. January production was revised up to a +0.4% increase from the initial estimate of unchanged. Factory activity alone rose +0.3% in February after a +1.1% increase in the previous month. Capacity utilization, a gauge of slack in the economy, inched down to 78.7% in February from 78.8% in January.
Thursday, March 15, 2012 4:03 p.m. est.
Looks like MF Global is going to be giving out some more money as the trustee has applied to the court to give out an additional $685 million!!
The market started the day higher once again as economic data was “okay” but it quickly turned down when a rumor came out that Britain and America were going to dip into their oil reserves to help lower prices. The Dow was off -20.00 points, S&P 500 -1.00 point and the Nasdaq only -1.00 point as Apple was rallying over the $600 level. Apple has moved from $500 to $600 in only 22-days so the stock appears to be going into the parabolic mode which is possible even if the stock is cheap. The market didn’t stay down long though as the rumor was rejected by the government. The Dow saw highs of +45.00 points, S&P 500 +8.00 points and the Nasdaq Composite +20.00 points even though Apple turned into negative territory moving all the way down to the $578 level before bouncing back. Currently Apple is 34% of the movement in Nasdaq. Tomorrow is a quadruple witch with all S&P 500 cash, futures contracts and options expiring with the first trade of the index tomorrow morning. Something tells me its going to get interesting after that because this market is moving with so much manipulation its ready to blow!!!
The final hour saw pathetic volume once again so the market was able to hold its ground with the Dow closing up by +59.00 points to 13,253, S&P 500 +8.00 points to about 1403.00, S&P 100 +2.00 points to 636.00 and the Nasdaq Composite +16.00 points to about 3056.00. Oil was down pretty hard all day but after the rumor was verified false it came back closing lower by about -$.30 around the $105.00 level.
Wholesale prices rose a seasonally adjusted +0.4% in February, the fastest increase in five months. Excluding the volatile categories of food and energy, core wholesale prices rose a smaller +0.2% and we all need cheaper computers far more than food or gas!!! Economists had predicted a +0.5% increase in the overall producer price index and a +0.2% rise in core PPI. Energy prices jumped +1.3%, mainly because of a +4.3% increase in gasoline. Yet the cost of natural gas fell -14% although I never saw that on my bill! It was the biggest drop in four years, partly because of unseasonably warm weather. The wholesale cost of food, meanwhile, fell -0.1% to mark the third straight decline even though my food bill went up this month. Over the past year wholesale prices have risen an unadjusted +3.3%, the smallest 12-month change since August 2010. Maybe they are actually getting these numbers from Iceland or something because I don’t think they’re really that low over here!!!
Jobless Claims fell by -14,000 to 351,000, matching a four-year low. Claims from two weeks ago were revised up to 365,000 from 362,000. Economists had projected claims would fall to a seasonally adjusted 355,000. The four week average, meanwhile, was unchanged at 355,750. Continuing claims decreased by -81,000 to a seasonally adjusted 3.34 million. Continuing claims are reported with a one-week lag. About 7.42 million people received some kind of state or federal benefit in the week ended February 25th, up +36,392 from the prior week. Total claims are reported with a two-week lag.
The Empire State manufacturing index rose to 20.2% in March, the New York Fed said. This is the fourth straight increase after the index had sunk below zero from June through October. The gain in March surprised analysts as economists expected the index to slip to 17.7% in March. Underlying conditions were mixed. The new orders and shipment indices fell a bit. The two readings on employment were stronger though. The index for prices paid surged by 25 points to 50.6%, its highest level since last June. A reading of expected conditions in six-months retreated slightly for the second straight month.
Wednesday, March 14, 2012 4:03 p.m. est.
Interesting: According to The Wall Street Journal: "More Asian governments are pressing businesses to increases wages as a way to prevent outbreaks of labor unrest, raising the specter of higher manufacturing costs for global companies and the products they sell."
The market went back to its flat ways today most likely because in the shortest of times it was extremely overbought. It did start higher though attempting to be up for six days in a row with the Dow seeing highs of +35.00 points, S&P 500 +3.00 points and the Nasdaq Composite +10.00 points. It did turn negative midday though with the Dow off -15.00 points, S&P 500 -6.00 points and the Nasdaq -20.00 points even though Apple was up over +$20.00.
The final hour saw the market come back to close mixed. At the close the Dow was up by +17.00 points to 13,194.00, S&P 500 -2.00 points to about 1394.00, S&P 100 -.03 points to 634.00 and the Nasdaq Composite +1.00 points to about 3041.00. Oil was down all day closing lower by about -$1.00 around the $106.00 level.
You would think that the market would have reacted to this slip of the tongue overnight! In a stunning turn of events, a Japanese Ministry of Finance official said "Japan is fiscally worse than Greece". Bloomberg is reporting that, at a conference in Tokyo, Yasushi Kinosh*ta says Japan's 2011 fiscal deficit was up to 10% of GDP and its debt-to-GDP has soared to over 230%. Kinosh*ta said with the large amount of JGBs held domestically, the Japanese financial system is much more vulnerable to fiscal shocks such as energy prices than Europe. I think the reason why the market is ignoring it is because of the possibility of buybacks and hypnotized at big-banks-passing-stress-tests etc. I think if this sinks in the market could see a sizable correction.
Import prices rose +0.4% in February owing to a spike in oil. It's the first increase in three months and biggest gain since April 2011. Economists were expecting import prices to rise +0.6%. Import prices were revised lower for January and December to show no increase. Over the past year, import prices are up +5.5%. Imported fuel prices rose +1.4% in February, -1.8% for petroleum after a flat reading in the prior month. Fuel prices are up +15.2% over the past year. Excluding fuel, the price index for imports fell -0.1% following a +0.1% gain in January.
The current account deficit, which is the combined balances on trade in goods and services, income, and donations, widened to $124.1 billion in the fourth quarter, or 3.2% of gross domestic product, from a downwardly revised $107.6 billion in the third quarter. This is the largest quarterly deficit since the fourth quarter of 2008. The increase was larger than the roughly $115 billion deficit expected by economists. The wider deficit was accounted for by an increase in the deficit on goods and services and a decrease in the surplus on income. The third quarter deficit initially was reported as $110.3 billion. For the year, the deficit increased slightly to $473.4 billion, or 3.1% of GDP, from $470.9 billion in 2010. The small increase resulted from a wider goods deficit.
Tuesday, March 13, 2012 4:03 p.m. est.
Someone please shoot me!! I cannot believe that when we were 4.5 hours into trading there was only 350 million shares traded and even the closing volume was weak. All you heard from the media was Dow 13,000 and the Nasdaq 3000 levels. The market was up to start the day on hopes that the Fed would be flooding the system with more printed money into the market. The Dow saw highs of +125.00 points, S&P 500 +14.00 points and the Nasdaq +35.00 points. After the Fed released their decision to leave rates alone and said that the economy is continuing to struggle the market started to pullback a bit but when it was announced that the Fed’s stress tests results were coming out early the market started to rally and closed right at its highs.
At the close the Dow was up by +218.00 points to 13,178.00, S&P 500 +25.00 points to about 1396.00, S&P 100 +12.00 points to 634.00 and the Nasdaq Composite +56.00 points to about 3040.00. Oil was down early on but rallied after the rest of the market moved up closing higher by about +$.35 around the $107.00 level.
The current bull market started on March 9th, 2009 and we have seen a 100% plus move in the market since then and the higher it has gone the lower the volume has become. This isn’t surprising mind you as there are so many psychological scars from the previous bear market still fresh in investors minds. Besides that how can people get excited about investing when we are surrounded by record deficits, political gridlock, a crumbling European Union, slowing China, and peak corporate margins? What’s interesting though is that there have only been five other times that we have seen a +100% move in the market in this short a time and three of the five were lower three months later but only by a little and there was only one lower a year later. You would expect to see some type of a pullback but it appears that the rally continued so will this time be different, only time will tell.....
Retail sales climbed to a five-month high in February, as rising gasoline prices weren't enough to choke off demand for cars, clothing and other goods. Retail sales rose a seasonally adjusted +1.1% to $407.8 billion in February, and January sales were revised higher to show a +0.6% advance instead of an initially reported +0.4% rise. Excluding autos, sales climbed +0.9%. Economists had anticipated a +1.2% gain for the headline index and a +0.7% advance for retail sales excluding autos.
Business inventories climbed a seasonally adjusted +0.7% in January to $1.57 trillion. Economists had anticipated a +0.5% gain, and the rise in inventories was the largest since October. The gain was led by auto inventories, which were up a strong +2.6%. Inventories, which aren't adjusted for price were up +7.6% higher than the same period in January. 2011. The ratio of inventories to sales stayed at 1.27 in January.
Monday, March 12, 2012 4:03 p.m. est.
Today was an incredibly bland day in the market with little movement. The Dow saw highs of +45.00 points, S&P 500 +2.00 points and the Nasdaq +10.00 points. There was a bit of a correction midday with the Dow being down only -10.00 points, S&P 500 -5.00 points and the Nasdaq -15.00 points even though Apple was over the $550.00 level.
At the close the Dow was up by +38.00 points to 12,960.00, S&P 500 +.22 points to about 1371.00, S&P 100 +1.00 points to 622.00 and the Nasdaq Composite -5.00 points to about 2984.00. Oil was down earlier on but rallied a bit to close lower by about -$1.06 around the $106.00 level.
The market is looking scarier and scarier here as the volatility index was actually below 15 at one point today and when you see closing volume of barely over 500 million that is dangerous! I wish the market would just get a decent correction done and over with and then it could move on otherwise its setting up for a big spill!
Friday, March 9, 2012 4:03 p.m. est.
The market continued to move higher today even though the employment report out tis morning was just in line with expectations and the trade deficit was reported at its highest monthly level ever!! .42 cents of every dollar being spent by the government is being borrowed which is something that continues to get worse and could easily see another lowering of our credit rating!!! Unfortunately the market even remained higher after Fitch Ratings downgraded Greece's long-term foreign- and local-currency rating to "RD" or Restricted Default, from "C," after Greece finalized a debt-swap deal with private creditors earlier this morning. The Dow saw highs of +65.00 points, S&P 500 +10.00 points and the Nasdaq +25.00 points. The final hour did see the market pull back a bit.
At the close the Dow was up by +14.00 points to 12,922.00, S&P 500 +5.00 points to about 1371.00, S&P 100 +1.00 points to 621.00 and the Nasdaq Composite +18.00 points to about 2988.00. Oil was down earlier on but closed higher about +$.88 around the $108.00 level.
The economy added +227,000 jobs in February while hiring in January and December was revised up by a combined +61,000. The unemployment rate remained at 8.3%, largely because more people entered the workforce in search of jobs. Economists had forecast +213,000 jobs last month, with the jobless rate holding steady at 8.3%. Subtracting another decline in government jobs, the private sector employment payrolls fell by -233,000. Average hourly earnings rose by +3 cents, or 0.1%, to $23.31 and hours worked was flat at 34.5. Job gains for January were revised up to +284,000 from +243,000, the biggest monthly increase since the recession ended and December's employment gains were revised up to +223,000 from +203,000. The past three months of full-time job growth is the fastest since early 2006. Although hiring has quickened, the economy faces persistent long-term unemployment. In February, about 43% of the 12.8 million unemployed people had been out of work for more than six months.
Although the job market is gaining some ground, the pace of improvement remains too slow to do much to absorb the +23.5 million people who are either out of work or underemployed, which includes part- time workers who’d prefer a full-time position and people who want work but have given up looking, falling to a three-year low of 14.9% from 15.1%. The report also showed a decrease in long-term unemployed people. The number of people unemployed for 27 weeks or more fell as a percentage of all jobless, to 42.6% from 42.9% while the labor force participation rate, the percentage of working-age people either with a job or looking for one rose to 63.9% from 63.7% in January.
Private companies again accounted for all the job gains in February, adding +233,000 positions. Government employment fell a modest -6,000, declining for a sixth straight month. Manufacturing, which in January recorded the largest gain in a year, dominated job creation in February, hiring +31,000 new workers.
The trade deficit widened by +4.3% in January to $52.6 billion, the largest gap since October 2008. The trade deficit was above the consensus forecast of economists of a deficit of $49.0 billion. Imports rose faster than exports in January. The deficit with China widened to $26.0 billion in compared with $23.3 billion in the same month last year. The government also revised the deficit in December to $50.4 billion from $48.8 billion. This could trim estimates of fourth-quarter gross domestic product, now estimated to have grown at a +3% annual pace.
Thursday, March 8, 2012 4:03 p.m. est.
Interesting; Iceland seems to love Canada. So much so it might even adopt the Canadian loonie as its currency. Right now its only being proposed but is being discussed openly more and more in Iceland’s financial community and press. Although I shouldn’t say this out loud, maybe the U.S should do the same!!! Yes I know they have more tanks than us but we did kick your ass a couple of times in the past haha....
The market continued its rally today with the Dow seeing highs once again in the final hour of +110.00 points, S&P 500 +16.00 points and the Nasdaq +45.00 points.
At the close the Dow was up by +71.00 points to 12,908.00, S&P 500 +13.00 points to about 1366.00, S&P 100 +6.00 points to 620.00 and the Nasdaq Composite +35.00 points to about 2970.00. Oil also continued to rally today up about +$.60 around the $107.00 level.
Tomorrow we get the employment report and it could be market moving especially considering the action in other global economies which are showing signs of slowing. Volume has also been rising on down days and that's a negative. Other indicators are also suggesting that there could be more to the down side. The move we have seen the past two days is likely just to fill a gap that was produced on Tuesday's big decline. Most gaps eventually get filled and then the real test begins!
There is also the potential for a double top. Market breadth and momentum indicators have been leaning toward the negative side of late, which means that fewer stocks are holding the market up and it is getting tired as I noted yesterday with Insiders selling stocks at record pace. The next few days are likely to be hugely important and likely to define what happens over the next few weeks to months.
Jobless claims moved to their highest level in five weeks, climbing by +8,000 to a seasonally adjusted 362,000. Economists had estimated claims would rise to 355,000. Claims from two weeks ago were revised up to 354,000 from 351,000. The four-week average of claims, meanwhile, rose by a mere +250 to 355,000. The monthly average smooths out seasonal quirks and provides a more accurate view of labor-market trends. Continuing claims increased by +10,000 to a seasonally adjusted 3.42 million in the week ended February 25th. Continuing claims are reported with a one-week lag. About 7.39 million people received some kind of state or federal benefits, down -111,222 from the prior week. Total claims are reported with a two-week lag and are not seasonally adjusted.
The number of planned layoffs at American firms fell in February, with the transportation and consumer products sectors seeing the most job cuts. Employers announced -51,728 job cuts last month, down -3.3% from 53,486 in January, according to the report from consultants Challenger, Gray & Christmas Inc. Still, February's job cuts were up +2% from the same time a year ago when 50,702 cuts were announced. For the first two months of 2012 there have been 105,214 layoffs, about an +18% jump from 89,221 at the start of last year. Transportation and consumer product companies announced the most cuts last month with +14,065 and 13,856 layoffs, respectively. "Both sectors are undoubtedly feeling the impact of rising fuel prices as heavy users of fuel, but also from their dependency on consumers, who are being forced to spend more on gasoline and less on the products and services provided by these firms," John Challenger, chief executive officer of Challenger, Gray & Christmas, said in a statement. However, far fewer jobs have been cut in the government sector this year, with layoffs falling to 3,654 for January and February from 22,830 the same time last year. Meanwhile, planned hiring announcements jumped +42% to 10,720 in February from 7,568 in January but that level dropped off 85.2% from 72,581 in February 2011.
Wednesday, March 7, 2012 4:03 p.m. est.
Interesting; According to The Wall Street Journal: "Young people entering the job market are taking the brunt of the downward pressure on wages caused by high unemployment, according to a new analysis of pay trends. In data compiled for a coming report, the Economic Policy Institute, a center-left think tank in Washington, found that the average inflation-adjusted hourly wage for male college graduates aged 23 to 29 dropped -11% over the past decade to $21.68 in 2011. For female college graduates of the same age, the average wage is down -7.6% to $18.80."
Not surprisingly the market bounced today as the market was very oversold short term and yesterday’s sell off was the biggest sell off so far this year!! The Dow saw highs in the final hour of +110.00 points, S&P 500 +12.00 points and the Nasdaq +35.00 points.
At the close the Dow was up by +78.00 points to 12,837.00, S&P 500 +9.00 points to about 1353.00, S&P 100 +4.00 points to 615.00 and the Nasdaq Composite +25.00 points to about 2910.00. Oil rallied today up about +$1.50 around the $106.00 level.
In the short term the market has become incredibly oversold so its looking as if the move lower at least in the short term may be nearing an end but as we get deeper into March that is usually when volatility starts and there are some red flags going up on the market according to newsletter writer Mark Hulbert! Hulbert has a great database of information, compiled over decades of following the results of investment newsletter writers and other sources and his latest news may be quite timely. Hulbert notes that corporate insiders "continue to sell shares of their companies at a well-above-average pace." In fact, they are behaving even more bearishly than one month ago which is big as their pace of selling in early February was the highest since last July, right before the bottom dropped out of the market.
The market's breadth for the past several weeks has been poor, a fact that seems to coincide with Hulbert's insider selling. Hulbert adds the following ominous note: "the market must now contend with insider behavior that is even more lopsided to the sell side. We have to go back nearly a year, to the weeks leading up to the late April 2011 stock market top to find another period in which insiders were as bearish as they are now." Data from Vickers Weekly Insider Report notes that the most recent sell to buy ratio of insiders, published last Friday "stood at 6.56-to-1. A month ago, in contrast, it was 5.77-to-1." That means that a month ago it was pretty bad and now it's even worse. The problem is that Vickers editor David Coleman writes: “We have not seen such a consistent number of sales reported by insiders since May 2011, with overall selling elevated for five consecutive weeks now. When this last happened, a correction came a callin.”
Something to watch......
Private-sector payrolls increased +216,000 in February, led by the service-providing sector and small businesses, according to the ADP employment report. The January gain was revised to +173,000 from a prior estimate of +170,000. Markets look to ADP's report on private-sector payrolls to provide some guidance on the Labor Department's jobs estimate, which will be released Friday and includes information on both private- and public-sector payrolls. Economists expect the employment rose +213,000 in February, compared with +243,000 in January. They also expect that the unemployment rate remained at 8.3%.
Tuesday, March 6, 2012 4:03 p.m. est.
Well we finally saw the market correct today! Mostly because of overnight worries about the world economy slowing and remarks from Prime Minister Benjamin Netanyahu's last night before the UN basically saying that he won’t for the U.S or any sanctions to work if his country feels his country is in danger. China warned yesterday that they were slowing down and overnight Brazil reported a +3% GDP, another indication of a slowdown. Last year they were +10%!
Yesterday I didn’t mention the comments by Fed Dallas Fed President Richard Fischer saying that he thinks there is no further need for easy money. Mr. Fischer is the most vocal of the Fed members at this point and interestingly his message may be being heard. He mentioned that the stock market is running on "monetary morphine" and has been talked about a lot this morning! According to The Wall Street Journal, many money managers think that this year's stock market rally "may be based on a whole lot of nothing, which is why they aren't doing much of anything." This may be why volumes have remained so low since Christmas with yesterday’s being atrocious.
The Dow saw its first triple digit loss of the year and the S&P saw its first -1% plus loss in 46 sessions! It hasn’t done that since 2007. The Dow saw lows in the final hour of -230.00 points, S&P 500 -24.00 points and the Nasdaq down -55.00 points.
At the close the Dow was down by -204.00 points to 12,759.00, S&P 500 -21.00 points to about 1343.00, S&P 100 -9.00 points to 611.00 and the Nasdaq Composite -40.00 points to about 2910.00. Oil was down pretty hard from the possibility of a slowing world economy closing down about -$2.00 around the $105.00 level.
Monday, March 5, 2012 4:03 p.m. est.
The market started the week on the downside as profit taking set in after it was reported that inflation seemed to be picking up and that China is seeing a slowdown. China cut its growth goal to +7.5% from an +8% target, and Italy and Spain stood out as the leading trouble spots as a gauge of euro-area business activity contracted in February according to them. The Dow saw lows of -90.00 points, S&P 500 -11.00 points and the Nasdaq down -40.00 points. Of course the final hour saw the market come back once again but it is getting apparent that the market is looking tired and is at the least rolling over a bit to consolidate its recent strong gains. The scary thing is that there was only 575 billion shares traded right at the close which is unbelievable!!!
At the close the Dow was down by -15.00 points to 12,963.00, S&P 500 -5.30 points to about 1364.00, S&P 100 -2.00 points to 620.00 and the Nasdaq Composite -26.00 points to about 2950.00. Oil was flat closing up about +$.30 around the $107.00 level.
The service sector expanded at a somewhat faster pace in February and indicated growing optimism about the economy. The service sector employs about four of every five workers in fields such as health care, education and retail and accounts for about 3/4’s of economic growth. Companies in the service sector, which employs most of the nation's workforce, expanded at a faster pace in February, says ISM. The Institute for Supply Management said its service index rose to a one-year high of 57.3% last month from 56.8% in January. Economists expected the index to fall to 55.5%. Readings over 50% indicate more firms are expanding than contracting. The new-orders portion of the ISM service index rose +1.8 percentage points to 61.2%, the highest level since February 2011. The prices index, however, jumped a huge +4.9% to 68.4%, reflecting higher prices for commodities such as fuel and food. Exports slowed and the employment index dipped slightly to 55.7%, although that’s still at a level usually associated with a steady pace of hiring. 14 of the 17 service sectors tracked by ISM reported growth. Real estate, rental and leasing companies and firms that provide educational services reported the faster growth. Three sectors contracted: professional support services, retail and health care.
Factory orders in January fell -1% to $462.6 billion. December's gain was upwardly revised to show +1.4% growth from an initially reported +1.1% gain. Economists had expected a -1.5% fall. Durable-goods orders for January was revised to show a -3.7% drop, instead of the initially reported -4% decline.
Friday, March 2, 2012 4:03 p.m. est.
Interesting: In a move that could backfire, AT & T is cutting back on its data speeds on its smart phones. According to The Wall Street Journal: "AT&T pulled the plug on its all-you-can-eat plan for smartphone customers, telling subscribers they will see much slower speeds if they exceed a new monthly usage cap." With the surge of Smartphones I think this is a bad move and they have lost touch with their customers.
More important is that Nissan is bringing back the Datsun brand yeah!! Maybe I’ll be able to get another Datsun 240Z, I had a 1972 custom sports car, very nice!!
The market was pretty quiet to end the week with no particular news out so the Dow saw lows of -50.00 points, S&P 500 -7.00 points and the Nasdaq down -20.00 points.
At the close the Dow was down by -3.00 points to 12,978.00, S&P 500 -4.50 points to about 1370.00, S&P 100 -1.45 points to 622.00 and the Nasdaq Composite -13.00 points to about 2976.00. Oil sold off today after everyone decided that the Saudi pipeline wasn’t blown up after all closing down about -$2.25 around the $107.00 level.
Thursday, March 1, 2012 4:03 p.m. est.
Yesterday was an interesting day in the market as it started the day higher with the Nasdaq touching the 3000 level but when it didn’t get a positive affirmation from Fed chief Ben Bernanke just after the open it moved quickly to the downside and remained there into the close finishing the day down about half a percent. Today it once again bounced at the start but slipped once again when Bernanke started his second day of testimony. It never did go negative however and made new highs with the Dow seeing highs of +75.00 points, S&P 500 +11.00 points and the Nasdaq up +30.00 points.
At the close the Dow was up by +28.00 points to 12,980.00, S&P 500 +8.00 points to about 1374.00, S&P 100 +4.00 points to 623.00 and the Nasdaq Composite +22.00 points to about 2989.00. Oil rallied today after it was announced by Iranian television that an oil pipeline in Saudi Arabia was blown up. It remained near highs even though it was denied by Saudi officials closing up about +$2.00 around the $109.00 level.
What spooked the market yesterday was what Bernanke said about the recent improvement in the unemployment rate has put the Fed on alert and watching incoming data closely. Fed Chairman Ben Bernanke said; "It will be especially important to evaluate incoming information to assess the underlying pace of economic recovery," in light of the "somewhat different signals" received recently from the labor market than from indicators of final demand, Bernanke said in testimony prepared for the House Financial Services Committee. In his testimony, Bernanke stopped short of saying the improvement in the unemployment rate meant a better economy ahead. The unemployment rate dropped to 8.3% in January after hovering close to 9% for much of 2011.
Today it was reported that Jobless Claims fell by -2,000 to a seasonally adjusted 351,000 while claims from two weeks ago were revised up to 353,000 from 351,000. Economists had estimated claims would fall to 350,000. The four-week average of claims, meanwhile, dropped -5,500 to 354,000, keeping it at a four-year low. Hiring usually picks up when applications for jobless benefits drop below 400,000, based on historical patterns. New applications for jobless benefits have fallen under that mark in 15 of the past 17 weeks. Continuing claims were 7.50 million people receiving some kind of state or federal benefits up +11,933 from the prior week. Total claims are reported with a two-week lag and are not seasonally adjusted.
Personal income rose +0.3% in January after a +0.5% jump in December. Consumer spending edged up +0.2% after no movement at all in December. Economists had expected +0.4% gains for both income and spending. Consumer spending, while worse than forecast, had some positive signs in January. Durable-good spending climbed +0.9% and nondurable good spending rose +0.4%. It was only services spending that was flat, and that may have been impacted by a lesser need to heat homes due to the fourth-warmest January on record. An inflation gauge the Fed closely tracks, the personal consumption expenditure price index, rose +0.2% in January after a +0.1% gain in December. Core PCE inflation, which strips out food and energy, rose +0.2%, matching economist expectations.
Manufacturers expanded at a slower pace in February, according to a key index. The Institute for Supply Management said its manufacturing index declined to 52.4% last month from 54.1% in January. Economists had expected a reading of 55% for February based on improving regional results and employment data. Readings over 50% indicate that manufacturers are generally expanding.
Construction spending eased -0.1% in January to a seasonally adjusted annual rate of $827 billion, the first monthly dip since July. Economists had expected a +0.7% gain, and December's gain was revised to +1.4% from +1.5%. Private residential construction improved +1.8% in continuing some of the other positive trends seen from the housing market. However, private nonresidential construction fell -1.5%, dragged lower by manufacturing and power spending, and public construction eased -0.2% after a -5.5% decline in federal construction. Compared to January 2011, construction spending is up +7.1%, and the areas of weakness on a monthly level. Private manufacturing and power construction was up a huge +38.5% and +28% year-over-year, respectively.
Yesterday it was reported that the economy grew +3% in the fourth quarter, faster than originally reported, mainly because of increased commercial construction and consumer spending and lower imports. It was still the fastest increase in a year and a half, according to revised Commerce Department data. Economists projected GDP growth would be revised down to +2.7% from an initial reading of +2.8%. Real final sales which exclude imports and inventories, rose +1.1% instead of +0.9% as originally reported. Inventories, a major source of fourth-quarter growth, totaled $54.3 billion instead of $56 billion as initially reported. Inflation as measured by the consumer PCE index rose +1.2% in the fourth quarter, or by +1.3% on a "core" basis if food and energy are excluded. Real disposable income climbed +1.4% in the fourth quarter, compared with an earlier reading of +0.8%. The personal savings rate was 4.5%, up from an initial estimate of 3.7%.
The Chicago business barometer, which also is known as the Chicago PMI, accelerated to a reading of 64% in February from 60.2% in January, ISM-Chicago. The index measuring production was the highest since April, new orders hit an 11-month high, order backlogs moved out of contraction and employment had the biggest one-month gain since March 2008. Economists had anticipated a small dip to 60%.
Tuesday, February 28, 2012 4:03 p.m. est.
Interesting: After a few months of reducing credit card debt levels Americans are starting to return to their reliance on debt. It seems that last holiday season many consumers financed Black Friday trips to the mall and Cyber Monday online buying sprees by making purchases with plastic. In December 2011, the total consumer debt which is the combination of non-revolving and revolving debt rose by +9.3% to $2.498 trillion, according to the latest Fed numbers. Both revolving debt and non-revolving debt increased. Revolving debt, which is credit-card debt, went up by +4.1%. Non-revolving debt, which includes loans for cars and education, rose +11.8%, the central bank's report said. The trend month to month, quarter to quarter and year to year is rising steeply and with a weak economy with high unemployment many people with big card balances become vulnerable to financial problems.
The market started the day on the downside due to some poor economic data but Globex futures had been higher earlier on even though S&P lowered Greece’s rating now to a “selective default”. The Dow only saw lows of -30.00 points, S&P 500 -2.00 points but the Nasdaq was up +5.00 points as Apple was up strongly because of their announcement about the new Ipad that is coming out next week. Thirty minutes into trading there was some positive economic data out and that turned the market around with the Dow seeing highs of +40.00 points, S&P 500 +5.00 points and the Nasdaq up +25.00 points. It almost looked like the market was going to turn around once again as selling took hold but the final hour pulled indices back into the green.
At the close the Dow was up by +24.00 points to 13,005.00, S&P 500 +5.00 points to about 1372.00, S&P 100 +3.00 points to 622.00 and the Nasdaq Composite +21.00 points to about 2987.00. Oil was lower once again closing down about -$2.00 around the $106.50 level.
Orders for Durable Goods fell a bigger-than-expected -4% in January, as demand for a broad array of products fell. Economists had expected orders to fall -1.3%, largely because of lower aircraft orders and the year-end expiration of a temporary tax credit. Bookings fell -19% for commercial aircraft, -10.4% for heavy machinery, -10.1% for computers and -6.7% for primary metals. Auto orders rose +0.9%, however. Excluding the volatile transportation sector, orders dropped -3.2%. Orders minus defense sank -4.5%. Orders for core capital goods, which exclude defense and transportation, slid -4.5% last month. Shipments of core capital goods, a number used to help calculate quarterly gross domestic product, declined -3.1% in January. The increase in durable-goods orders in December, meanwhile, was revised up to +3.2% from +3%.
Home prices ended 2011 on a downbeat note as a drop in prices in December sent the seasonally-adjusted index to its lowest level since 2003. The S&P/Case Shiller composite index of 20 metropolitan areas declined -0.5% on a seasonally adjusted basis, in line with economists' expectations, after falling -0.7% in November. The 20-city index fell to 136.63, the lowest level since January 2003. "After a prior three years of accelerated decline, the past two years has been a story of a housing market that is bottoming out but has not yet stabilized. Up until today's report we had believed the crisis lows for the composites were behind us," David Blitzer, chairman of the index committee at Standard & Poor's, said in a statement. "The pick-up in the economy has simply not been strong enough to keep home prices stabilized. If anything it looks like we might have reentered a period of decline as we begin 2012." Prices in the 20 cities dropped -4% year over year, topping expectations for a drop of -3.6%. For the fourth quarter, the national index fell -1.7% on a seasonally adjusted basis.
A gauge of U.S. consumer confidence rose to 70.8% in February, reaching the highest level in a year, with more optimism on jobs, the Conference Board reported. "Consumers are considerably less pessimistic about current business and labor market conditions," said Lynn Franco, director of the Conference Board's consumer research center. Despite further increases in gas prices, they are more optimistic about the short-term outlook." The January reading for confidence was revised to 61.5% from a prior estimate of 61.1%. Generally when the economy is growing at a good clip, confidence readings are at least 90%. Economists had expected a reading of 64.5% for February on improving employment figures and higher stock prices.
Monday, February 27, 2012 4:03 p.m. est.
Interesting; Cure for cancer; Robocures May Be On Their Way According to Bloomberg.com: "Scientists have created a robot made entirely from DNA that can be instructed to find diseased cells in the body and deliver a payload to kill or reprogram them, according to a study from Harvard University. The robot was constructed by folding DNA strands into a shape that looks roughly like a clamshell. The researchers programmed the nano-sized device to open in the presence of leukemia and lymphoma cells in a laboratory dish, where they delivered immune system antibodies that caused the cells to self-destruct, according to a report in the journal Science."
The market started the week on the downside mostly from profit taking and stimulus talk from the EU with the Dow seeing lows of -110.00 points, S&P 500 -11.00 points and the Nasdaq -30.00 points but of course when there was an announcement of another possible stimulus package for Greece the market turned around with the Dow seeing highs of +60.00 points, S&P 500 +6.00 points and the Nasdaq up +15.00 points in the final hour. Interestingly after the G20’s International Monetary Fund announced that they weren’t going to give the EU any more money there wasn’t a reaction.
At the close the Dow was down by -1.00 points to 12,982.00, S&P 500 +2.00 points to about 1368.00, S&P 100 +1.00 points to 619.00 and the Nasdaq Composite +3.00 points to about 2966.00. Oil was lower closing down for the first time in a week down -$.60 around the $108.00 level.
The market remains overbought and sentiment remains too high so the reason were seeing the market struggle to go higher from here. The market has seen a nice bounce off the bottom since the beginning of the month and has gone up another +5.5% since then but now we're almost +10% over the 200-day moving average on less and less volume and that's a big air pocket below us on the S&P so the lack of more free money from the G20 is likely going to continue to hold the market back a bit.
I’ve done some more research on employment in the States and it continues to be very intriguing to follow. The number of unemployed workers can be figured out in many ways and as with all statistics, it's how you shape the numbers. That's why the official unemployment rate, which currently stands at 8.3% is being debated, especially in political circles. According to a report in Investor's Business Daily: "the number of jobless Americans at the fringe of the workforce has never been greater. The gap between headline and alternative joblessness is the highest on record, according to an IBD analysis of Labor Department data."
Why is this important? For one thing the rate recently reported is incomplete. According to the report: "The official number excludes a record 2.81 million discouraged or other “marginally attached” people out of work that aren’t currently looking but are willing and able. Factoring these people in, unemployment is a much higher 9.9%, 1.6 percentage points above the official rate and is the widest gap on record going back to 1994."
That means that if this was the figure considered to be "official" Obama would be trying to explain why 10% of people that want to work are still looking. The "official" unemployment rate is called U-3 by the Labor Department. But the larger figure described above is called U-5. Now some in Congress want to make U-5 the official number and they are getting support from economists that say that using U-3 was an arbitrary decision. To me this is just another prime example of how the government, corporations, and the media dumb down statistics that they release to the public. Much of the reason for the dumbing down is that our education system fails to teach students to dig below the surface and to truly understand what they are reading and hearing. It's a real shame that fewer and fewer people are interested in getting to the bottom of what's really going on in Washington.
It was reported this morning that Pending Home sales climbed +2% in January to the highest level since April 2010, when buyers were taking advantage of a now-expired tax credit. The pending-home-sales index rose to 97% from a downwardly revised 95.1% reading in December, the National Association of Realtors reported. Even without the revision, the index would have shown growth, as December's index initially was reported as 96.6%. Compared to January 2011, pending home sales were up +8%. The data reflects contracts but not closings, and the percentage of real-estate agents who report at least one cancellation has hovered around 33% over the last few months.
Thursday, February 23, 2012 4:03 p.m. est.
Interesting; Cure for cancer; Robocures May Be On Their Way According to Bloomberg.com: "Scientists have created a robot made entirely from DNA that can be instructed to find diseased cells in the body and deliver a payload to kill or reprogram them, according to a study from Harvard University. The robot was constructed by folding DNA strands into a shape that looks roughly like a clamshell. The researchers programmed the nano-sized device to open in the presence of leukemia and lymphoma cells in a laboratory dish, where they delivered immune system antibodies that caused the cells to self-destruct, according to a report in the journal Science."
So far the market has been pretty flat on this shortened trading week with the Dow hitting the 13,000 level but then closing only slightly up on Tuesday and down yesterday. With today’s higher close its up about half a percent for the week. Today the market looked like it was going to make new lows for the week however as the Dow was down -60.00 points, S&P 500 -6.00 points and the Nasdaq -15.00 points but as Apple turned higher so did the market with the Dow seeing highs of +70.00 points, S&P 500 +7.00 points and the Nasdaq up +25.00 points. So far the market remains in a very tight rising wedge which generally ends in a bad way and with sentiment now turning extremely bullish a correction is likely to hit when no one expects it.
At the close the Dow was up by +46.00 points to 12,984.00, S&P 500 +6.00 points to about 1364.00, S&P 100 +2.00 points to 617.00 and the Nasdaq Composite +24.00 points to about 2957.00. Oil was also higher closing up +$2.25 around the $108.50 level.
Oil has been on a tear of late helped engineer a 10% rise in crude, Brent Crude crossing it's 2008 highs of $124, costing consumers an extra $10 billion per month at the pumps and in their energy bills not even including the rise in food prices but don’t worry there is no inflation because food and energy are considered unimportant by the Fed! The latest rise is because of the threats from Iran. Do you know what’s frustrating about that, the fact that there are 100,000,000 more barrels of oil in storage in the U.S now than there was in 2008!! That's 12 days worth of imports in addition to the 204 days of imports we already had. Of the 8.5 million barrels imported 5 million comes from Canada and Mexico and Iran isn't going to be cutting off the Gulf of Mexico, are they? Another 2.5 million comes from South America and I'm pretty sure Iran doesn't control the Atlantic yet but of course the media plays it up like Iran even has a chance against America’s 5th Fleet, which is deployed in the Gulf right now!!!
So, for the 1 million barrels of oil that we actually import from OPEC, we have a 1,750 per day reserve to draw down on in case Iran is able to cut off 100% of the supply so we really only need to get concerned around year 3 of the blockade!!! Somehow I don’t think that Opec production which is already at 30.9 million barrels, back to all time highs, is going to allow them to stop the flow!! Saudi Arabia alone is putting out 11 million, which is the highest level since the Iran-Iraq war, when oil was below $40 a barrel despite the war and Saddam setting oil fields on fire. This is a sure sign that all of this move in oil is purely speculative and the mostly left medias ploy to get North America to stop driving!
There is already such a glut of supply in North America did you know that a barrel of Alberta’s tar sands oil actually is sold for $63 and that has been a trend for a while so why is the price of gas so high!!! The cost of producing this oil has fallen below $20 now!! That is why these manipulating green/oil company *&^% that have taken over North America not to mention most of the free world need to have their charade stopped!!
I saw an interesting report out last night that revealed that if all of the oil from the Alberta tar sands was burned it would create a +0.3 degree temperature rise in the planet. Coal which the left never seems to even mention just because they have chosen to ignore it would cause a +15 degree temperature change on the planet if it was all burned! I’m all for electric cars and being green but would rather see the natural progress of change than it being manipulated by the government or leftist people. Maybe this will be the final gas price hike that will get sensible people moving!
Jobless claims were unchanged last week at a seasonally adjusted 351,000. Economists estimated claims would total 353,000. Claims from two weeks ago were revised up to 351,000 from 348,000. The four-week average of claims, meanwhile, fell by -7,000 to 359,000, the lowest level since March 2008. Continuing claims fell by -52,000 to a seasonally adjusted 3.39 million. Continuing claims are reported with a one-week lag. About 7.5 million people received some kind of state or federal benefit in the week ended February 4th, down -178,619 from the prior week. Total claims are reported with a two-week lag and are not seasonally adjusted.
Friday, February 17, 2012 4:03 p.m. est.
Interesting; this is the best 10th start of the year for the market and seven out of nine have seen higher prices for the rest of the year. One of those years that started strong was last year which happened to see the market turn flat to end the year, however, up but not much. I am starting to get concerned with this move as it has been straight up since the start of the year and although that’s nice, it is very unhealthy and the longer it lasts, the more likelihood of a sharp sell off will occur. Yesterday may have been the start of volatility returning so even if the market continues higher it will do it in proper trading manner.
The market was higher once again this morning on rumors that for sure the Greeks will be saved this coming Monday! It has only been almost a month since the EU offered them a package to save their butts! The Dow saw highs of +65.00 points, S&P 500 +6.00 points but the Nasdaq was up only +5.00 points as tech stocks were being sold.
The market held its gains going into the long weekend as the market is closed this coming Monday for Presidents day so at the close the Dow was up by +46.00 points to 12,950.00, S&P 500 +3.00 points to about 1361.00, S&P 100 +2.00 points to 615.00 and the Nasdaq Composite -8.00 points to about 2952.00. Oil was also higher because of worries about Iran once again closing up +$1.20 around the $103.50 level.
The underlying rate of inflation accelerated by the fastest pace in four months in January, the Labor Department said. The consumer price index increased +0.2%, driven by the first increase in gasoline prices since September. Food prices rose +0.2 % for the second straight month. The core CPI index, excluding food and energy costs, was up +0.2%. Economists were expecting the CPI to rise +0.3% after remaining flat in the prior month. The core rate was expected to rise +0.2% after rising +0.1% in the previous month.
Thursday, February 16, 2012 4:03 p.m. est.
Well after today’s move it seemed that yesterday’s sell off was just a strange anomaly of people taking profits as the market turned around and rallied most of the day with the Dow seeing highs of +140.00 points, S&P 500 +16.00 points and the Nasdaq +45.00 points. It may have also been partially expiration related as we hovering around the S&P 500’s 1350 level. It will be interesting to see how tomorrow turns out.
At the close the Dow was up by +123.00 points to 12,904.00, S&P 500 +15.00 points to about 1358.00, S&P 100 +7.00 points to 613.00 and the Nasdaq Composite +44.00 points to about 2960.00. Oil was also higher all day closing up +$.50 around the $102.50 level.
Jobless claims fell by -13,000 to a seasonally adjusted 348,000 and is the lowest level since March 2008, when we were in the early stages of a recession. Economists estimated claims would total 368,000. Claims from two weeks ago were revised up to 361,000 from 358,000. The four-week average of claims, meanwhile, fell by a smaller -1,750 to 365,250, keeping it near a four-year low. Continuing claims fell by -100,000 to a seasonally adjusted 3.43 million. Continuing claims are reported with a one-week lag. About 7.68 million people received some kind of state or federal benefit in the week ended January 28th, up +18,304 from the prior week. Total claims are reported with a two-week lag and are not seasonally adjusted.
Wholesale prices rose a seasonally adjusted +0.1% in January because of higher costs of pharmaceutical drugs, light trucks and appliances. Economists had predicted a +0.5% increase, largely because of rising gasoline prices. Yet a +2% increase in wholesale gas prices was more than offset by a drop in the cost of electricity and home-heating fuels, a result of unseasonably warm winter weather. Overall energy costs fell -0.5% in January. The wholesale cost of food, meanwhile, fell -0.3%, primarily because of lower prices for fresh and dry vegetables. Minus those two categories, so-called core wholesale prices rose a surprisingly sharp +0.4%, double forecasts. Over the past year wholesale prices have risen an unadjusted +4.1%, the lowest year-over-year increase since January 2011.
New construction rose +1.5% in January, reaching a seasonally adjusted annual rate of 699,000, according to estimates from the Census Bureau and the Department of Housing and Urban Development. Economists had expected a rate of 688,000 housing starts for January, with unseasonably warm weather boosting results. In December the rate reached 689,000, compared with a prior estimate of 657,000. Single-family housing starts fell -1% in January to a rate of 508,000. Meanwhile, starts in buildings with at least five units rose +14.4% to a rate of 175,000. Despite some gains, analysts note that housing data remains at relatively low levels, and the market faces a lengthy recovery.
Wednesday, February 15, 2012 4:03 p.m. est.
Well today was interesting, if I was still a stock trader I would have made a lot of money shorting Apple! I pretend sold 100,000 shares at $520 and bought them back for $505 for a $15 or $1,500,000 profit!! Apple has risen for eight straight days and is starting to act like a stock in a blowoff. It is currently trading 32% above its 200-day moving average. That means that it could drop over 30% in price and still, by definition, remain in a rising long term channel, since it would be above its 200-day line. It also has a gap that needs to be filled at $430.00 which eventually will be but that could be quick or take years and with its low p/e ratio I would only dare a short on Apple on a day trade basis! Nice profit for a couple of hours of investment though, now I wish it was real!!! Anyhow its meteoric rise has been affecting the overall market. Apple is 10% of the Nasdaq now so with its big rally it has moved the Nasdaq up 450 Nasdaq points or +18% since Thanksgiving even though 70 out of 100 of the companies have seen lower revenues and lower earnings than they did a year ago! This means if it sells off this is why the market could see a good pullback. For example Apple was up over +3% earlier today taking the S&P 500 to highs of +4.00 points and the Nasdaq +15.00 points. With todays' sell off of Apple that took the overall market into the red with the Dow seeing lows of -110.00 points, S&P 500 -6.00 points and the Nasdaq Composite -10.00 points. The market bounced a little when Apple bounced back taking the Nasdaq back into positive territory but after the Fed’s minutes were released at 2:00 p.m. est and it said that only a few members of the Fed favored another round of quantitative easing, or QE3 the market started to drift lower once again. The final hour saw new lows on the Dow of -130.00 points, S&P 500 -11.00 points and the Nasdaq Composite -25.00 points.
Others on the Fed's interest rate setting body indicated that QE3 "could" become necessary if the economy lost momentum or if inflation seemed likely to remain below the 2% target for a long time. A majority thought that sales of assets on its balance sheet would start "no earlier" than 2015 and fits with the Fed's statement after the January 24-25th meeting that it plans to hold rates at exceptionally low levels through late 2014, if the economy unfolds as now forecast. Several Fed members suggested dropping or simplifying this forward guidance now that Fed officials provide their projected path of interest rates as part of their economic projections.
At the close the Dow was down by -97.00 points to 12,781.00, S&P 500 -7.30 points to about 1343.00, S&P 100 -4.00 points to 607.00 and the Nasdaq Composite -16.00 points to about 2916.00. Oil was higher all day as tension with Iran kicked up closing up +$.75 around the $102.00 level.
The Empire State manufacturing index rose to 19.5% in February, its highest level since June 2010, the New York Fed said. This is the fourth straight large increase after the index had sunk below zero from June through October. The size of the gain in February surprised analysts as economists expected the index to rise to 15% in February from 13.5% in January. Underlying conditions were mixed as the new orders index fell to 9.7% in February from 13.7% in January. Shipments only edged slightly higher. The employment indexes were also mixed. The index for the number of employees inched down to 11.8% in February from 12.1% in January while the average workweek rose to 7.1% from 6.6% in the prior month. A reading of expected conditions in six-months retreated slightly after hitting its highest level in a year in January.
Industrial production was unchanged in January, but the increase in December was revised sharply higher, according to the Fed. The rise in production in December totaled +1% instead of the +0.4% gain originally reported. Capacity utilization, meanwhile, fell slightly to 78.5% last month, but only because of a sharp upward revision in December. The utilization rate in December was revised up to 78.6% from an initial reading of 78.1%. Economists forecast industrial production to climb +0.8% and utilization to total 78.6%. While production rose +0.7% in manufacturing, the Fed said, it declined in mining and utilities.
Tuesday, February 14, 2012 4:03 p.m. est.
Yesterday the market rallied to take back all of what it lost on Friday closing up about 3/4 of a percent. Today however saw selling first thing in the morning from poor economic data and because Moody’s downgraded a bunch of European countries and threatened to lower ratings even on the United Kingdom! The Dow saw lows of -90.00 points, S&P 500 -10.00 points and the Nasdaq -25.00 points in the final hour but with thirty minutes to go buying came back in likely expiration related to see the market close mixed.
At the close the Dow was up by +4.00 points to 12,878.00, S&P 500 -1.30 points to about 1350.00, S&P 100 -.70 points to 611.00 and the Nasdaq Composite +.44 points to about 2932.00. Oil was lower a bit lower finishing the day higher, up +$.50 around the $101.00 level.
Moody’s Investors Service made several cut debt ratings across Europe on Italy and Portugal by one notch, along with Slovakia, Slovenia and Malta. It cut outlooks on France, Britain and Austria to negative, though those countries retained their triple -A ratings for now. The downgrades reflect those countries’ “susceptibility to the growing financial and macroeconomic risks emanating from the euro-area crisis and how these risks exacerbate the affected countries’ own specific challenges,” Spain was the worst off as the firm said it was skeptical that the government of Prime Minister Mariano Rajoy will be able to reach its deficit target, owing to budget overshoots by regional governments. “The pressures on the Spanish economy, which is close to entering a renewed recession, will be further increased by the need for even stronger action to achieve a deficit reduction,” said Moody’s. The country’s unemployment rate stands at nearly 23%, the highest in the 27-nation European Union. Spain aims to cut its budget deficit to 4.4% of gross domestic product this year, down sharply from 8% in 2011.
Moody’s said there are several credit pressures that could make things worse for the balance sheets of Austria, France and Britain and their ongoing austerity programs, should problems for Europe’s economic and financial landscape deteriorate further. Moody’s said the magnitude of its ratings adjustments was limited by European authorities’ commitment to preserving monetary union and implementing whatever reforms are needed to restore market confidence. “These rating actions therefore take into account the steps taken by euro-area policy makers in agreeing to a framework to improve fiscal planning and control and measures adopted to stem the risk of contagion,” Moody’s said. Uncertainty about prospects for institutional reform in the euro area and a downbeat outlook across the region, which is hitting market confidence, was largely given as a reason for ratings and outlook changes.
Retail sales rose a seasonally adjusted +0.4% in January, mainly because of brisk business at department stores, general stores and bars and restaurants, the government reported. Retail sales minus the auto sector climbed a stronger +0.7%. Economists had forecast retail sales to rise +1% overall, or by +0.7% excluding autos. Sales for December were revised down from a +0.1% increase to "virtually unchanged. The sales increase for November was also revised down slightly. Although the annual rate of auto sales rose in January to the highest level in nearly three years, it appears that auto makers sharply discounted prices. Revenue from those sales fell to an estimated $71.7 billion in January from $72.5 billion in December, seasonally adjusted.
Import prices rose +0.3% in January, the second increase in the past three months. The rise in import prices was not as large as expected. Economists were expecting import prices to rise +0.4% in January. Import prices fell -0.1% in December after a +0.7% increase in November. Over the past year, import prices are up +7.1%. Imported fuel prices rose +1.0% in January after a -0.6% decline in the previous month. Fuel prices are up +20.8% over the past year. The price index for imports excluding fuel rose +0.1% after a +0.2% gain in December.
Business inventories rose +0.4% in December to $1.56 trillion. That was slightly weaker than the +0.5% gain economist forecast. The ratio of inventories-to-sales fell to 1.26% from 1.27%.
Friday, February 10, 2012 4:03 p.m. est.
The market sold off this morning after the EU battle started as the people of Greece decided they didn’t like the austerity plans the EU had for them. In actuality I think the market was pulling back because it was so overbought and in need of a pullback. Economic data was also terrible as it revealed how bad the deficit was. The Dow saw lows of -140.00 points, S&PP 500 -15.00 points and the Nasdaq -35.00 points even though Apple was higher once again today approaching the $500.
The market of course came back a bit in the final hour so at the close the Dow was down by +89.00 points to 12,801.00, S&P 500 -9.00 points to about 1343.00, S&P 100 -4.00 points to 607.00 and the Nasdaq Composite -23.00 points to about 2904.00. Oil of course was lower finished the day higher at the close up +$1.00 around the $100.00 level.
The trade deficit widened in December to a six-month high, as there were more imported goods. It expanded +3.7% in the final month of 2011, to $48.8 billion, the largest since June from a revised $47.1 billion in November. It was close to forecasts as economists had expected the deficit to hit $48.5 billion. For all of 2011, the deficit totaled $558 billion, up +11.6% from 2010. Exports of goods and services rose +14.5% to a record $2.1 trillion, as imports increased +13.8% to $2.7 trillion. The deficit with China hit a record $295.5 billion in 2011. The trade data won’t alter government estimates of Gross Domestic Product for the fourth quarter. Late last month, the government reported that growth in the economy as measured by the broadest gauge of goods and services accelerated to a +2.8% annual rate in the fourth quarter, with trade acting as a slight drag. Government statisticians factored in a wider December deficit in their estimate, economists said.
The preliminary February reading of the University of Michigan/Thomson Reuters gauge of consumer sentiment fell to 72.5% from 75% in January, according to Friday media reports. Economists had expected a February reading of 75.5%. The sentiment gauge, which covers how consumers view their personal finances as well as business and buying conditions, averaged about 87% in the year before the start of the most recent recession. Economists watch sentiment data to get a feel for the direction of consumer spending.
Thursday, February 9, 2012 4:03 p.m. est.
Shake your head a moment: It was reported to the House today that most, 72%, former Gitmo terrorist detainees have returned to terrorist activity!!
The market yesterday was once again pretty flat closing once again just a little higher. Today it continued creeping higher but there was more selling in the background as transports and smaller stocks have been correcting this week. Eventually this started to hurt the market with the Dow seeing lows of -30.00 points, S&PP 500 -5.00 points and the Nasdaq -10.00 points. It didn’t last too long though as Apple announced that the Ipad 3 be out in March for sure so the stock rallied pretty hard which helped tech stocks. The rally wasn’t that strong though with Dow seeing highs of +40.00 points, S&P 500 +5.00 points and the Nasdaq up +15.00 points.
At the close the Dow was up by +7.00 points to 12,890.00, S&P 500 +2.00 points to about 1352.00, S&P 100 +.72 points to 611.00 and the Nasdaq Composite +11.00 points to about 2927.00. Oil finished the day higher at the close up +$1.00 around the $100.00 level.
Jobless claims fell by -15,000 to a seasonally adjusted 358,000. Economists had estimated claims would rise to 370,000. Claims from two weeks ago were revised up by +6,000 to 373,000. The four-week average of claims dropped by -11,000 to 366,250, the lowest level since April 2008. Continuing claims increased by +64,000 to a seasonally adjusted 3.52 million. Continuing claims are reported with a one-week lag. About 7.66 million people received some kind of state or federal benefit in the week ended January 21st, up +7,982 from the prior week. Total claims are reported with a two-week lag.
Inventories at the wholesale level rose +1% in December, the second strong gain in the past three months. The increase was larger than expected. Economists had forecast an increase of about +0.4% in the month. Inventories in November were revised to show no change compared with the initial estimate of a +0.1% increase. Wholesale inventories jumped +1.2% in October. Sales of wholesalers rose +1.3% in December after a +0.5% gain in the previous month. The inventory-to-sales ratio was remained steady at 1.15 in December for the fifth straight month.
Tuesday, February 7, 2012 4:03 p.m. est.
The market was pretty flat yesterday closing almost where it started the week and today saw it start the day on the downside but it didn’t stay there. In the first hour of trading the Dow saw lows of -75.00 points, S&PP 500 -8.00 points and the Nasdaq -15.00 points. Of course as volume thinned out it turned around with the Dow seeing highs of +60.00 points, S&P 500 +5.00 points and the Nasdaq up only +10.00 points likely because the rally is getting old and the S&P is very near its heavy resistance point of 1350.
At the close the Dow was up by +33.00 points to 12,878.00, S&P 500 +3.00 points to about 1347.00, S&P 100 +1.00 points to 609.00 and the Nasdaq Composite +2.00 points to about 2904.00. Oil was lower early on but when the dollar started falling it turned higher to close up +$1.80 around the $99.00 level.
I was looking at the employment data a bit more over the weekend and the thing that was bugging me was the revisions. The unemployment rate during the Great Depression reached 25% without the BLS “adjustments” which means that if we use the same calculations they used back then, the real unemployment rate in this country is 23% right now. There are 242 million working age Americans right now and only 142 million Americans are working. This means 100 million working age Americans (41.5%) are not working. This makes it interesting that the BLS says the unemployment rate is only 8.3%! The labor force participation rate and employment to population ratio are at 30 year lows. The number of Americans supposedly not in the labor force is at an all-time record of 87.9 million. Some analysts like to say this is because the Baby Boomers are beginning to retire but the facts prove that older people have dramatically increased their participation in the labor market because they need the money! In fact the working age population since 2000 has grown by 30 million people and since then the number of people working has grown by only 4.7 million.
If you look at it by decade;
2000 to 2011 - Not in Labor Force increased by 17.9 million.
1990′s – Not in Labor Force increased by 5 million.
1980′s – Not in Labor Force increased by 1.7 million.
The Not in the Labor Force category is utilized to hide how bad the employment situation in this country really is. They conclude that 17 million out of 38 million Americans between the ages of 16 and 24 are not in the labor force. Youv’e got to be kidding! What 16 year old doesn’t want to work! It is a lie that 45% of these people don’t want a job. If you dig into their data, you realize the horrific state of employment:
74% of 16 to 19 year olds are not employed
85% of black 16 to 19 year olds are not employed
31% of black 25 to 54 year old men are not employed
40% of 20 to 24 year olds are not employed
22% of 25 to 29 year old males are not employed
22% of 50 to 54 year old males are not employed
According to the BLS, 11% of men between 25 and 54 are not in the labor force.
Friday, February 3, 2012 4:03 p.m. est.
The market took off this morning after the employment report came out better than expected on the surface. The Dow saw highs of +160.00 points, S&P 500 +20.00 points and the Nasdaq up +50.00 points early on in the morning and as the day went on and volume dried up it moved sideways right into the close on the worst volume of the year,,,,did I miss Christmas!!
At the close the Dow was up by +155.00 points to 12,861.00, S&P 500 +19.00 points to about 1345.00, S&P 100 +.50 points to 599.00 and the Nasdaq Composite +46.00 points to about 2906.00. Oil was up just a little but as the day wore on going into the weekend people started to buy as Iran was rattling its saber about what it would do if Israel ended up attacking it. It closed up +$1.20 around the $97.50 level.
The Dow, S&P 500 and Nasdaq are all testing old highs now with strong overbought conditions, lower and lower volume and sentiment getting extremely bullish. This will make next week very interesting as it wouldn’t be surprising to see some type of a pullback likely on the -2 to -3% range before the rally continues as there were a lot of people caught up in these areas so they may want to take the opportunity to get out. The other factor is that the volatility index is way to complacent considering how fast the market has moved up so far this year. Since the low at the start of October the S&P 500 has moved +25% in four months and since the start of the year +7%. Somehow I don’t think were going to have a +42% year run with so many questions out there about the future! That is unless of course we are seeing another move similar to 1987 however even if that is the case we are likely seeing a short term top.
Employment was up +243,000 jobs in January and the unemployment rate fell to 8.3%. The unadjusted rate rose to 8.8% however. Economists had forecast the +120,000 to +140,000 jobs would be added last month, with a jobless rate of 8.5%. The private sector increased payrolls by +257,000, led by large increases in manufacturing, professional services, leisure and hospitality and health care. Job gains for December and November were also revised up by a combined +60,000. This is all great news however the participation rate fell to its lowest level ever of 1.2 million leaving the workforce and this may be why we’re seeing such poor numbers for the entire year from the CBO. The unemployment rate has declined for five straight months, partly because of unemployed workers giving up the hunt for a job and people actually finding work. A broad measure of unemployment, which includes people who want to work but have stopped looking and those working only part time but who want more work, fell to 15.1% in January from 15.2% in December.
There were 1.82 million jobs created in 2011, based on newly revised tax and other data, compared to an originally reported increase of 1.64 million. Factory workers put in an average 41.9 hours of work each week, the most since January 1998, while overtime hours climbed to the highest since March 2007. Manufacturing increased by +50,000 in January, the most in a year. Average hourly earnings rose +0.2% to $23.29 and hours worked were unchanged at 34.5. Another thing to consider is that the numbers are hard to figure out because of a few reasons. According to Marketwatch.com: "the data for January usually presents problems for investors and economists. The government doesn’t do a great job accounting for seasonal hiring during the holidays, for example, and unusual weather patterns can significantly alter hiring trends up or down." The other factor is that "the government in January always unveils its annual “benchmark” revisions, which update the monthly jobs numbers over the past 21 months using more accurate data." Services activity in January reached the highest level in 11 months, according to an index released Friday that also suggests hiring is on the rise.
The Institute for Supply Management said its services index in January reached 56.8%, the highest reading since February up from 53% in December. Economists had expected a 53.5% reading. The new orders index jumped 4.8 points, and the employment index really moved up, 7.6 points to 57.4%, which served as reinforcement from the positive jobs report. The production index also accelerated, up 3.6 points to 59.5%. Readings over 50% indicate expansion. Of the 16 industries polled, 12 showed growth, including the hard-hit real estate and construction industries. “Overall business conditions [continue] to improve. We continue to outperform previous business cycles,” said one manager in the information industry. One negative came from order backlogs, which showed contraction for the seventh time in eight months, though the index did rise to 49.5% from 45.5%. Separately, the Commerce Department said factory orders rose +1.1% in December.
Thursday, February 2, 2012 4:03 p.m. est.
Yesterday the market rallied about +1% as traders were hoping for good news at the end of the week about employment but once again volume remained anemic! Today it continued higher to start the day but then selling took hold when oil continued to fall and the dollar strengthened against worries about the EU. The Dow saw highs of +30.00 points, S&P 500 +5.00 points and the Nasdaq up +25.00 points. When the sell off came the Dow saw lows of -30.00 points, S&P 500 down -4.00 points and the Nasdaq never went red but was only up +2.00 points. The market ended the day mixed as everyone awaits the job report tomorrow morning.
At the close the Dow was down by -11.00 points to 12,705.00, S&P 500 +1.45 points to about 1326.00, S&P 100 +.50 points to 599.00 and the Nasdaq Composite +11.00 points to about 2860.00. Oil was down once again closing down -$1.00 around the $96.50 level.
Though I rarely watch any documentaries from NBC as they are sooooo leftist, last night I happened on a report about a guy who reopened a furniture manufacturer in the Midwest pronouncing that his furniture was “Made in America, Again!!”. His father always told him that his company wasn’t about making furniture but the people making the furniture. Of course his son has gone through selling his earlier company to China making a bunch of money but as time went on he saw his town fall into shambles. Although near retirement he told his wife he was going to start a new furniture business and opened up his old plant making quality furniture and people liked it. What was interesting was that one of his research workers pointed out that a worker in China is only a third as productive as an American worker and that because shipping and wages are rising in China that by 2015 it won’t be cost effective to make anything in China anymore and some things such as furniture aren’t that cost effective now!!
This was very interesting and points out something I mentioned a few years ago that in time China won’t be such a deal as workers are going to demand higher wages for new toys so the next few years could be interesting. It really wouldn't take much to see this happen on a massive scale if the costs really are rising over there. Just create an incentive for companies to open plants and factories via favorable tax policy and reducing restrictions. Could be interesting!!!
This morning it was reported that Jobless Claims dropped by -12,000 to a seasonally adjusted 367,000. Economists had estimated claims would drop to 370,000. Claims from two weeks ago were revised up by +2,000 to 379,000. The four-week average of claims, meanwhile, fell a smaller -2,000 to 375,750. The monthly average smooths out seasonal quirks and provides a more accurate assessment of labor-market trends, economists say. Continuing claims fell by -130,000 to a seasonally adjusted 3.44 million. About 7.67 million people received some kind of state or federal benefit, virtually unchanged from the prior week. It was also reported this morning that January basically saw a +28% jump in job cuts so finds outplacement firm Challenger, Gray and Christmas.
Productivity rose +0.7% in the final three months of 2011, according to a preliminary reading by the Labor Department. Economists expected productivity to increase by +0.6%. The amount of goods and services produced, known as real output, grew at an annual rate of +3.6%. Hours worked rose almost as fast, up +2.9%, and hourly compensation climbed +1.9%. As a result, unit-labor costs went up +1.2% after a revised +2.1% decrease in the third quarter. Unit-labor costs had been forecast to rise +0.8%. The increase in third-quarter productivity, meanwhile, was revised down to +1.9% from +2.3%.
Yesterday it was reported that employment in the nation’s private sector is improving at a moderate pace, with two years of job gains now on the books. Nonfarm private employment rose +170,000 in January, marking the 24th consecutive month of gains, led by small businesses and the service-providing sector, according to ADP. In December, private employment rose 292,000, compared with a prior estimate of 325,000. China and the U.K. posted some better than expected manufacturing data and there are hints that a fragile looking recovery is under way.
“Other indicators suggest some firming of labor-market conditions as well, including the downward trend in unemployment claims, upturns in the components of consumer sentiment and confidence influenced by perceptions about the availability of jobs, and a rising trend in workers voluntary quitting their jobs,” said Joel Prakken, chairman of Macroeconomic Advisers, which produces the ADP report.
Non-farm private employment in January rose +95,000 at small businesses, +72,000 at medium businesses, and +3,000 at large businesses. By sector, service-provider employment rose +152,000, while goods producers added +18,000 jobs.
Wall Street economists had expected an overall private-employment gain of about +182,000. Markets look to ADP’s private-sector figures to provide some guidance on the employment figures, which include private and public payrolls. However, ADP is known for diverging from the government’s data, which indicated that private-sector employment rose but only by +212,000 in December. Economists expect employment to have risen by +125,000 in January, compared with payrolls growth of +200,000 in December and expect the unemployment rate to remain at 8.5%.
Business at manufacturers continued to expand in January at a somewhat faster pace, according to a key index. The Institute for Supply Management said its manufacturing index rose to 54.1% last month from a revised 53.1% in December. Economists had expected a reading of 54.5%. Any reading above 50% indicates expansion.
Construction spending rose +1.5% in December from November. Economists had expected an increase of +0.3%. Spending on private construction rose +2.1%, with private residential construction up +0.8%. Spending on public projects rose +0.5%. Construction spending in November was revised down to a gain of 0.4% from a prior estimate of a +1.2% increase.
Tuesday, January 31, 2012 4:03 p.m. est.
The market was looking to bounce this morning as the market rallying out of the gate with the Dow seeing highs of +70.00 points, S&P 500 +8.00 points and the Nasdaq up +20.00 points. Interestingly after some poor economic data and especially the announcement of another huge trade deficit for the year, selling took hold and the Dow saw lows of -90.00 points, S&P 500 down -8.00 points and the Nasdaq -15.00 points. Of course this was the last day of trading for the month so money managers wanted to make the books look good so it came back in the final hour.
At the close the Dow was down by -21.00 points to 12,633.00, S&P 500 -.60 points to about 1312.00, S&P 100 -.30 points to 594.00 and the Nasdaq Composite +2.00 points to about 2814.00. Oil was up over +$2.00 to start the day but fell on the poor economic data closing down -$.35 around the $98.00 level.
Hmmm, are we time warping into 1987? This morning it was reported that the U.S. budget deficit will fall to $1.08 trillion in fiscal 2012, the Congressional Budget Office said, while the country's jobless rate will average 8.9% in calendar year 2012. In its budget and economic outlook for fiscal 2012 to 2022, the CBO also projected that the economy will expand by +2.0% in calendar year 2012, ouch! In fiscal 2011 the deficit was $1.3 trillion. Although on the surface the deficit looks a bit better it also means that overall debt will now be over $16 trillion for sure by the end of the year and will cost $50 billion a week to service in interest alone. What’s really interesting about this is that in 2008 when Obama became President overall debt was $9 billion and in every campaign stop he said he would be wiping out all of this extra debt. Four years later he has almost doubled it, something no President has ever done!
House prices fell -1.3% in November, according to the S&P/Case-Shiller 20-city composite house price index. Year-on-year, prices fell -3.7%, with 13 of 20 areas seeing annual returns decrease. Atlanta prices are down -11.8% year-on-year, and Detroit and Washington D.C. were the only cities with positive returns. The peak-to-current decline for the 20-city composite is -32.9%. Overall prices are sitting at 2003 levels now.
The Chicago PMI for January fell -2% percentage points to 60.2%, the Institute for Supply Management said. Economists expected Chicago PMI to fall to 61.5% from 62.2% in December. Although it was the second straight decline, readings above 50% still indicate expansion.
A gauge of consumer confidence fell to 61.1% in January, partly reversing substantial gains in the prior two months, as views on current business conditions and employment declined, the Conference Board reported. "Recent increases in gasoline prices may have consumers feeling a little less confident this month," said Lynn Franco, director of the Conference Board's consumer research center, in a statement. In addition to worse views on current conditions, consumer expectations moved down in January, on a lower outlook for income and business conditions. The December reading for confidence was revised to 64.8% from a prior estimate of 64.5%. Economists had expected a reading of 68% on improving employment figures. Generally when the economy is growing at a good clip, confidence readings are at least 90%.
Monday, January 30, 2012 4:03 p.m. est.
We ended the week on the downside a little and today was also a bit on the downside even though it was looking as if it was going to be an ugly day today. There were more problems coming out about Greece and the EU agreeing on solutions. The market then seemed to sell even more after Philly Fed President Plosser was pounding the drum saying that rates may need to be increased before the end of the year. At one point the Dow saw lows of -140.00 points, S&P 500 down -16.00 points and the Nasdaq -40.00 points. Of course once the ignorer traders came in on another light volume day, losses were cut quite a bit.
At the close the Dow was down by -22.00 points to 12,735.00, S&P 500 -8.00 points to about 1318.00, S&P 100 -3.00 points to 596.00 and the Nasdaq Composite -13.00 points to about 2805.00. Oil was down all day even though Iran threatened to not ship oil to Europe if they continued to work on sanctions. It closed down -$.60 around the $99.00 level.
The market looks like it is topping a bit as it is so overbought which isn’t surprising as it has seen a strong January. Since 1950 this suggests that there is something to the January trading period. When the market is positive in January, then the rest of the year is positive 83% of the time, averaging additional gains of +10%. Compare that to the performance when January is negative as years from February-December returns are positive just half of the time, with an average gain of +2%. This current month is up about +3.5% so the rise is even more pronounced. When the market is up big, then the average return for the rest of the year is over 11% but if it's down big, the average advance is less than +.50%.
Of course were more interested in the shorter-term perspective so were more interested in knowing what February may look like. A positive January typically leads to a positive February so when the market closes higher in January, February goes on to average a return of only +.60%, and is positive 63% of the time. When January is negative, February is negative more than half the time, and averages a loss of more than -1%. However, an outsized return in January has not necessarily translated into a bigger return for February because if January is up more than +3.5%, like it is now, the average February gain is not as big as if January is simply positive.
This morning it was reported that wages of workers rose sharply in December while spending fell slightly. Personal income climbed +0.5% last month, while personal spending fell less than -0.1%. As a result, the personal savings rate rose to +4% from +3.5% in November. Economists had forecast income to rise by +0.4% and spending to increase by +0.1%. Adjusted for inflation, disposable income, money leftover after taxes rose +0.3% last month. Meanwhile. inflation as measured by the personal consumption expenditure price index edged up +0.1% in December. The core PCE index, which excludes food and energy, rose +0.2%. The core PCE index was expected to edge up +0.1%. For all of 2011, personal spending increased +2.2% even though real disposable income only rose +0.9%. The PCE index climbed +2.4% last year, or +1.8% on a core basis.
On Friday it was reported that the economy grew only +2.8% in the final three months of 2011, propelled by increases in consumer spending and business inventories, according to a preliminary government estimate. The increase in gross domestic product was the fastest in a year and a half however but under estimates. Economists projected GDP would rise +3%. Inventory spending surged to an estimated $56 billion after a $2 billion decline in the third quarter. Consumer spending rose +2%, compared to +1.7% in the third quarter. Government spending fell at all levels. Exports climbed +4.7% while imports rose +4.4%. Real final sales which exclude imports and inventories, rose just +0.9% after a +2.7% increase in the third quarter. Inflation as measured by the consumer PCE index rose +0.7%, but that was down sharply from a +2.3% increase in the third quarter. Excluding food and energy, the index rose +1.1% compared to +2.1% in the third quarter. Real disposable income edged up +0.8% in quarter and the personal savings rate fell to 3.7% from 3.9%.
People were more optimistic about potential improvements in the job market in January, pushing Consumer Confidence to its highest level in nearly a year. The Thomson Reuters/University of Michigan's final reading on the overall index on consumer sentiment rose to 75% from 69.9% the month before and was the highest level since February 2011. That was better than the preliminary January reading of 74% and topped the median forecast of 74.1% among economists. Employment data suggests real consumer spending will post a gain of +2.1% in 2012. Current economic conditions gained to 84.2% from 79.6%, while the gauge of consumer expectations climbed to its highest level since May 2011 at 69.1% from 63.6%. A record 31% of consumers spontaneously reported hearing about recent employment gains this month. However, respondents were not as optimistic about the unemployment rate, with half expecting it to remain unchanged. People also remained gloomy on their own financial situation, and most were skeptical about the prospective strength of the economy. Confidence in government policies was also stuck near an all-time low. The survey's one-year inflation expectation rose to 3.3% from 3.1%, while the survey's five-to-10-year inflation outlook held steady at 2.7%.
Thursday, January 26, 2012 4:03 p.m. est.
Interesting: Obama promises tallied by paper. According to Reuters, President Obama "has made over 500 promises, according to Politifact.com, a fact-checking operation run by the Tampa Bay Times. But its tally makes clear the challenges. It shows that 162 promises were kept and 56 broken. The rest were either stalled, compromised or still in the works, according to the study."
The market started the day strong yesterday after Apple reported stellar earnings making it the largest company in the world for awhile beating out Enron. After the Fed released its decision to keep interest rates the same as ever and that the economy is likely to remain flat until 2014 the market rallied a bit more into the close! Either the market didn’t believe that it would be that flat or they were just happy that it wasn’t a negative outlook! Nonetheless I don’t think it was worth an almost 1% rally for the day. Today we also saw the market start to rally with the Dow seeing +85.00 points, S&P 500 +8.00 points and the Nasdaq Composite +20.00 points. Reality seemed to set in though and the market pulled back with the Dow seeing lows of -65.00 points, S&P 500 down -13.00 points and the Nasdaq -25.00 points. The Dow held up better than the other indices as Caterpillar reported strong earnings last night.
At the close the Dow was down by -22.00 points to 12,735.00, S&P 500 -8.00 points to about 1318.00, S&P 100 -3.00 points to 596.00 and the Nasdaq Composite -13.00 points to about 2805.00. Oil held its own today closing up +$.35 around the $100.00 level.
It was reported the other day that the IMF expects the global economy to slow further. According to The Wall Street Journal: "The global economy is slowing this year, the IMF, cutting its forecasts for growth and warning of a deeper downturn if Europe doesn't take stronger action to stem its debt crisis."
At the same time, Japan reported the other day that they are running a deficit now. Because they finance everything within, this means that they are looking at a possible explosive period because if they’re interest rates which are at 1.00% and lower start going up, their debt to GDP levels will go ballistic and they could easily face a large downgrade. With them being the third largest economy in the world this could be bigger than the EU!! Something to watch!!!
At the same time yesterday the Fed decided to crack open their crystal ball and tell us where the economy will be in,,,,,,wait for it,,,,,,,,2014!!! I know your shaking your head as much as I am!!! The good news is that they said they would hold interest rates low until late 2014 obviously because they are worried that economic growth is at risk of faltering. The new commitment extends the prior statement that economic conditions were likely to keep rates at the historic low range of 0% to 0.25% until at least mid-2013. The Fed has opened a new era of transparency which is nice, releasing for the first time the projected path of rates by its 17 members and set a specific inflation goal of 2%. I think the biggest thing I get from all of this is that the Fed is scared about the future as it looks so bleak!! Fed chief himself Ben Bernanke said he continued to describe the recovery as “fragile.” He said the weak housing market was holding back growth so today’s housing report won’t help him to feel any better. Basically the Fed seems skeptical and wary of the improving economy so its interesting that the market was even up yesterday! I think most of it had to do with a new hope of a another QE3 which doesn’t sound to me like its coming!! Today seemed to see traders come back to reality so it will be interesting to see how we end the week.
Jobless claims climbed by +21,000 to a seasonally adjusted 377,000 last week. Economists estimated they would climb to 373,000. Claims from two weeks ago were revised up by +4,000 to 356,000. The average of four-week claims fell slightly, down -2,500 to 377,500. The monthly average smooths out seasonal quirks and is viewed as a more accurate gauge of labor-market trends. Continuing claims increased by +88,000 to a seasonally adjusted 3.55 million. Continuing claims are reported with a one-week lag. About 7.64 million people received some kind of state or federal benefit, down -188,612 from the prior week. Total claims are reported with a two-week lag.
Orders for Durable-goods rose +3% in December on stronger demand for civilian aircraft, machinery, and primary metals. This is the third straight monthly gain and the fourth in the past five months. Excluding transportation, orders rose +2.1%, the fourth straight gain. The increase was stronger than expected as economists expected a +2.4% rise in durables. Transportation orders had a large increase, rising +5.5%. Shipments rose +2.1% in December while orders for core durable-goods rose +2.9% in December after two straight declines.
New home sales fell unexpectedly in December with the -2.2% decrease in new-home sales to a seasonally adjusted annual rate of 307,000, well below the 325,000 pace expected by economists. For all of 2011, sales of new homes fell -6.2% to a record low 302,000. In December, the supply of new homes fell -0.1% to 157,000. The supply in relation to sales rose slightly to 6.1 months in December from 6 months in November. Median sales prices have fallen -12.8% in the past year to $210,300 and is the lowest level since October 2010.
Data suggest that the economy will improve early this year, as it reported that its index of leading economic indicators grew +0.4% in December, led by the interest-rate spread and jobless claims, compared with growth of +0.2% in November. "Looking ahead, the big question remains whether cooling conditions elsewhere will limit domestic growth or, conversely growth in the U.S. will lend some economic support to the rest of the globe," noted Ken Goldstein, a Conference Board economist, in a statement. Economists had expected a December gain of +0.9%. The LEI is a weighted gauge of 10 indicators that are designed to signal business cycle peaks and troughs. Among the 10 indicators that make up the LEI, seven made positive contributions in December. There were two negative contributors, led by consumer expectations. Building permits held steady. The report for December incorporates major revisions to the components, such as replacing the real money supply with a barometer of credit, aiming to strengthen the LEI's predictions. That’s hilarious, why use real money when in reality isn’t it who has the best credit that wins!!!
Tuesday, January 24, 2012 4:03 p.m est.
Interesting: 1 million workers have "vanished." According to Investors Business Daily: "In the 30 months since the recession officially ended, nearly 1 million people have dropped out of the labor force — they aren't working, and they aren't looking — according to data from Labor's Bureau of Labor Statistics. In the past two months, the labor force shrank by 170,000." The paper added: "This is virtually unprecedented in past economic recoveries, at least since the BLS has kept detailed records. In the past nine recoveries, the labor force had climbed an average 3.5 million by this point, according to an IBD analysis of the BLS data."
The market has been kind of quiet to start the week with a mixed market yesterday with the Dow and Nasdaq lower and the S&P 500 up less than a point. Today was basically the same except the Dow and S&P were lower and tech stocks were up a bit waiting for Apples earnings after the bell. At the open the Dow saw quick lows of -100.00 points, S&P 500 -11.00 points and the Nasdaq Composite -20.00 points but as the day wore on and we got closer to the close the Nasdaq turned higher in the final hour.
At the close the Dow was down by -33.00 points to 12,676.00, S&P 500 -1.00 points to about 1315.00, S&P 100 -1.00 points to 594.00 and the Nasdaq Composite +3.00 points to about 2787.00. Oil was down a bit today after being higher yesterday closing off -$.65 around the $99.00 level.
The market has been going straight up of late and now that we have a new expiration cycle and a new problem in the Greek debt talks, the State of the Union address tonight, the increasingly poor Republican primary season, and a Fed meeting ending tomorrow with likely no real change in their actions, the easy run the market has had is likely to end soon. As earnings season progresses and the rest of the world moves toward its own agenda, the markets could finally face some headwinds. Earnings have been okay but nothing spectacular and the word is that they are going to have to lower next quarters earnings. After Apple released its earnings tonight you wouldn’t think so however as they were sensational so we’ll likely see a nice pop to start the market tomorrow but one stock doesn't make the entire market so it will be interesting to see if t holds as the Fed meeting comes to an end midday.
Other major issues at this point are all also political. Iran is turning into a major problem in the Middle East, whether it does something or not. The key here is to understand that Iran is going to be a major thorn in the side of the West for a good while and they are not going away. The big picture is clear, when the U.S. left Iraq, the power vacuum there grew to major proportions and the issues will linger for years and Iran has let everyone know that they are right there at the center of the problems and will be for a long time.
Then there is Europe, the leaders their still don't grasp the fact that Greece, and Europe for that matter will never be able to pay back all that they owe. The markets get that, and may have to remind the leaders about it by selling off once again.
In the shorter term the big question for tomorrow is what the Fed has to say as everyone is hoping they will announce a statement that sounds like they are going to print more money. If they decide to print more money, the rally may go on, or it actually may sell off as inflation has been picking up of late. I don’t think they’re going to change a thing and that will keep everyone guessing and maybe even disappoint people. Overall there is a lot for the market to deal with and hopefully with everyone back from holidays now we may start to see some volatility once again as we go up here!
Friday, January 20, 2012 4:03 p.m est.
Not surprising the market was mixed first thing this morning as earnings were mixed from IBM, Google and microsoft overnight. With IBM and microsoft in the Dow it helped to keep the Dow higher because they’re earnings were pretty good but the S&P 500 eventually saw lows of -6.00 points and the Nasdaq Composite -15.00 points as Google had their first losing earnings quarter in 10-years so the stock was down over -10%. Of course with the low volume the market came back and closed at the highs of the day. Even though this was an expiration volume was still less than a billion shares for the day!
At the close the Dow was up by +97.00 points to 12,720.00, S&P 500 +1.00 points to about 1315.00, S&P 100 +1.00 points to 596.00 and the Nasdaq Composite -2.00 points to about 2787.00. Oil was hit hard today down -$2.50 at one point closing off -$2.00 around the $98.50 level.
The rally this week broke the record for Martin Luther King holiday traded weeks making a +2% gain and increased the weeks average from its only 29% up weeks, A person could almost say this is a bull market however I have a hard time saying that with the volume were seeing. It is an election year but these tend to only see average gains overall and so far its looking like Obama may get another 4-years and it won’t really have any effect on the market likely till June. This reminds me more of 1987 when the market rallied for no real reason at the start of the year and then ended up crashing. I’m not saying were going to crash but just as the trade deficit back then had a huge effect on the market, that $16 trillion debt level with the threat of more downgrades is, and that could affect the market. In my view I think volatility is going to kick in again very soon in a new trading range as the market figures things out which will be great for our trading style!
There was a report out this week revealing that the public is basically stuffing their mattress’s instead of investing money now. This is apparent in my view as volume has just continued to go down and down with it about 2/3rds less than what it was in 2005. Over the first 11 months of 2011, regular savings and checking accounts attracted eight times the money as stock and bond mutual and exchange-traded funds, according to data from market research firm TrimTabs. The pace accelerated to nearly 13 times from September to November, the most recent month for which data is available. The reason is obvious as people deal with factors as ominous as the European debt crisis and frustrating Washington gridlock, so people have decided that the world looks best from the sidelines, despite historic efforts from the Fed to entice risk-taking. I can see myself as my hairdresser who has cut my hair, or what I have left haha, for 17-years and she was a strong investor all the way up to 2005. Since then she has slowly gotten more and more upset about her funds performance. This year she said she has had enough of her financial person changing her accounts around making him great commissions and her nothing so she sold everything and put it against her mortgage.
"The real money these days is going straight under the mattress," said TrimTabs CEO Charles Biderman. "The Fed is doing almost everything in its power to entice investors to speculate in overpriced asset markets. Yet investors, particularly on the retail side — are mostly refusing to take the bait.” “From January to November, $889 billion poured into savings and checking, while stock and bond funds drew just $109 billion. More money went into bank accounts even at times when the market rallied. Most recently, investors took $9.35 billion out of equity funds — including more than $7 billion of U.S-based funds, for the week ended January 4th. Stock-based funds haven't had a winning month since April of 2011, and cash in money market funds is just over $2.7 trillion, the highest level since June 22nd, according to the Investment Company Institute, which tracks fund flows for the government.
Biderman attributes the reluctance of retail investors to commit money to three reasons. There has been an increase in baby-boomer retirees who are becoming more risk-averse in their later years. The economy is getting better however very slowly and finally, worries that the Fed is running out of ammunition to stimulate the economy. At the same time Reuters is reporting that people are rapidly depleting their savings. According to Reuters: "In an ominous sign for America's economic growth prospects, workers are paring back contributions to college funds and growing numbers are borrowing from their retirement accounts." There is the possibility "that a recent spike in credit card usage could mean that people, many of whom are struggling on incomes that have lagged inflation, are taking out new debt just to meet the costs of day-to-day living." The Fed has even said that it thinks that Americans are spending "in a way that did not seem in line with income growth," so this may be why why there is lack of interest in investing, because the number one priority is making ends meet.
And the news gets worse. According to Reuters: "After a few years of relative frugality, the amount of money that Americans are saving has fallen back to its lowest level since December 2007 when the recession began. The personal saving rate dipped in November to 3.5%, down from 5.1% a year earlier, according to the U.S. Commerce Department." Reuters added: "Loans taken from retirement savings accounts jumped +20% last year across all demographics, according to a survey to be published in March. Among lower earners they leapt by as much as +60%, the vast majority of borrowers, she said, need the money for essential expenses like bills, car repairs and college tuition." This could all come to a head this year so is something to watch closely...
The National Association of Realtors said December sales rose +5% to a seasonally adjusted annual rate of 4.61 million. November sales were revised down to 4.39 million from an initially reported 4.42 million. Economists had expected sales at a 4.7 million clip in December. For all of 2011, sales edged up +1.7% to 4.26 million - compared to the 2005 peak of 7.08 million. Median sales prices in December fell -2.5% from the same period of 2010 to $164,500, and for the year, median prices were $166,100, down -3.9% and back to 2002 levels. Inventories fell -9.2% to 2.38 million, which represents 6.2 months of supply. The months of supply of inventory were the lowest inventory since April 2006, though inventory levels are generally low in the winter.
Thursday, January 19, 2012 4:03 p.m est.
Interesting News: The worlds largest emerald was reported by CNBC to be worth about $1.1 million will be sold next week in Canada. In fact the watermelon sized gem is going to be sold in my hometown strangely in a little back street pawn shop!
The market once again started the day higher with the Dow seeing highs of +45.00 points, S&P 500 +8.00 points and the Nasdaq Composite +25.00 points. It was looking as if it was going to turn negative when the Dow turned slightly negative but it came back. The final hour saw another push at profit taking but the market held up I believe because everyone was gone as volume was anemic. Tomorrow is expiration and it could be interesting as the market is very overbought in the shortest of time and the S&P 500 is right around the 1300 benchmark level where there are a lot of options for sale so that level could attract traders. The market has been strong this expiration cycle not seen since 1987 which kind of makes you shake your head considering all of the headwinds the market is dealing with. I think the incredibly low volume is actually been the savior for this move, up +4.5 so far in this month alone but isn't healthy so it will be interesting to see if we see some volatility tomorrow as we end the week and the coming couple of weeks.
At the close the Dow was up by +45.00 points to 12,624.00, S&P 500 +6.00 points to about 1314.00, S&P 100 +2.00 points to 595.00 and the Nasdaq Composite +19.00 points to about 2788.00. Oil closed down -$.20 around the $100.50 level.
Jobless claims fell by -52,000 last week to 352,000, the lowest level since April 2008 but claims from two weeks ago were revised up to 402,000 from 399,000. Economists had projected claims would fall to a seasonally adjusted 375,000. The average of new claims over the past four weeks, meanwhile, dropped by a much smaller -3,500 to 379,000. The monthly average is viewed as more accurate because it reduces volatility in the week-to-week data, which is especially pronounced in January after the end of the holiday season. Continuing claims fell by -215,000 to a seasonally adjusted 3.43 million. Continuing claims are reported with a one-week lag. About 7.83 million people received some kind of state or federal benefits from the prior week. Total claims are reported with a two-week lag.
New construction of Homes fell in December after a strong gain in the previous month, with starts falling -4.1% in December to a seasonally adjusted 657,000, weaker than the 695,000 pace expected by economists. Starts had jumped +9.1% in November to 685,000. The decrease in December was due to a drop in the volatile multi-family component. For all of 2011, housing starts rose +3.4% to an annual pace of 606,900, up from 586,900 in 2010. Single-family starts hit a record low 428,600 in 2011.
Consumer prices were unchanged in December while core prices rose a seasonally adjusted +0.1%. The core data strips out volatile food and energy costs. Economists had forecast a +0.1% increase in the CPI, with a +0.2% rise in the core rate. Consumer prices have risen an unadjusted +3% over the past 12 months, but that's down from +3.9% in June. The core rate has risen +2.2% over the past 12 months. Inflation-adjusted hourly wages, on average, rose +0.2% in December.
Wednesday, January 18, 2012 4:03 p.m est.
Interesting: China home prices fall. According to Bloomberg.com: "China’s December home prices posted their worst performance last year, with only two of the 70 cities tracked posting gains, as the government reiterated its plans to maintain housing curbs. Prices in 52 of 70 cities monitored by the government declined from the previous month, the National Statistics Bureau said in a statement on its website today. New home prices in the nation’s four major cities of Shanghai, Beijing, Shenzhen and Guangzhou declined for a third month, it said."
This isn’t good; The World Bank cut it's Global Growth Outlook, again.
The Washington-based institution said the world economy this year will grow 2.5%, down from a June estimate of 3.6%, down -25%. The World Bank sees the euro area contracting -0.3% in 2012, compared with a previous estimate of +1.8% growth, down -20%. The U.S. outlook was cut to an expansion of +2.2% from +2.9%. “Even achieving these much weaker outturns is very uncertain,” the World Bank said in its Global Economic Prospects report saying that a recession in the euro region threatens to exacerbate a slowdown in emerging markets such as India and Mexico.
Interesting stat out today; The Baltic Dry index, which measures the cost of shipping dry goods around the world, has crashed by -55% since October 14th. It was down for much of 2009 and 2010, including a -63% drop in the early summer of 2009, without indicating an economic collapse but is something to watch.
The market started the day flat with a little downside but as the day wore on and traders chose to deny news such as Germany being downgraded, Iran rattling its chains again and average economic data the Dow saw highs of +100.00 points, S&P 500 +15.00 points and the Nasdaq Composite +45.00 points once again on guess what,,, pathetic volume!! Interestingly oil was down on the day even though Iran was acting up and President Obama was going to announce that the keystone pipeline deal from Canada was dead! Environmentalists were happy about this of course because a possible disaster has been diverted! I mean really,,,,,these people are idiots. So instead you have to ship that oil by truck all the way down or get it from Middle East ships which I’m pretty confident don’t have slave rowers anymore so their carbon foot print is enormous! What ever happened to looking at things rationally.....
At the close the Dow was up by +97.00 points to 12,579.00, S&P 500 +14.00 points to about 1308.00, S&P 100 +6.00 points to 593.00 and the Nasdaq Composite +42.00 points to about 2770.00. Oil was lower all day closing the day down -$.30 around the $100.50 level.
Wholesale prices fell in December for the second time in three months, as the cost of gas and food fell. The producer price index dropped a seasonally adjusted -0.1% last month. Economists had forecast a +0.1% increase. The decline in wholesale prices stemmed entirely from lower energy and food costs. Energy fell -0.8%, mainly because of lower prices at the gas pump. Food costs also dropped -0.8%. The decline was mostly the result of an -11.1% decrease in the price of vegetables. Yet core wholesale prices, which strip out the volatile food and energy categories, jumped an unexpectedly high +0.3%. Economists were expecting a +0.1% increase. he government attributed one-third of the increase in the core rate to rising prices for light trucks. Higher cigarette and pharmaceutical prices also contributed. The core index is viewed by the Fed as a more accurate gauge of inflationary pressure because who really needs food and energy prices anyhow!! Core prices have climbed +3.0% over the past 12 months, the largest one-year increase since the summer of 2009. Higher inflation could limit the central bank’s ability to try to further stoke the economy. Overall wholesale prices have risen an even faster +4.8% in the past 12 months.
The output of the nation's factories, mines and utilities rebounded in December after struggling in November, the Fed said. Industrial output rose +0.4% in December, in line with expectations. Output fell a revised -0.3% in November, slightly worse than the previous estimate of a -0.2% decline. Despite the month-to-moth volatility, output rose at +3.1% annual rate in the fourth quarter. Factory activity alone rose +0.9% in December after a -0.4 decrease in November. Capacity utilization, a gauge of slack in the economy rose to 78.1% in December from 77.8% in November.
A measure of builder confidence in the market for newly built single-family homes climbed in January to the highest level since June 2007, according to the National Association of Home Builders/Wells Fargo housing market index. The gauge rose 4 points to 25%, the fourth consecutive rise. Economists had expected only a 1-point improvement to 22%. NAHB Chief Economist David Crowe attributed the gains to improvements in employment and consumer confidence. The seasonally adjusted index, which correlates closely with single-family housing starts, is designed so that readings over 50% are considered "good," which hasn't been the case since April 2006.
Tuesday, January 17, 2012 4:03 p.m est.
The market took off this morning for no real reason except to go up especially because volume was one of the lowest days of the year, even though its only a couple of weeks old! The Dow saw highs of +150.00 points, S&P 500 +14.00 points and the Nasdaq Composite +35.00 points but as volume dwindled so did the market and the final hour almost saw the market go negative but it came back a bit to close with decent gains.
At the close the Dow was up by +60.00 points to 12,482.00, S&P 500 +5.00 points to about 1294.00, S&P 100 +2.00 points to 586.00 and the Nasdaq Composite +17.00 points to about 2728.00. Oil was higher all day closing the day up +$2.00 around the $101.00 level.
The market remains in an overbought condition and sentiment is extremely bullish so a pullback this expiration traded week wouldn’t be surprising. The market has had a strong start this January and one of the strongest ever. It is actually matching what happened in 1987 and you know how that year turned out!!! This is also a shortened trading week as it was a long weekend and I found some interesting data that has a strong bias to it!! Looking at what the market does for the week following the Martin Luther King day holiday it is quite interesting. Historically, this has been a brutal week for the market, with the market averaging a loss of a little more than -1%, and ending higher only 29% of the time. Since 1998 there have been only four times this week was up and three of them saw paltry gains of only +.50% for the week. Only one time was it up +1.82% and that was in 2001. What’s interesting is that the first day of trading has usually been higher and then the market turns down so it will be interesting to see how this week turns out...
The Empire State manufacturing index rose in January to its highest level since April, the New York Fed said. The Empire state index rose to 13.5% in January from a revised 8.2% in December. This is the third straight large increase after the index had below zero from June through October. The size of the gain in January surprised analysts as they expected the index to rise to 11.3% in January. Underlying conditions were mainly strong as the new orders index rose to 13.7% in January from 6% in December. The employment indexes both increased. The index for the number of employees rose to 12.1% in January from 2.3% in December while the average workweek rose to 6.6% from negative -2.3% in the prior month. A reading of expected conditions six-months ahead climbed sharply in January to 54.9%, its highest reading in a year.
Friday, January 13, 2012 4:03 p.m est.
The market sold off strongly this morning after economic data wasn’t very good, JP Morgan’s earnings were worse than expected and S&P reported that it was going to downgrade most of the EU countries. Several euro zone countries face an “imminent” downgrade by ratings agency S&P, Reuters and Dow Jones news agencies reported in the morning. A spokesperson for S&P in Paris declined to comment on the reports.
The Dow saw lows of -170.00 points, S&P 500 -18.00 points and the Nasdaq Composite -40.00 points early on but as the day went by losses were cut more than in half because no one was around to trade as we are going into a long weekend due to the Martin Luther King day on Monday. The sad part of it was that one of the reasons the market came back was because traders actually liked the idea that some of the countries may only see small cuts and that Germany was going to be excluded. Unfortunately the selling may not be over as volume was actually worse than pathetic considering how serious the news out today was so next week could be interesting. Another news story ignored by the media was that President Obama put in another request to the Senate to raise the debt limit another $1.2 billion so by the election in November it will be well over $16 billion and about 120% of GDP.
At the close the Dow was down by -49.00 points to 12,422.00, S&P 500 -6.00 points to about 1289.00, S&P 100 -3.00 points to 584.00 and the Nasdaq Composite -14.00 points to about 2711.00. Oil was sharply lower early on but came back by its close to finish the day only down -$.40 around the $99.00 level.
After falling for four straight months, the trade deficit widened in November, bringing the trade gap up to its highest level since June. The nation’s trade deficit widened +10.4% in November to $47.8 billion. This is the largest increase since May. Exports fell -0.9% to $177.8 billion in November, the second straight drop after hitting a record high in September. Imports rose +1.3% to $189.7 billion in November. Imports have been treading water after hitting $226.2 billion in May. Analysts expected a deficit of $43.6 billion. The sharp increase in the deficit could cut the government’s estimate of fourth-quarter growth. A higher deficit subtracts from growth because Americans are buying more foreign goods. Economists now estimate that the economy grew at a +3.2% annual rate in the fourth quarter, up from a +1.8% growth rate in the third quarter. The government will release its first estimate of fourth-quarter growth later this month. Some economists argue that the trade gap is the most significant barrier to job creation in the economy. Every dollar that goes abroad to purchase oil or Chinese consumer goods, and does not return to purchase U.S. exports, is lost domestic demand that could be creating jobs. The U.S. trade deficit in goods with China reached $26.9 billion in November compared with $25.1 billion in the same month last year. The trade gap with China is set to hit a new record high in 2011. The U.S. exported $9.9 billion of goods to China in November, the highest level since December 2010. An increase in foreign oil imports was a big driver in the increase in imports in November. The value of U.S. crude oil imports rose to $27.3 billion in November from $26.0 billion in October as the average price of a barrel of oil rose to $102.50 from $98.84 in the previous month. This is the first increase in the price of oil in six months. Import prices meanwhile fell -0.1% in December, the fourth fall in five months. Economists had expected a +0.2% gain. November prices were revised to show a +0.8% gain from an initially reported +0.7% advance. Excluding fuel and food, prices rose +0.1% in December. For all of 2011, import prices rose +5.3%, the third year in a row they have increased.
Consumer sentiment was reported this morning and it was at its highest level since May, with both current and future economic conditions seen as improving, according to data released Friday by the University of Michigan and Thomson Reuters. The consumer-sentiment index reached 74.2% in the preliminary reading for January, the highest level since May, compared with 69.9% in December. Economists had expected a January reading of 73% on higher stock prices and improving jobs conditions. The sentiment gauge, which covers how consumers view their personal finances as well as business and buying conditions, averaged about 87% in the year before the start of the most recent recession. Economists watch sentiment data to get a feel for the direction of consumer spending. According to the data from Reuters, a gauge measuring consumers’ views on the current economy rose to 82.6% in January from 79.6% in December. Meanwhile, a barometer for their economic expectations rose to 68.4% from 63.6%.
Thursday, January 12, 2012 4:00 p.m est.
Interesting: It appears those super agent movies may be real after all!! In a Iran there was a scientist assassinated which makes thing interesting for the Middle East. According to The Wall Street Journal: "An Iranian scientist working for a key nuclear site was killed in Tehran with a magnetic bomb attached to his car, in what the government said was a plot by the U.S. and Israel."
Also interesting: According to Investors Business Daily: "Americans are feeling better about the economy, but they aren’t giving President Obama credit as he seeks re-election, according to the latest IBD/TIPP survey. The Economic Optimism Index shot up 11% in January to 47.5, still below the neutral 50 level but the fifth straight monthly gain and the best reading since February 2011." The repor added: "Meanwhile, the Presidential Leadership Index fell 3.3% to 46.7, little changed over the last several months despite less gloomy views on the economy. Most ominously for Obama, the president’s leadership rating fell 9.7% among independents to 41.7. They disapproved of his job performance by 52%-39% in January vs. 46%-44% in December."
Yesterday the market was flat once again and closed slightly mixed with little change. Today it was looking like the market was going to be strong as the Dow saw highs of +40.00 points, S&P 500 +5.00 points and the Nasdaq Composite +10.00 points but after traders decided to think about the poor economic data out it started to sell off with the Dow seeing lows of -70.00 points, S&P 500 -7.00 points and the Nasdaq Composite -15.00 points. Of course volume remained low so the market came back on hopes that banking earnings due out tomorrow morning would be good. At the close the Dow was up by +22.00 points to 12,471.00, S&P 500 +3.00 points to about 1296.00, S&P 100 +1.00 points to 587.00 and the Nasdaq Composite +14.00 points to about 2725.00. Oil was higher on the day but when the EU announced that it was postponing its decision on sanctions against Iran it sold off strongly closing down -$2.00 around the $99.00 level.
Retail sales increased only +0.1% in December to a seasonally adjusted $400.6 billion. Sales rose an upwardly revised +0.4% in November. Details of the December report were mixed. Economists expected total sales to rise +0.3%. Excluding the +1.5% rise in motor vehicle sales, retail sales fell -0.2%. Economists had expected ex-auto sales to rise +0.3%. Core sales, excluding autos, gasoline and building materials, fell -0.2% after a +0.3% gain in November. This is the first drop in core sales since last December.
Jobless claims rose by +24,000 last week to a seasonally adjusted 399,000 and claims from two weeks ago were revised up to 375,000 from 372,000. Economists had projected claims would rise to 380,000. The average of new claims over the past four weeks, meanwhile, increased by +7,750 to 381,750 and continuing claims rose by +19,000 to a seasonally adjusted 3.63 million. About 7.33 million people received some kind of state or federal benefit in the week ended December 24th, up +111,010 from the prior week. Total claims are reported with a two-week lag.
Yesterday it was reported from the Fed that Economic conditions improved as 2011 drew to a close, according to the Fed’s latest survey of economic conditions. The so-called Beige Book survey of business contacts in the Fed’s 12 districts said economic activity increased “at a modest to moderate pace.” This rate is an improvement from the mid-November report which said some districts were growing at a “slow” pace. “Compared with prior summaries, the reports on balance suggest ongoing improvement in economic conditions in recent months, with most districts highlighting more favorable conditions than identified in reports from late spring through early fall,” the report said. The latest Fed report said holiday retail sales were up “noticeably” over last year. The auto sector was so vibrant that some suppliers reportedly were nearing capacity constraints. The non-financial service sector, seen as key to the outlook by many economists, reported stronger demand. Price pressures were described as “quite limited.” Real estate activity was seen as steady at very low levels. The only good news were reports of further gains in apartment construction. Bank lending activity was reported to have edged up, mostly due to business demand. Wage pressures were also seen as modest given the low level of hiring. The report was based on information collected from late November through December 30th.
Tuesday, January 10, 2012 4:03 p.m est.
Interesting: According to The Wall Street Journal: "U.S. consumer borrowing rose by the most in a decade during November, surging 10% with Americans pulling out their credit cards as the holiday shopping season got rolling. The level of consumer credit outstanding increased by $20.37 billion to $2.478 trillion, the Federal Reserve said Monday."
I never reported yesterday as the market was mostly flat and the fact that I appear to have contracted the flu virus! Today the market started the day higher for no real reason than the fact that Asia and the EU were higher. The Dow saw highs of +140.00 points, S&P 500 +16.00 points and the Nasdaq Composite +40.00 points. Volume however has fallen to incredibly low levels so it wasn’t surprising that the final hour saw the market pull back. At the close the Dow was up by +70.00 points to 12,463.00, S&P 500 +11.00 points to about 1292.00, S&P 100 +4.00 points to 586.00 and the Nasdaq Composite +26.00 points to about 2703.00. Oil was higher today closing up +$1.00 around the $102.00 level.
Speaking of low volume, according to multiple reports, individual investors have pulled billions out of the market in the last nine weeks and buying municipal bonds. CNBC has reported: "U.S. (equity mutual) funds—not including ETFs —lost $1.1 billion in the week ended Wednesday, according to data from Lipper FMI. This follows a $1.7 billion outflow in the previous week. Investors put money into taxable and municipal bond funds instead, the data showed."
This is interesting as companies have been making money the past couple of years and instead buying taxable and tax-free municipal bonds, which yield next to nothing, and which may be backed by receipts which may never materialize as municipalities continue to struggle to make ends meet. Treasury bonds are backed by the government, whose debt levels are now reportedly as large as the entire economy which should also make one think. This could mean we are getting closer to a bottom in the market but I think that won’t come until the EU problems and American debt is dealt with concisely.
Friday, January 6, 2012 4:03 p.m est.
Interesting: For Americans, the climb out of the bottom is increasingly difficult. According to The New York Times: "researchers have reached a conclusion that turns conventional wisdom on its head: Americans enjoy less economic mobility than their peers in Canada and much of Western Europe. The mobility gap has been widely discussed in academic circles, but a sour season of mass unemployment and street protests has moved the discussion toward center stage."
Even though the employment report this morning was positive the market still opened lower as futures sold off strongly at the close yesterday on EU worries. The Dow saw lows of -80.00 points, S&P 500 -8.00 points and the Nasdaq Composite -15.00 points. Tech stocks helped to lead the market once again though as Apple was strong with the Dow seeing highs of +5.00 points, S&P 500 +1.00 points and the Nasdaq Composite +15.00 points. The final hour saw it become mixed so at the close the Dow was down by -55.00 points to 12,360.00, S&P 500 -3.00 points to about 1278.00, S&P 100 -2.00 points to 581.00 and the Nasdaq Composite +4.00 points to about 2674.00. Oil was lower all day closing down -$.25 around the $101.00 level.
As European worries will be a harbinger for the market for awhile, another thing that will start to effect the market is the Presidential Cycle. Traditionally, the first two years are flat to lower, while the third year is the best of all years. Year four, which has just started tends to have an upward bias. Unfortunately this cycle has been way off the mark. The first year, 2009, had a rally, after 2008's crash but that wasn’t surprising considering how far the market had fallen. 2010, was more like the norm, while 2011 which should have seen the biggest rally was mostly flat, again away from the tradition. That leaves us with 2012, which is supposed to be a fairly good year. So far it has seen a bit of a rally but really,, its only been one week! Since 1945, a positive January in an election year has never missed in predicting a full-year gain for the market. This indicator is perfect, going 8 for 8 and posting an average gain of +16%. However, if January is negative, the rest of the year has delivered a full-year loss 56% of the time, with an average -3.9% decline. Interestingly, when the market is up from July 31st through Oct. 31st, the incumbent or his party wins, and when it's down the other side wins. So, if you're Mr. Obama, your hoping traders wait to rally the market until summer and then till halloween.
The economy added +200,000 jobs in December and the unemployment rate fell for the fourth month in a row. This is the fourth biggest gain of 2011 and suggests that the economy is expanding but the numbers may be suggesting something that isn’t there. The government constantly lowers the labor force participation rate as more and more people "drop out" of the labor force for one reason or another. This doesn’t make sense when one also considers the overall rise in the general civilian non institutional population. There is also an indication that the people who are finally running out of jobless benefits are going out and getting anything they can. Anyhow, more hiring puts more money in the hands of consumers and usually leads to an increase in spending. That’s a big deal since consumer spending accounts for as much as 71% of economic growth.
The unemployment rate edged down to 8.5% from an upwardly revised 8.7% in November. Economists were expecting to add +150,000 jobs and the jobless rate was forecast to rise to 8.7% from an initially reported 8.6% in November. Yet improved job growth in the second half of 2011 still falls well short of what’s necessary to get the economy fully back on track. The economy needs to add at least +250,000 jobs a month for several years to reduce the jobless rate to pre-recession levels and increase annual growth well above +3%, a level usually associated with a healthy recovery. The economy has expanded sluggishly since the end of the 2007-2009 recession, mainly because of weak hiring. Businesses do not want to add workers unless they are assured of higher demand for their goods and services.
Employment for November and October, meanwhile, were little changed as the government now says +100,000 jobs were created in November instead of a prior figure of +120,000 but the number of jobs created in October was revised up to +112,000 from 100,000. Wages and hours worked, meanwhile, rose slightly as hourly earnings were up +0.2% to $23.24; hours worked rose 0.1 hour to 34.4. An alternative measure of unemployment, the so-called U6 rate, fell to 15.2% in December from 15.6% in November. That rate includes part-time workers and those who recently stopped looking for work. The economy added 1.64 million jobs in 2011, compared to an increase of 940,000 in 2010. The private sector created 1.9 million jobs last year. The U.S still has about 5.8 million fewer jobs now compared to end of 2007. In 2009 alone, the economy lost 5.1 million jobs.
All the new jobs were added in the private sector: +212,000 overall. Government lost -12,000 jobs to continue a nearly two-year trend of shrinking their bureaucracies to balance their budgets. The increase in jobs, however, was heavily concentrated in sectors that do a lot of seasonal hiring. The transportation and warehouse sector, for instance, hired +50,000 workers last month to lead the way, but +42,000 of those positions were for couriers and messengers. In addition, the retail industry filled +28,000 positions. Other sectors that increased hiring included manufacturing, mining, health care and the leisure and hospitality trade.
Thursday, January 5, 2012 4:03 p.m. est.
The market sold off today as the European Union worries are slowly creeping back in with the Dow down -120.00 points, S&P 500 -12.00 points and the Nasdaq Composite -20.00 points but as volume was low the market turned around and the Dow saw highs of +20.00 points, S&P 500 +6.00 points and the Nasdaq Composite +25.00 points. The final hour saw it become mixed as traders started to get nervous about the jobs report due out tomorrow morning.
At the close the Dow was down by -3.00 points to 12,416.00, S&P 500 +4.00 points to about 1281.00, S&P 100 +1.00 points to 582.00 and the Nasdaq Composite +22.00 points to about 2670.00. Oil was lower all day closing down -$1.50 around the $102.00 level.
Jobless Claims fell by -15,000 last week to 372,000. Claims from two weeks ago were revised up to 387,000 from 381,000. Economists had projected claims would drop to a seasonally adjusted 373,000. The average of new claims over the past four weeks, meanwhile, declined by -3,250 to 373,250, the lowest level since June 2008. Also, continuing claims fell by -22,000 to a seasonally adjusted 3.6 million. Continuing claims are reported with a one-week lag. About 7.22 million people received some kind of state or federal benefits, down -8,311 from the prior week. Total claims are reported with a two-week lag.
Private-sector payrolls increased +325,000 in December, led by the service-providing sector and small businesses, according to the ADP employment report. The November level was revised to 204,000 from a prior estimate of 206,000. Markets look to ADP's report on private-sector payrolls to provide some guidance on the employment report which will be released tomorrow morning and includes information on both private- and public-sector payrolls. However, analysts have noted seasonal-adjustment issues that have led to past ADP estimates for December substantially missing the government's data. Economists expect the report to see strengthening employment, with overall employment up +150,000 in December, compared with +120,000 in November. Economists also expect the unemployment rate to rise to 8.7% from 8.6%.
Planned job cuts announced by employers declined in December to 41,785, the lowest monthly total since June, according to outplacement firm Challenger, Gray & Christmas. The figure was down -1.6% from November but up +31% from December 2010. For all of 2011, job cuts rose +14% to 606,082. The recession peak was in 2009 with 1.29 million.
The Institute for Supply Management's services index rose to a reading of 52.6% from November's 52%, a reading that nonetheless was below the 53.3% forecast. Of key subcomponents, production stayed at 56.2%, new orders edged up +0.2 points to 53.2% and employment rose +0.5 points to 49.4%. Any reading over 50% indicates expansion, and the services gauge has shown growth for 25 straight months.
Tuesday, January 3, 2012 4:03 p.m. est.
Happy New to one all!!! The market continued its schizophrenic ways in the New Year rocketing out of the gate this morning by +2% with the Dow up +270.00 points, S&P 500 +27.00 points and the Nasdaq Composite +60.00 points. I guess everything is good in the world now!! Gains were cut in half midday however and by the close the market was well off of highs.
At the close the Dow was up by +180.00 points to 12,397.00, S&P 500 +19.00 points to about 1277.00, S&P 100 +10.00 points to 581.00 and the Nasdaq Composite +44.00 points to about 2649.00. Oil rallied hard as there was no news out closing up $4.00 around the $103.00 level.
I read an interesting article over the weekend about the problems the economy is facing and because of the huge load were looking at that no matter what happens it may not be able to be saved. This will likely keep the market flat for another year or at least till the election which will be great for us! With the way the market ended the year compared to what it did today it makes one think the market still has a lot of problems to deal with and is really no place for your basic investor. Basically, America is in a catch 22 situation. It needs the economy to improve in order to generate jobs, but the economy can only improve if people have jobs. They need the economy to recover in order to improve our deficit situation, but if the economy really recovers long term interest rates will increase, further depressing the housing market and increasing the interest expense burden for the U.S, therefore increasing the deficit. A recovering economy would result in more production and consumption, which would result in more oil consumption driving the price well above $100 per barrel, therefore again depressing the economy.
Another year going by means that more people have to save for their retirements. Right now there are 10,000 Baby Boomers turning 65 every day!! If the savings rate goes back to 10% like the old days, the economy will collapse due to lack of consumption. Consumer spending accounts for 71% of GDP, but a reduction in consumer spending will push the country back into recession, reducing tax revenues and increasing deficits so you can see why catch 22 will be the theme for 2012.
Speaking of debt and real GDP, if we talk about the debt load, the payroll tax cut, extension of unemployment benefits and Bernanke’s gift to banks, it did nothing to help people in the real world. The government manipulated GDP has languished between +0.4% and +1.8% in the first three quarters of 2011 but if you go by a true measure of inflation, GDP has remained at a recessionary level of -2% to -3%. Bernanke did accomplish his goal of pumping up the stock market with his QE2 gift during the first six months of 2011, with the S&P 500 peaking at 1364, +8% in late April. Interestingly, the market began to fall the second he stopped QE2 with the market dropping -18% in three months. It did come back to break even for the year after he promised to keep interest rates at zero forever and the hope of QE3 though. Then there is housing where the effort to not complete foreclosures did nothing to slow the continued fall in home prices. After the recalculations of lower sales you see that real home prices will have fallen another -5% in 2011. Obama threw $50 billion of your tax dollars at the housing market in 2009 – 2010 with tax credits, loan modification programs, home builder tax loss carry-backs, and a bunch of other solutions and overall prices had still fallen another -12% in the last 18 months. Overall, prices have fallen -42% nationally since 2006. There has never been a decline in house prices on a nationwide basis like this. Don’t forget what Ben Bernanke said in July 2005; “what is more likely is that house prices will slow, maybe stabilize, might slow consumption spending a bit.”
There are approximately 48.5 million homes with mortgages in America and 10.7 million of them have negative equity. Another 2.4 million have less than +5% equity. Considering it costs more than 5% in closing costs to sell a house that means 27% of home occupiers with a mortgage are still trapped. With 2.2 million foreclosures still in the pipeline and a looming recession, home prices will likely continue to fall another -10% to -20% over the next two years and one third of all home occupiers will be underwater.
Then you have the question of the $1.4 trillion of bad mortgage backed securities on The Fed’s balance sheet now worth less than $700 billion. How will they unload this? The Treasuries they have bought will drop in value if interest rates rise. Quantitative easing’s Catch 22 is that it can never be unwound without destroying the Fed and the economy. The Fed was able to expand his balance sheet from $2.47 trillion to $2.95 trillion in twelve short months. According to the Fed, increasing your balance sheet by $480 billion isn’t really printing money out of thin air however, they are now leveraged 57 to 1. This is commonplace in Europe so maybe he should move there. In comparison, Lehman Brothers and Bear Stearns were leveraged 40 to 1 when they went bankrupt.
Speaking of Europe, the complete implosion of Europe and the ensuing weakness of the Euro have also given the false impression that the U.S. dollar is a safe haven. This will likely continue at least for the first half of this year. The dollar has regained its losses. With annual deficits equaling 10% of GDP, a national debt now exceeding 100% of GDP, and Ben Bernanke in perpetual printing mode, the dollar won’t be able to stay higher for ever. With crude still above $100 a barrel, employment still weak, and double digit food and energy inflation slowing consumer spending, Europe knows a recession during 2012 is highly likely because you have the imminent collapse of the European Union. Greece, Ireland, Portugal and Spain are effectively bankrupt and still sitting out there. Spain is the size of the other three countries combined and has a 20% unemployment rate. You can also tell that the Germans are losing patience with these spendthrift countries as debt does matter. The EU has made The Fed look like a lightweight by increasing their balance sheet by 44% to over $3.5 trillion in a futile effort to solve a debt crisis with more debt. It seems central bankers are programmed to print until the very end. It will be interesting to see if the European Union will survive 2012. Too many countries, too much government debt, too many fake banks, too many bureaucrats, too much austerity rammed down the throats of citizens, and not enough honesty or reality based solutions.
Speaking of that, over here State and local governments were able to put off hard choices for another year, as Washington DC handed out hundreds of billions of dollars. California will have a $19 billion budget deficit; Illinois will have a $17 billion budget deficit; New Jersey will have a $10.5 billion budget deficit; New York will have a $9 billion budget deficit. Don’t forget that the Congress that is now filled with Tea Party newcomers will refuse to bailout these spendthrift states so substantial government employee layoffs are going to happen so expect the occupiers to kick it up a notch! State and local governments have laid off -535,000 workers since 2008 already. With borrowed Federal government stimulus handouts evaporating into thin air during 2011 – 2012, this total will reach 800,000 by the end of the next year. The Post Office will do their part by cutting -28,000 jobs in 2012, even though they need to cut -100,000. States and municipalities based their budgets on the revenues produced by the fake housing boom from 2003 – 2007. The tax revenue dried up, but the union jobs continue to grow, costing taxpayers billions. States and localities can’t print, so layoffs will continue. Does any of this sound like the market should rally +10% to +15% this year, I don’t think so, volatility will continue!!
It was reported this morning that the Institute for Supply Management's manufacturing index for December climbed to 53.9% from 52.7% in November, which is a six-month high. Economists had anticipated a 53% reading. Any reading above 50% indicates expansion. The production and employment gauges each rose +3.3 points, and there was a +0.9% gain for the new orders index.
Construction projects rose +1.2% in November. The gain in construction spending in November was above analysts' expectations of a +0.5% gain. However, October construction spending was revised down to show a -0.2% decline from the previous estimate of a +0.8% gain. In November, spending on private construction rose +1.0% and residential construction rose +2%. Spending on public projects rose +1.7%.
Friday, December 30, 2011 4:03 p.m. est.
Well this final week of trading for the year didn’t see much of an upside push with Wednesday seeing a -1% sell off and then a +1% rally yesterday. Surprisingly today saw the market under pressure so it made it seem as if investors wanted the market to close right where it started the year at the unchanged level!
The market started the day higher with the Dow up +5.00 points, S&P 500 +2.00 points and the Nasdaq Composite +5.00 points but it was so little that when it sold off the Dow saw lows of -75.00 points, S&P 500 -6.00 points and the Nasdaq Composite -10.00 points in the final hour.
At the close the Dow was down by -70.00 points to 12,218.00, S&P 500 -5.40 points to about 1258.00, S&P 100 -2.40 points to 571.00 and the Nasdaq Composite -9.00 points to about 2605.00. Oil was also flat remaining around the $99.00 level closing down -$.56 for the day.
Overall the market was flat for the year with the S&P 500 actually closing down about -.40 points or +.03% for the entire year which is just bizarre! It almost seemed liked traders were trying to get it back exactly where it started the year! Even the Nasdaq was lower closing down just about -2% for the year. The only indice that even came close to having a decent year was the Dow up about +5.5% but that’s only 30 stocks so in reality it doesn’t count. This is quite disappointing actually as I thought there could at least be a bit of a push higher to make the market look better for the year but instead it went no where which is great for the style of trading we do but for others their frustration will likely continue. People have left the market and volume confirms it! Why should they come back anyhow, the coming year will be facing little change as the EU is still dealing with their problems, we have an election year, America is going broke and the middle east is kicking up sand once again! What it does mean is that volatility will likely continue at least at the start of the year.
Tuesday, December 27, 2011 4:03 p.m. est.
Just wanted to say that because the market will likely be flat for the rest of the week I’m going to take it off till Friday unless there is a surprise or something news worthy.
The market started slightly to the downside with the Dow off -25.00 points, S&P 500 -3.00 points and the Nasdaq Composite -10.00 points. It then turned higher but not by much with the Dow up +30.00 points, S&P 500 +3.00 points and the Nasdaq Composite +15.00 points. The final hour saw volatility come in though and the market finished the day about where it started the day.
At the close the Dow was down by -3.00 points to 12,291.00, S&P 500 +.10 points to about 1265.00, S&P 100 -.50 points to 573.50 and the Nasdaq Composite +7.00 points to about 2625.00. Oil rallied today after Iran threatened to close the Straight of Hormuz because different countries are starting to talk about putting sanctions on them to get them to stop their nuclear program. It closed up +$1.50 around the $101.00 level.
One of the reason the market may have limped along today was because volume was less than half of normal and will likely be that way into year end. Another indication that the market may stay flat is that last week the market rallied however after Europe gave its banking system nearly $700 billion dollars, their markets fell. What does that mean, $700 billion isn't enough money to cover the trillions that has disappeared from all of their countries so it looks like the EU just threw another band-aid on the problem and hope it sticks. One thing that reveals that the problem may persist as we go into 2012 is that Goldman Sachs is the biggest investment bank in the world so its movement is important. On Tuesday, when the market rallied, Goldman barely moved higher. This isn’t a good sign because if this had been a trading bottom you would think that their shares would have led the way higher, or at least have participated nicely in the rally. Instead, the stock didn’t rise very much more and it was on lower volume than the prior day when it fell over five points. This could be a sign that the rally we have seen may end at the start of the year.
The Conference Board said its consumer-confidence index jumped to 64.5% in December - the highest level in eight months from a revised 55.2%. Economists were expecting the index to climb to 60%. Consumer confidence has jumped nearly 25% points in the past three months and now sits at its highest level since April. "Consumers are more optimistic that business conditions, employment prospects and their financial situations will continue to get better," said Lynn Franco, director of the board's consumer-research center. Yet Franco also cautioned against reading too much into the data. "While consumers are ending the year in a somewhat more upbeat mood, it's too soon to tell if this is a rebound from earlier declines or a sustainable shift in attitudes." The present situation index rose to 46.7% from 38.3% and the future expectations index rose to 76.4% from 66.4%, the board said. The percentage of people who expect more jobs to be available in coming months moved up to 13.3% from 12.4%.
Friday, December 23, 2011 4:03 p.m. est.
Just wanted to wish you a very Merry Christmas and Happy Hanukah! Hope you have a wonderful holiday with friends and family!!! The market started flat today but as the day went on and volume got less and less it rallied with the Dow seeing highs of +130.00 points, S&P 500 +12.00 points and the Nasdaq +25.00 points right at the close. At the close the Dow was up by +125.00 points to 12,294.00, S&P 500 +11.00 points to about 1265.00, S&P 100 +5.00 points to 573.00 and the Nasdaq Composite +20.00 points to about 2619.00. Oil was over $100 early on and closed up +$.20 around the $99.70 level. The market is up over +4% in the past four days alone and is now just back to about unchanged for the entire year. With four trading days left in the year I would assume that the market will try to add to these gains but it is starting to get quite overbought so even if it does remain higher we’re likely to start the year on the downside.
Personal income rose +0.1% in November, as consumer spending also gained +0.1%. In October, personal income had gained +0.4%, while spending had increased +0.1%. For November, economists had expected personal income to gain +0.2%, and for spending to also rise +0.2%. Meanwhile, there was no growth in November for the price index for personal consumption expenditures, though this inflation gauge is up +2.5% from the prior year. The core inflation reading, which excludes volatile food and energy costs, rose +0.1% in November, matching economists’ expectations. Compared with the prior year, core inflation is up +1.7%. The personal-saving rate declined to 3.5% in November from 3.6% in October.
Led higher by transportation equipment, orders for Durable Goods rose +3.8% in November, the largest gain since July. Economists had expected durable-goods orders to rise +3.6% due to aircraft, among other items. Transportation-equipment orders rose +14.7%, with a +73.3% gain for non-defense aircraft and parts. Excluding transportation, durable-goods orders rose +0.3% in November. Orders for core capital goods, which exclude defense and aircraft, fell -1.2% in November. Shipments of durable goods fell -0.4% in November. Unfilled orders rose +1.3% in November, and inventories gained +0.6%. In October, there was no growth in durable-goods orders.
Led by growth in the South and Midwest, sales of new single-family homes rose to a seasonally adjusted annual rate of 315,000 in November, the highest level since April. Economists had expected November's result, and have been cheered by improving trends in recent housing data, though overall levels remain relatively low. Sales in October were upwardly revised to 310,000 from a prior estimate of 307,000. The median sales price fell to $214,100 from $222,600 in October. The supply of new homes on the market declined to 6 months from 6.2 months. Sales of new homes are up +9.8% from the prior year.
Thursday, December 22, 2011 4:03 p.m. est.
Interesting; The Wall Street Journal: "Southern European investors, fearful of the health of their banks and the future of the euro, are increasingly stashing their wealth in currencies, real estate and investment products outside the euro zone, say bankers and government officials." The Journal added: "investors in Greece, Portugal and Italy are asking bankers and lawyers for ways to protect their money in the case of a failure of euro-zone banks or a breakup of the euro itself. Some are converting deposits into currencies such as the Swiss franc. Others are buying real estate outside the monetary union, such as in London, or setting up trusts to hold their wealth in jurisdictions as distant as Singapore or the Bahamas, say bankers and lawyers."
One example is Greece. According to The Journal: "capital flight from Greece is intensifying. Since the start of Greece's debt crisis in late 2009, Greeks have pulled more than €60 billion of cash—about a quarter of total deposits—from their banks. Between September and early November, those outflows totaled nearly €14 billion, representing two of the worst months for deposit outflows since the start of the crisis."
The most important relationship in looking at the global economy, is the direction of money, into and out of the U.S dollar right now and that will be the clue for 2012. In 2001, after the 9/11 attacks on the Twin Towers, dollars left America and went to China and the emerging markets, where "growth" was the word, and where hot money fueled an economic binge. Ten years later, it is possible, and plausible that dollars are starting to flow back to America which will likely keep markets sideways at least for a while. Right now the dollar has been pulling back this week but as we move into next year things could get interesting!
The market didn’t continue its rally yesterday and basically closed where it started with only slight gains. Today it rallied a bit on diminishing volume with the Dow seeing highs in the final hour of +80.00 points, S&P 500 +12.00 points and the Nasdaq +25.00 points.
At the close the Dow was up by +62.00 points to 12,154.00, S&P 500 +10.00 points to about 1254.00, S&P 100 +4.00 points to 567.00 and the Nasdaq Composite +21.00 points to about 2600.00. Oil was almost hitting $100 early on and closed up +$.80 around the $99.50 level.
Jobless Claims fell to their lowest level since April 2008 with them falling -4,000 to a seasonally adjusted 364,000. The four-week average fell -8,000 to 380,250, the fewest since June 2008. Economists had expected that claims would rise to 375,000, while remaining at levels historically associated with an improving labor market. There is concern about the expiration of special federal unemployment-insurance payments, with more than 2.8 million people expected to lose benefits by the end of February, according to the National Employment Law Project, a New York-based advocacy group. Continuing claims fell -79,000 to 3.55 million, reaching the lowest level since September 2008. The four-week average of these ongoing claims fell -40,000 to 3.63 million, the lowest level since October 2008. About 7.15 million people received some kind of state or federal benefit in the week ended December 3rd, down about -300,000 from the prior week.
A gauge of consumer sentiment reached 69.9% in the final reading for December compared with 64.1% in November, according to data from the University of Michigan and Thomson Reuters and is the fourth consecutive monthly gain in the index. A preliminary reading for December pegged the gauge at 67.7%. Economists had expected a final December result of 68.7%, with consumers somewhat cheered by declining retail gasoline prices and the large drop in initial jobless claims. The sentiment gauge, which covers how consumers view their personal finances as well as business and buying conditions, averaged about 87% in the year before the start of the most recent recession. Economists watch sentiment data to get a feel for the direction of consumer spending.
Real Gross Domestic Product for the third quarter was revised to an increase of +1.8% annualized from the earlier estimate of a +2% rise. Economists expected third-quarter growth to be unrevised at a +2% rate. The downward revision to third-quarter GDP was largely due to weaker consumer spending. A key measure of inflation was revised higher. The core personal consumption index, which excludes food and energy prices, increased +2.1% up from +2% reported earlier. Corporate profits before-tax were revised lower. Corporate profits before-tax increased +1.2% quarter-to-quarter, down from the +1.6% gain reported earlier.
Leading economic indicators grew +0.5% in November, led by the interest-rate spread and building permits. Economists had expected growth of +0.3% in November, compared with a +0.9% gain in October. The LEI is a weighted gauge of 10 indicators that are designed to signal business cycle peaks and troughs. Among the 10 indicators that make up the LEI, seven made positive contributions in November.
Yesterday it was reported that an average of 14% fewer existing homes were sold annually between 2007 and 2010, according to revisions by the National Association of Realtors, pointing to a housing market that was even weaker than previously believed. During the revision's time period, there were average annual sales of about 4.42 million existing homes, compared with prior estimates of about 5.16 million. NAR revised the data to correct for some sampling and data-reporting problems.
Tuesday, December 20, 2011 4:03 p.m est.
The market took off this morning as improving German business data
and a better Spanish bond auction made it look like the EU was looking like
it would solve its problems. The Dow saw highs in the final hour of +360.00
points, S&P 500 +38.00 points and the Nasdaq +85.00 points.
At the close the Dow was up by +337.00 points to 12,104.00, S&P
500 +36.00 points to about 1241.00, S&P 100 +16.00 points to 563.00 and
the Nasdaq Composite +81.00 points to about 2604.00. Oil was higher all day
closing up +$3.50 around the $98.00 level. Today may have been the start of
the Santa Claus rally as the market is about 1% away from break even for the
year and this being Christmas and the start of Hanukah today, its not surprising
to see it up. Next year, that’s another story...
New construction of Homes rose in November to the highest annual rate
since April 2010, with multi-family activity leading the monthly growth. Housing
starts rose +9.3% last month to a seasonally adjusted rate of 685,000, the highest
annual rate since April 2010. Starts for units in buildings with at least five
units rose +32.2% in November, climbing to a rate of 230,000, the highest level
since September 2008. Meanwhile, starts of new single-family homes rose +2.3%
to an annual rate of 447,000. Starts in October were revised down to 627,000
from a prior estimate of 628,000. Economists had expected an annual rate of
635,000 for starts in November. Meanwhile, building permits, a leading indicator
of housing construction, rose +5.7% in November to a seasonally adjusted annual
rate of 681,000, the highest annual rate since March 2010.
Building permits for single-family homes rose +1.6% on the month to
a 435,000 rate. Many economists consider single-family permits to be the most
important number in the government’s release.
In the past year, overall starts are up +24.3% but starts of single-family
homes are down -1.5% for the year. Meanwhile, starts of units in buildings with
at least five units have gained a record +180.5%, with the data going back to
1959. The increasing demand for multifamily properties is due to a shift from
home ownership to renting that is likely to last for years.
Monday, December 19, 2011 4:03 p.m est.
The market popped higher today with the Dow seeing highs of +50.00
points, S&P 500 +5.00 points and the Nasdaq +20.00 points but it was on
thin volume and when it couldn’t make anymore gains it fell seeing lows
in the final hour with the Dow seeing -120.00 points, S&P 5600 -16.00 points
and the Nasdaq -35.00 points.
At the close the Dow was down by -100.00 points to 11,766.00, S&P
500 -14.00 points to about 1205.00, S&P 100 -6.00 points to 547.00 and the
Nasdaq Composite -32.00 points to about 2523.00. Oil was higher at the start
of the day but it fell midday to only close up +$.40 around the $94.00 level.
Home builder confidence rose to a 19-month high in December, though
the gauge still remains in weak territory. The National Association of Home
Builders/Wells Fargo housing market index rose to 21% in December from 19% in
November, marking the third monthly rise in a row. Economists had anticipated
a 20% reading. The index for November was downwardly revised from 20%. The seasonally
adjusted index, which correlates closely with single-family housing starts,
is designed so that readings over 50% are considered "good," which
hasn't been the case since April 2006.
Friday, December 16, 2011 4:03 p.m est.
Not surprising the market rallied today as it was expiration and we
saw full profits to end the year!! The Dow saw highs of +100.00 points, S&P
500 +15.00 points and the Nasdaq +50.00 points but when Fitch and Moody’s
announced that they were downgrading some EU banks selling began and the Dow
saw lows of -50.00 points, S&P 500 -1.00 points and the Nasdaq only seeing
gains of +5.00 points. Of course it was expiration so the market came back to
finish the day mostly unchanged.
At the close the Dow was down by -2.00 points to 11,866.00, S&P
500 +4.00 points to about 1220.00, S&P 100 +2.00 points to 554.00 and the
Nasdaq Composite +14.00 points to about 2555.00. Oil sold off again midday but
came back to also closed mostly unchanged down -$.10 around the $94.00 level.
Next week we basically start holiday and year end trading and it appears
that the combination of Europe, the 2012 Election, and the economy are having
their influence on markets. Trading will get even thinner as we approach Christmas
holidays which will likely exacerbate the situation. Then you have Iran making
threats, weird politics happening in Russia, and the general uncertainty of
the moment, so we’ll likely see volatility continue.
The good thing however is that with the U.S dollar actually strengthening
its apparent that the U.S. is still the refuge country for global investors.
If the dollar continues to rally and at the least stocks and bonds remain steady,
or fall less than other global assets, volatility will continue and this will
be incredible for our style of trading. Money does seem to be moving away from
Europe and other parts of the world to the U.S. Even China is starting to show
signs of problems as a report from them indicates they have overbuilt with their
now overhyped property markets.
Money has been leaving the U.S. for over twenty years now so could
we be seeing a long term trend change, maybe. Emerging markets, especially China
were growing and the promise of the Euro was alluring but now that is definitely
changing. The dollar has been weak since the 9/11 attacks and stocks have rallied
on that weakness as we started being like Japan with the dollar put trade. However,
if this pro-dollar trend remains in place, it could be the trend for many years
and the dollar and markets may rally together once again. The bad news however
is that this means we could see higher interest rates and that may hold back
the housing market. In the end I think 2012 will prove to be interesting with
volatility. Besides that its also supposed to be the end of the world and there
are an extra large amount of solar flares hitting the earth to make things interesting!!
Consumer prices were unchanged in November, mainly because of declining
energy costs. So-called core prices rose a seasonally adjusted +0.2%, however.
The core data strips out volatile food and energy costs. Economists had forecast
CPI to be unchanged overall, with a +0.1% increase in the core rate. Consumer
prices have risen an unadjusted +3.4% over the past 12 months, but that's down
from +3.9% in June. Yet the core rate has risen +2.2% over the past 12 months,
the largest such increase since 2008. Inflation-adjusted hourly wages, on average,
fell -0.1% in November.
Thursday, December 15, 2011 4:03 p.m est.
Interesting; Realtors "overcounted" housing sales "for
years." Home sales data regarding previously owned homes has been inaccurate
since 2007. According to Reuters: "Data on sales of previously owned U.S.
homes from 2007 through October this year will be revised down next week because
of double counting, indicating a much weaker housing market than previously
thought." The report added: "The National Association of Realtors
said a benchmarking exercise had revealed that some properties were listed more
than once, and in some instances, new home sales were also captured."
Yesterday the market sold off hard as oil was falling and the dollar
was strong because there was more talk about the EU failing. The market closed
near its lows of the day off about -1%. Today, the market started the day higher,
making up all of yesterday’s losses as economic data was pretty good.
The Dow saw highs of +150.00 points, S&P 500 +14.00 points and the Nasdaq
+30.00 points but as the dollar strengthened once again and oil slipped, selling
took hold and the Nasdaq was the first index to touch red territory. The final
hour saw it come back though and there were decent gains for the day.
At the close the Dow was up by +47.00 points to 11,870.00, S&P
500 +4.00 points to about 1216.00, S&P 100 +1.00 point to 552.00 and the
Nasdaq Composite +2.00 points to about 2541.00. Oil was really hit hard yesterday
down over $5 and today it started the day higher but sold off once again closing
down -$1.00 around the $94.00 level.
With expiration tomorrow its looking more and more that this expiration
traded week won’t be to the upside but the good news is we’re going
to see full profits once again. Volatility to the downside may grow as we go
into another weekend of wondering what Europe will say by Monday and we will
start moving into slower Christmas volumes.
This morning it was reported that Jobless Claims fell by -19,000 last
week to a seasonally adjusted 366,000, putting claims at the lowest level since
May 2008. Claims from two weeks ago were revised up to 385,000 from 381,000.
Economists had projected that claims would rise to 390,000. Jobless claims have
fallen below 400,000 - a level historically associated with an improving labor
market in five of the past six weeks. The four week average of new claims over
the past month, meanwhile, fell by -6,500 to 387,750 to the lowest level since
July 2008. Continuing claims rose by +4,000 to a seasonally adjusted 3.60 million.
About 7.45 million people received some kind of state or federal benefit in
the week ended November 26th, up +874,670 from the prior week.
Industrial production declined -0.2% in November, dragged lower by
a sharp -3.4% reduction in the output of motor vehicles and parts. Economists
had forecast a flat reading after a +0.7% gain in October. Even excluding autos,
manufacturing output fell -0.2%. While October data was unrevised, readings
from June, August and September were revised higher while July's was revised
lower. Compared to November 2010, industrial production was +3.7% higher. Capacity
utilization fell to 77.8% in November from an upwardly revised 78% in October;
utilization has clung to a narrow 0.5% band since July.
Producer Prices climbed +0.3% in November as the price of food increased,
mostly for vegetables and chicken. Economists had predicted a +0.1% rise. The
increase was driven by higher food prices, which rose +1% last month. Energy
costs rose a slight +0.1% after falling -1.4% in October. Minus the food and
energy categories, so-called core wholesale prices rose +0.1%. Economists were
expecting a +0.2% increase in the core rate. Over the past 12 months, wholesale
prices have risen +5.7%, the smallest year-over-year increase since March. Core
prices have climbed a lesser +2.9% in the past 12 months, the lowest increase
since June 2009. Intermediate prices, meanwhile, rose +0.2% last month while
crude prices jumped +3.8%. The core intermediate index, an indicator of future
inflation, fell -0.4% in November.
The U.S. current-account deficit, which is the combined balances on
trade in goods and services, income, and donations, fell to $110.3 billion,
or -2.9% of GDP, in the third quarter, from an upwardly revised $124.7 billion,
or +3.3%, in the second quarter. More than half of the decrease reflected a
decrease in the deficit on goods. A decrease in net unilateral current transfers
and increases in the surpluses on services and on income also contributed. The
second quarter deficit initially was reported as $118.0 billion, and the revision
was mostly due to increased net financial inflows.
The Empire State manufacturing index rose in December to its highest
level in seven months, the New York Fed said. The Empire state index rose to
9.5% in December from 0.6% in November. The index had been at or below zero
since June. The size of the gain in December surprised analysts as economists
expected the index to rise to 3% in December. Underlying conditions were mainly
strong. The new orders index rose to 5.1% from negative -2.1% in November. The
employment indexes were mixed as the index for the number of employees rose
to 2.3% from a negative -3.7% in November but the average workweek fell to negative
-2.3% from -2.4% in the prior month. A reading of expected conditions six-months
ahead climbed sharply in December to its highest reading since May.
Yesterday it was reported that Import prices rose by +0.7% in November,
the first increase in four months. The rise in import prices was the largest
since April but was less than expected. Economists were expecting import prices
to rise +1.5%. Import prices in October were revised slightly higher to a drop
of -0.5%, compared with initial estimate of a drop of -0.6%. Over the past year,
import prices increased +9.9%. Imported fuel prices rose +3.6% in November after
a -1.5% decline in the previous month. The price index for imports excluding
fuel fell -0.2% for the second straight month.
Tuesday, December 13, 2011 4:03 p.m est.
Very interesting dialogue in the Senate today as Jon Corzine and his
top people were once giving testimony about the ongoing MF Global debacle. When
it came right down to it they were all adamant that they never used customer
funds to cover any trades and that the books were all intact going into the
bankruptcy etc. Corzine was even more direct then his last testimony which makes
one think that maybe they actually may find the missing money!
The market rallied today even though economic data wasn’t very
good and that Europe was still under pressure as Germany was making comments
once again about not putting up the cash to support the EU. This makes me think
that the initial rally today was due to expiration related trading. The Dow
saw highs of +130.00 points, S&P 500 +14.00 points and the Nasdaq +30.00
points. Selling did take hold later on and the final hour saw outright selling
with the Dow off -120.00 points, S&P 500 -17.00 points and the Nasdaq -45.00
points at one point.
At the close the Dow was down by -66.00 points to 11,955.00, S&P
500 -11.00 points to about 1226.00, S&P 100 -4.00 point to 556.00 and the
Nasdaq Composite -33.00 points to about 2579.00. Oil rallied today as Iran was
making threats that if they ever got attacked that they could shut down the
Strait of Hormuz pretty quick which would basically shut down all of the Middle
Easts oil supply to North America. It closed up +$2.40 around the $100.00 level.
Retail spending slowed in November, with sales rising only +0.2% following
a sharper +0.6% increase in October. Sales excluding the volatile auto sector
also rose +0.2% last month. Economists expected retail sales to rise by +0.5%
overall, or by +0.4% excluding the auto sector. In October, retail sales were
revised up to a +0.6% increase from an initially reported gain of +0.5%. Purchases
by consumers account for as much as 70% of growth, so the slower increase in
retail sales in November suggests the economy won't grow quite as fast in the
fourth quarter as forecasters were predicting.
Inventories at businesses rose +0.8% in October. Economists had been
expecting inventories to rise a seasonally adjusted +0.9%. Business sales climbed
+0.7%. The inventory-to-sales ratio, an indication of demand, was unchanged
at 1.27. Retail inventories were also unchanged.
The Fed said at 2:15 est. that it would it would keep interest rates
at the same level that it has had the past three years at near-zero levels as
the central bank refrained from new action with recent signs of improvement
in the economy. The decision leaves the Fed’s key interest rate at an
historic low range of 0% to 0.25%, and the central bank kept its guidance that
it intends to keep rates near zero until mid-2013 given its expectations for
the economy. They were a little more upbeat about the outlook. In its statement
the Fed said that the economy “has been expanding moderately,” despite
slowing in global growth. They noted that the unemployment rate remained high
at 8.6% according to the Labor Department, despite some improvement in labor
market conditions. While consumer spending was advancing, businesses appeared
to be pulling back, the statement said and there was one dissent to the decision.
Charles Evans, the president of the Chicago Fed, dissented in favor of more
easing. The Fed will next meet on January 24th-25th. Economists expect the Fed
may be ready to announce an overhaul of how they signal policy plans. The minutes
of the Fed’s last two meetings have included lengthy discussions of communication
issues. Some Fed officials want to provide clearer guidance on the mid-2013
promise and to tie low short-term rates to economic conditions. Fed officials
are also pondering whether to adopt an explicit inflation target. Many economists
think the Fed will show the expected future path of interest rates. Economists
are split on whether the Fed will decide next year whether to launch another
round of bond purchases or quantitative easing.
The Fed has purchased $2.3 trillion of bonds trying to push down long-term
interest rates. In September, the Fed announced an Operation-Twist plan to buy
longer-term securities and sell $400 billion of short-term debt to lengthen
the average maturity of securities on its balance sheet.
Monday, December 12, 2011 4:03 p.m est.
The market had rallied on Friday as it looked like the EU problem was
solved but as the weekend wore on and there was more confirmation that Britain
was going to have nothing to do with solving their problems, the market sold
off today. The Dow saw lows of -250.00 points, S&P 500 -29.00 points and
the Nasdaq -60.00 points. Germany also said it doesn’t want to front all
of the cash for the deal and German Chancellor Angela Merkel stated that she
doesn't expect any more meetings before Christmas. That means that two weeks
will go by and the potential for no further progress will rise. For many countries,
the agreement will have to be ratified by national assemblies and parliament
so we could be looking at February before anything gets done. That means that
there is the potential for further disagreement and delay in implementation
of the plan. Because of this volatility will likely continue to rise going into
year end and the first tell tale sign that the EU may be continuing to struggle
is that next week Italy has to auction new debt. If yields rise dramatically
the markets will likely remain under pressure. There is one thing that could
help though and that is we are approaching year end so there is still a chance
for a rally and its an expiration traded week which is generally higher.
In the final hour the market came back a bit and at the close the Dow
was down by -163.00 points to 12,021.00, S&P 500 -19.00 points to about
1236.00, S&P 100 -8.00 point to 560.00 and the Nasdaq Composite -35.00 points
to about 2612.00. Oil closed down -$1.50 around the $98.00 level.
Friday, December 9, 2011 4:03 p.m est.
Today there was good news on the MF Global front as the trustee was
authorized to give back about 72% of all customers cash that has been basically
in limbo for over a month now and that they may have found $875 million of the
$1.2 billion missing cash in bond funds overseas. Only time will tell however.....
The market rallied today as traders decided that there was a possibility
that the EU ideas may work out in the end with the Dow seeing highs of +210.00
points, S&P 500 +25.00 points and the Nasdaq +60.00 points although Britain
said that they would basically have nothing to do with helping them out.
At the close the Dow was up by +187.00 points to 12,184.00, S&P
500 +21.00 points to about 1255.00, S&P 100 +9.00 point to 568.00 and the
Nasdaq Composite +50.00 points to about 2647.00. Oil closed up +$1.50 around
the $99.80 level.
It was interesting that the market rallied as the EU failed to reach
an agreement on its crisis. According to Reuters: "The European Union failed
to secure backing from all 27 countries to change the EU treaty at a summit
on Friday, meaning any deal will now likely involve the 17 euro zone countries
plus any others that want to join, three EU diplomats said. An agreement at
27 fell through after British Prime Minister David Cameron demanded concessions
that Germany and France were not willing to give, one of the officials said."
Its good that they actually accomplished something though with 23 of 27 agreeing
to cut spending. The agreement may not be perfect. But there was a serious attempt
to get something done and at least a little something did come of it. That means
that the markets could give Europe the benefit of the doubt and a lot of the
risk hedging may come off which may have been why there was another round of
short covering in the market. The bottom line is that this may be an important
day and that because the market accepted the result today that it may set the
stage for what happens the rest of this year.
It was reported this morning that the trade deficit narrowed for the
fourth straight month in October, bringing the trade gap down to its lowest
level this year. The nation’s trade deficit narrowed -1.6% in October
to $43.5 billion. A prominent feature of the report was a sharp upward revision
to the September trade gap to $44.2 billion from the initial estimate of $43.1
billion, which could cut the government’s estimate of third quarter growth,
now estimated at a +2% annual rate. Analysts had expected a deficit of $43.6
billion. Meanwhile, exports of goods alone slipped -1.2% to $127.8 billion however,
exports saw a record amount of capital goods and petroleum in the month. Exports
of civilian aircraft also increased in October. Despite the improvement in the
overall trade gap, the trade deficit with China widened to $28.1 billion in
October from $25.7 billion in the same month last year. Imports from China in
October were the highest on record.
The University of Michigan/Thomson Reuters index of consumer sentiment
reached 67.7% in the initial reading for December, its highest level since June.
Thursday, December 8, 2011 4:03 p.m est.
The market was looking to go higher according to Globex trading overnight
after the EU cut interest rates to 1% but it suddenly fell after European Central
Bank President Mario Draghi said that the European Union treaty prohibits "monetary
financing." He was responding to a reporter's question about why the central
bank doesn't ramp up its bond-buying program. Things got worse after S&P
announced that it was going to lower its ratings on all EU countries with the
Dow seeing lows of -240.00 points, S&P 500 -30.00 points and the Nasdaq
-60.00 points. EU leaders will meet in Brussels on Thursday evening and Friday
so the volatility will likely continue.
At the close the Dow was down by -200.00 points to 11,998.00, S&P
500 -27.00 points to about 1234.00, S&P 100 -11.00 point to 559.00 and the
Nasdaq Composite -53.00 points to about 2596.00. Oil closed down -$2.00 around
the $98.00 level.
Jobless Claims fell -23,000 to a seasonally adjusted 381,000 last week,
the lowest level since late February. However if you look at the non-seasonal
level it has risen over +100,000 to be over the 500,000 level. Last weeks numbers
were revised up by +2,000 to 404,000. The four-week average of new claims also
fell, down -3,000 to 393,250 and is the lowest level since early April. Continuing
claims fell by -174,000 to a seasonally adjusted 3.58 million, the lowest number
since September 2008. The insured unemployment rate fell two-tenths of a percentage
point, to 2.8% and is the lowest rate since October 2008. The four-week average
of continuing claims dropped -20,500 to stand at 3.67 million.
Wednesday, December 7, 2011 4:03 p.m est.
The market was lower at the start of the day with the Dow seeing lows
of -90.00 points, S&P 500 -14.00 points and the nasdaq -40.00 points but
as it turned into drift mode the Dow saw highs of +110.00 points, S&P 500
+10.00 points and the Nasdaq +15.00 points as tech stocks continue to be under
pressure.
At the close the Dow was up by +46.00 points to 12,196.00, S&P
500 +3.00 points to about 1261.00, S&P 100 +2.00 point to 570.00 and the
Nasdaq Composite -.40 points to about 2649.00. Oil inventories revealed some
large increases so it fell under -$100 at one point but closed down -$.50 around
the $100.00 level. Managers are really trying to hold the market up but it is
getting quite overbought here in the short term so it will be interesting to
see if it can hold as we approach expiration next week!
Tuesday, December 6, 2011 4:03 p.m est.
The market started the day higher but then fell as it drifted with
the Dow seeing lows of -20.00 points, S&P 500 -4.00 points and the nasdaq
-10.00 points. Of course it turned around though on weak volume with the Dow
making highs of +120.00 points, S&P 500 +8.00 points and the Nasdaq +15.00
points as tech stocks seemed to be under pressure.
At the close the Dow was up by +50.00 points to 12,150.00, S&P
500 +1.00 points to about 1258.00, S&P 100 +1.00 point to 567.00 and the
Nasdaq Composite -6.00 points to about 2649.00. Oil was flat all day and basically
closed unchanged to finish the day around the $101.00 level.
It’s interesting that the market is holding up so well considering
what is going on with the EU and it is still debatable if it will be make it
in the new year however money flow data suggests that money, albeit small may
be moving back into the U.S. The reason I see that is the U.S dollar is also
showing some support. It has been a long time since stocks and the dollar have
moved up simultaneously. For several years this has been an opposing relationship
so if this continues it would be a sign that money is moving into the U.S.
You can see that the market is making the biggest attempt at holding
up into yearend as the market rallied when Europe seemed to get serious about
making an attempt to get its fiscal house in order but by the end of the week
there was a whole lot less momentum in stocks. Yesterday when S&P announced
that it would downgrade the credit of European nations, including France and
Germany even though the market fell off of its highs it still remained higher.
Stocks seem to be supported by money leaving the Euro and the gold market, economic
data has been stable of late and there even has been some job growth and stability
in the manufacturing sector. Although I think they are going to be lowered next
year, corporate earnings also remain steady. Compared to the rest of the world,
it's clear that the markets are seeing something in the U.S so it will be interesting
to see how we close the year.
Monday, December 5, 2011 4:03 p.m est.
The market rallied pretty hard at the start of the day as there was
no bad news from the EU this weekend and only had positive things to say this
morning. The Dow made highs of +170.00 points, S&P 500 +23.00 points and
the Nasdaq +50.00 points. However when S&P came out and said that they were
putting many of the AAA EU countries on credit watch negative the market gave
up much of its gains.
At the close the Dow was up by +80.00 points to 12,098.00, S&P
500 +13.00 points to about 1257.00, S&P 100 +4.00 points to 566.00 and the
Nasdaq Composite +29.00 points to about 2656.00. Oil was higher all day on news
that Iran shot down a U.S drone over the weekend but the news about S&P
turned it negative closing down -$.10 to finish the day around the $101.00 level.
The market is likely to see volatility all week as the EU debacle continues
and volume continues to dry up.
Friday, December 2, 2011 4:03 p.m est.
The market was looking to rally even before the employment report came
out an hour before the open today but when the number came in better than expected,
Globex futures actually pulled back a bit. There were still strong gains to
be had at the open though with the Dow making highs of +130.00 points, S&P
500 +16.00 points and the Nasdaq +35.00 points. Of course it is Friday and who
knows what will come out of Europe over the weekend so the market pulled back
from its highs and actually turned mixed in the final hour. In the end the market
still closed with its second biggest weekly gains ever, coming off of one of
its worst down weeks ever however!! Makes you wonder why so many people are
staying out of the market, however for us this volatility has been incredible
so it has made our trading the past few months incredible for selling options!
At the close the Dow was down by -.61 points to 12,020.00, S&P
500 -.30 points to about 1244.00, S&P 100 +.60 points to 562.00 and the
Nasdaq Composite +.75 points to about 2627.00. Oil was higher all day closing
up +$.90 to finish the day around the $101.00 level.
Employment as up +120,000 jobs in November and the unemployment rate
fell to 8.6% from 9%. The government also revised jobs data for October and
September to show that +72,000 additional jobs were created. Economists had
forecast a +125,000 increase in employment in November and no change in the
jobless rate. The bad news is that about half of the drop in the unemployment
rate stemmed from a decline in the number of workers in the labor force dropping
out. Hiring in October was revised up to +100,000 from +80,000 and the job gains
in September were revised up to +210,00 from +158,000. In November, companies
in the private sector hired +140,000 workers, with retailers adding +50,000
and the government cutting -20,000 jobs. Average hourly earnings fell -0.1%
last month to $23.18 and that's really bad news while the workweek was unchanged
at 34.3 hours. The good news was that the broader private sector unemployment
rate dropped to 15.6% from 16.2% in October.
Thursday, December 1, 2011 4:03 p.m est.
The market decided to consolidate its gains today and started the day
lower. It was able to gain some traction though with the Dow making highs of
+15.00 points, S&P 500 +4.00 points and the Nasdaq +20.00 points. It fell
again after that however with the Dow seeing lows of -80.00 points, S&P
500 -8.00 points and the Nasdaq Composite -15.00 points. At the finish of the
day it remained lower as traders started to anticipate the employment report
coming out tomorrow morning!
At the close the Dow was down by -25.00 points to 12,021.00, S&P
500 -2.00 points to about 1245.00, S&P 100 -1.00 points to 561.00 and the
Nasdaq Composite +6.00 points to about 2626.00. Oil was flat all day closing
down just a little -$.30 to finish the day around the $100.00 level.
Yesterday the rally was huge but if you look at it without blinders
on you get a different picture. Basically, the world's central banks, by dropping
the price of dollar based swaps or loans, made a whole lot of money available
to the banking system. The fact that Canada, the U.K., and Switzerland's central
banks joined the Fed stated that we're all in this together now! It worked as
it provided an impressive one day rally, which could continue but isn’t
guaranteed. Markets will start to look around and ask questions and the questions
will be the same as they were last week! Where is Greece going to get the money
to pay for decades of no taxes having been collected and how will Italy, Spain,
Portugal and Ireland be able to paper over the huge losses caused by runaway
speculation on housing based on no real economic activity over the years! What
it all means is that unless the European Union actually does something to change
the way it does business, all the gains in the rally could disappear and the
Euro will likely take a huge hit. Basically, the Fed and the global central
banks may have bought Germany and the European Union a few weeks in which to
get their house in order, but little more.
It may not last anyhow after you look at why China's central bank lowered
its reserve requirements. According to Reuters: "China's factory sector
shrank in November for the first time in nearly three years, an official purchasing
managers index (PMI) showed on Thursday, underlining the central bank's move
to cut bank reserve requirements to help the economy." To be sure, the
drop wasn't huge but the number falling below 50 is bad for sentiment and indicates
a slowdown may be bigger than expected and indicate just how bad the current
global situation is.
Jobless Claims rose last week by +6,000 to a seasonally adjusted 402,000.
Economists had expected to only rise to 393,000. Claims in the prior week were
revised up to 396,000 from an original reading of 393,000. T he average of new
claims over the past four weeks, meanwhile, increased by +500 to 395,750. Continuing
claims climbed by +35,000, to 3.74 million and a total of 7.01 million people
received some kind of state or federal benefits two weeks ago.
Wednesday, November 30, 2011 4:03 p.m est.
The market looked to rally this morning as Globex futures rallied overnight
after it was announced that China said it was going to cut its bank reserve-requirement
ratio. Then when it was announced that all of the major global central banks
said they had agreed to lower dollar swap rates in a bid to provide more liquidity
to domestic banks they really took off. Economic data was also positive so at
the open the market took off and the market held gains all day with the Dow
making highs at the close of +500.00 points, S&P 500 +52.00 points and the
Nasdaq +110.00 points.
At the close the Dow was up by +490.00 points to 12,046.00, S&P
500 +52.00 points to about 1247.00, S&P 100 +23.00 points to 562.00 and
the Nasdaq Composite +105.00 points to about 2620.00. Oil rallied today but
closed well off of its highs up +$.60 to finish the day around the $100.00 level.
Private-sector payrolls increased +206,000 in November, the largest
gain since last December, led by the service-producing sector and small businesses,
according to the ADP employment report. The October level was revised up to
+130,000 from a prior estimate of +110,000. Markets look to ADP's report on
private-sector payrolls to provide some guidance on the main employment number,
which will be released Friday and includes information on both private- and
public-sector payrolls.
Economists expect the numbers to be up +125,000 in November, compared
with +80,000 in October. Analysts also expect the unemployment rate to remain
at 9.0%.Outplacement consulting firm Challenger, Gray & Christmas said -42,474
planned layoffs were announced in November, down -0.7% from October's total.
That's the second straight drop after September's 28-month high of 115,730.
At first it sounds encouraging, but digging deeper into the report you see that
cuts in 2011 have already surpassed last year's total, according to their report.
The report noted that jobs losses are up +13% overall and now total 564,297,
already more than 2010's full-year total of 529,973 and we still have to get
through December.
The productivity of workers in the third quarter was revised down to
a +2.3% increase from an initial reading of +3.1%. Economists had expected productivity
to be revised down to +2.5%. A combination of slower output growth and higher
hours accounted for the downward revision. The government said real output of
goods and services, which adjusts for inflation, rose +3.2% in the third quarter
instead of +3.8% as originally estimated. Hours worked, meanwhile, rose +0.8%
last quarter instead of an initial reading of +0.6%. Unit-labor costs fell -2.5%
instead of -2.4% as initially reported. Economists expected the decline in unit-labor
costs to be 2.3%. Hourly wages adjusted for inflation fell -3.2% last quarter,
larger than the initial estimate of a -2.4% drop.
Tuesday, November 29, 2011 4:03 p.m est.
The market started the day mixed seeing slight lows before rallying
with the Dow seeing highs of +100.00 points, S&P 500 +12.00 points and the
Nasdaq +20.00 points. Midday it became mixed once again but the final hour saw
selling take hold and the market closed mixed. At the close the Dow was up by
+33.00 points to 11,555.00, S&P 500 +3.00 points to about 1195.00, S&P
100 +2.00 points to 539.00 and the Nasdaq Composite -12.00 points to about 2516.00.
Oil continued higher closing up +$1.60 to finish the day around the $100.00
level.
Consumer confidence jumped up to 56% in November, reaching the highest
level since July, on improved expectations and views on the present economy,
the Conference Board reported. The index rose more than 15 points, the largest
gain since 2003 from an upwardly revised 40.9% in October. A prior estimate
for confidence in October had the level at 39.8%. With improving employment
figures and lower gas prices, economists had expected a reading of 45% for November,
with the overall gain somewhat offset by volatility in stocks and Europe, as
well as gridlock over budget cuts. Despite the confidence gain in November,
consumers remain concerned about jobs, and confidence readings are at relatively
low levels, generally when the economy is growing at a good clip, confidence
readings are at least 90% plus.
Home prices took a fall in September, according to a key index, ending
a string of five monthly gains as the housing market continues to struggle to
generate momentum. The S&P/Case-Shiller 20-city composite index fell -0.6%
in September to take the year-on-year decline in home prices to 3.6%. The worse-than-expected
drop limited third-quarter price appreciation to a mere +0.1%. Only three cities,
New York, Portland and Washington D.C., saw monthly gains, and another three
cities, Atlanta, Las Vegas and Phoenix, registered new lows. “The markets
are fairly thin, and the relative lack of closed transactions might be exacerbating
the downside,” said David Blizer, chairman of the index committee at S&P
Indices. While the collapse of prices seen in 2007 to 2009 “seems to be
behind us,” Blitzer said any chance for a sustained recovery will probably
need a stronger economy. The slight third-quarter advance put home prices back
where they were in the first quarter of 2003. Home prices are down -31% from
their peak in 2006. Separately, CoreLogic reported that 10.7 million, or 22.1%,
of all residential properties with mortgages were in negative equity at the
end of the third quarter, which compares to 22.5% at the end of the second quarter.
Monday, November 28, 2011 4:03 p.m est.
Yeah, the best news ever happened today!!! Barney Frank said he is
retiring instead of seeking re-election!!! Finally the guy that created the
entire housing debacle is gone, thank goodness!!!
I don’t think that's why the market rallied so hard today but
I wish it was!!! The main reason is because the EU made some more promises over
the weekend about fixing their problems and their were record retail sales for
Black Friday this past weekend. The Dow saw highs of +325.00 points, S&P
500 +38.00 points and the Nasdaq +90.00 points. The final hour saw some selling
occur as the rally our of the gates was so strong but most of the gains were
held right into the close. At the close the Dow was up by +291.00 points to
11,523.00, S&P 500 +34.00 points to about 1193.00, S&P 100 +12.00 points
to 535.00 and the Nasdaq Composite +86.00 points to about 2527.00. Oil rallied
strongly today closing up +$1.45 to finish the day around the $98.00 level.
It wasn’t surprising to see the rally today as the market had
been down seven days in a row and was incredibly oversold. The test will be
how we end the week. So far the Dow has been up triple digits about 48 times
this year and down about the same amount which is amazing but is one reason
we have done so well with our style of trading this year. As we are about to
move into the final month of the year for trading we’ll likely see the
volatility quiet down as there is going to be strong pressure by the under achieved
managers to help scrape something together by yearend. For now we’ll see
how the week ends to prove if were seeing a short term bottom or not.
Sales of new single-family homes rose +1.3% in October to an annual rate of
307,000. Sales in September were revised down to 303,000 from an original reading
of 313,000. Economists had expected new home sales to climb to an annual rate
of 320,000 on a seasonally adjusted basis. The median sales price fell -$1,000
to $212,300. The supply of new homes on the market dropped slightly to 6.3 months.
Sales of new homes are +8.9% higher compared to one year ago, but the housing
market remains mired in its worst slump in modern times.
Wednesday, November 23, 2011 4:03 p.m est.
Want to wish everyone a very happy Thanksgivings, a time for us all
to be incredibly thankful for the wonderful blessing we have received! Yesterday
the market remained under pressure but by the close it was only a slight loss.
Today it hit its six straight down day with it falling the hardest likely because
of the upcoming holidays. The market is closed tomorrow and only open a half
day on Friday which by the way means I won’t be reporting till Monday
unless there is some big surprise on Friday to report. The biggest reason for
the fall today was that a bond auction for Germany didn’t turn out that
well indicating that even EU’s main leader is under pressure with bond
yields continuing higher. One thing that was very interesting today however
was that Irelands credit rating was moved back to stable because of all of the
austerity programs they have stuck to the past year and they are actually forecasting
that their economy will grow in 2012!
The Dow saw lows of -210.00 points, S&P 500 -23.00 points and the
Nasdaq -60.00 points and then after moving back and forth for the rest of the
day the market sold off into the close making slightly new lows. At the close
the Dow was down by -249.00 points to 11,547.00, S&P 500 -23.00 points to
about 1193.00, S&P 100 -11.00 points to 537.00 and the Nasdaq Composite
-50.00 points to about 2523.00. Oil closed down -$1.80 to finish the day around
the $96.00 level.
This morning it was reported that Jobless Claims rose +2,000 to a seasonally
adjusted 393,000. Economists had expected a level of 390,000. Claims for the
prior week were revised to 391,000 from an earlier estimate of 388,000. The
average of new claims over the past four weeks, fell -3,250 to 394,250, reaching
the lowest level since early April. Continuing claims rose +68,000 to 3.69 million.
The four-week average for these claims fell -2,250 to 3.67 million, the lowest
level since October 2008. A total of 6.73 million people received some kind
of state or federal benefits, down -45,000 from the prior week.
Consumer spending rose a modest +0.1% last month, while personal incomes
rose a faster +0.4%, the Commerce Department reported. Economists had forecast
spending to rise by +0.3% and income by +0.2%. As a result, the personal savings
rate rose to +3.5% of disposable income, the money leftover after paying taxes,
from +3.3% in September. Inflation, meanwhile, fell -0.1% in October, putting
its increase over the past 12 months at +2.7%. The core PCE, which excludes
volatile food and energy costs, rose +0.1%. Economists called for a +0.1% increase.
Over the past year, core PCE inflation has risen a smaller +1.7%. In September,
Americans boosted spending +0.7%, even though their incomes rose only +0.1%,
revised data showed.
Orders for long-lasting Durable goods fell -0.7% in October, largely
because of weaker demand for commercial aircraft. Bookings for electrical equipment
and computers also fell. Economists had expected orders to drop -1.5%. If the
transportation sector is excluded, however, orders actually rose +0.7%. Bookings
for transportation equipment, a particularly volatile category, fell -4.8% last
month. Orders for commercial aircraft was down -16.4%. Orders minus defense
rose +0.2%. Orders for core capital goods, which excludes defense and transportation,
fell -1.8% last month. Shipments of durable goods rose +1.3% to mark the fifth
increase in the past six months.
Consumer sentiment has risen to the highest since June, while remaining
at relatively low levels, according to data released from the University of
Michigan and Thomson Reuters. A gauge of consumer sentiment hit 64.1% in the
final reading for November, the highest level since June, compared with 60.9%
in October. A preliminary reading for November pegged the gauge at 64.2%. Last
year, however, the index stood at 71.6%.
Economists had expected a final November result of 65%, with consumers
somewhat cheered by lower gas prices, but concerned about stock volatility.
The sentiment gauge, which covers how consumers view their personal finances
as well as business and buying conditions, averaged about 87% in the year before
the start of the most recent recession. Consumer views on current conditions
and their expectations rose in November with he current-conditions gauge rising
to 77.6% in November from 75.1% in October. The expectations barometer increased
to 55.4% in November from 51.8% in October.
Monday, November 21, 2011 4:03 p.m est.
The market was sharply lower this morning as worries about the EU continue
to persist and the supposed super committee said that they were unable to come
to an agreement to balance the budget and cut the deficit. At one point the
Dow saw lows of -350.00 points, S&P 500 -34.00 points and the Nasdaq -75.00
points but was able to rally a bit into the close. This is a shortened trading
week and has generally been to the upside and with the oversold condition of
the market and the fact that the news is now out about the government there
is a chance that by the end of the week we either see the market higher or at
the least flat.
At the close the Dow was down by -249.00 points to 11,547.00, S&P
500 -23.00 points to about 1193.00, S&P 100 -11.00 points to 537.00 and
the Nasdaq Composite -50.00 points to about 2523.00. Oil closed down -$.70 to
finish the day around the $97.00 level.
The National Association of Realtors said sales rose +1.4% to a seasonally
adjusted annual rate of 4.97 million from 4.9 million in September. Economists
had anticipated a decline to an annual rate of 4.8 million in October. The September
figure was marginally downward revised by 100,000. The median price of homes
dropped -4.7% from year-ago levels to $162,500. Inventories declined -2.2% to
3.3 million, reflecting 8.0 months of supply at current sales rates. This is
kind of good news and points to the progress on inventories as a hopeful sign.
Friday, November 18, 2011 4:03 p.m est.
It was a pretty quiet expiration today with the Dow seeing lows of
-25.00 points, S&P 500 -5.00 points and the Nasdaq -25.00 points but then
it saw some upside with the Dow up +75.00 points, S&P 500 +4.00 points and
the Nasdaq +5.00 points. The market is in wait mode as Europe is still dealing
with its problems and the supposed super committee needs to make a decision
about the budget by next Wednesday. There is a good chance that volatility will
pick up once again depending on their decision about what they will do but we
are moving into the final expiration cycle of the year and I'm sure the window
dressers are waiting to push the market so it looks good on the books.
At the close the Dow was up by +25.00 points to 11,796.00, S&P
500 -.50 points to about 1215.00, S&P 100 -.30 points to 548.00 and the
Nasdaq Composite -15.00 points to about 2573.00. Oil closed down another -$1.00
to finish the day around the $98.00 level.
Data suggest that the risk of recession has receded, the Conference
Board said as it reported that its index of leading economic indicators grew
+0.9% in October. the largest growth since February, led by gains in building
permits. The index "is pointing to continued growth this winter, possibly
even gaining a little momentum by spring," said Ken Goldstein, a Conference
Board economist, in a statement. Economists had expected growth of +0.7%. The
Conference Board revised September's result down to +0.1% from a prior estimate
of +0.2%. The LEI is a weighted gauge of 10 indicators that are designed to
signal business cycle peaks and troughs. Among the 10 indicators that make up
the LEI, nine made positive contributions in October, led by building permits,
the interest-rate spread, and average weekly manufacturing hours. The only negative
contribution came from faster supplier deliveries.
Thursday, November 17, 2011 4:03 p.m est.
So the debt of America went over the $15 trillion mark yesterday. Currently
it costs about $1 billion a week just to pay for the debt. The supposed super
committee is meeting and more news is coming out as they must make a deal by
November 24th otherwise automatic cuts will come to the budget. There are $1.2
trillion over the next 10-years in "savings" or "spending cuts",
being talked about which will likely lead to higher taxes for working people,
rich or poor. What's not clear is what will be cut and how much taxes will go
up, either if the Super Committee comes to an agreement, or if the automatic
$1.2 trillion cuts go into effect if the group fails. Some things sound just
like a politician, such as massaging budget assumptions and painting rosy economic
scenarios. Others include taking credit for "saving" money on wars
that are ending and putting off until next year what lawmakers don't want to
deal with now." Yet, as the Journal points out "none of these efforts
make the fundamental policy changes needed for a long-term budget fix,"
while "Any perception of gimmickry could undermine the bill's credibility
especially among tea-party conservatives and on Wall Street, possibly risking
another hit to the U.S.'s credit rating." The big question is whether Washington
can even make cosmetic changes to its arrogance and self-interest driven, lobbyist
fueled pyramid scheme!!! Yesterday the market sold off about -1.5% as worries
about the EU continued and questions about the future were kicking around. Strangely
oil rallied hard to close well over the $100 level, up about $3.20. Many analysts
thought it was because of the Trans Canada pipeline going down from Alberta
Canada to the Gulf being canceled but that seemed like a loose reason to rally
that much. Today seemed to prove the point as oil sold off strongly back below
the $100 level, once again. Stocks followed suit as they were down hard all
day except for a brief stint where the Dow made it barely into the positive
area first thing in the morning. The Dow saw lows of -230.00 points, S&P
500 -28.00 points and the Nasdaq -65.00 points.
At the close the Dow was down by -135.00 points to 11,771.00, S&P
500 -21.00 points to about 1216.00, S&P 100 -10.00 points to 546.00 and
the Nasdaq Composite -52.00 points to about 2588.00. Oil closed down -$3.70
higher to finish the day around the $99.00 level. Tomorrow is expiration and
once again we are going to see very nice profits. As we move into the final
trading expiration cycle of the year the question will be all of the problems
out there will continue or will a year end rally to make things look "okay"
transpire!! Thank goodness we'll just be following our Program Numbers!!
Jobless Claims fell last week by -5,000 to a seasonally adjusted 388,000,
the lowest level since early April. Economists had expected a rise to 397,000.
Claims in the prior week were revised up to 393,000 from an original reading
of 390,000. The average of new claims over the past four weeks, meanwhile, dropped
by -4,000 to 396,750, also the lowest level since early April. Continuing claims
declined by -57,000 to 3.61 million, and a total of 6.77 million
New construction of Houses fell only slightly in October after a strong
gain in the previous month. Starts fell -0.3% in October to a seasonally adjusted
628,000 annualized units, stronger than the 605,000 pace expected by economists.
Starts in September were revised to a +7.6% gain to 630,000 units compared with
the initial estimate of a +15% increase to 658,000 however. Starts of new single-family
homes rose in October after falling in the prior month. Starts of large apartment
units fell last month after a big gain in September. Building permits, a leading
indicator of housing construction, surged +10.9% to a seasonally adjusted annual
rate of 653,000. This is the highest level of permits since March 2010.
Yesterday it was reported that Consumer prices fell a seasonally adjusted
-0.1% in October mainly because of falling gas costs, but "core" inflation
edged up +0.1%. The core data strips out volatile food and energy categories
and is used the Fed to guide its interest-rate decisions because its not important
that people eat. Economists had forecast CPI to be unchanged, with a +0.1% increase
in the core rate. Consumer prices have risen an unadjusted +3.5% over the past
12 months, down from +3.9% in September. The core rate has risen at a slower
+2.1% pace over the 12 months ended in October, but that was up from +2% in
September. Gas costs dropped -3.1% last month but they are on the rise the last
month so look out. Food prices rose +0.1%.
The output of the nation's factories, mines and utilities rose +0.7%
in October, the Fed said. The October gain was the biggest since July and was
stronger than the +0.4% increase expected by analysts. However, industrial output
in September was revised to a decline of -0.1% compared with the initial estimate
of a +0.2% gain. Factory activity alone rose +0.6% in October after a +0.2%
increase in September. Mining and gas exploration had a strong +2.3% gain in
October. Capacity utilization - a gauge of slack in the economy - rose to 77.8%
in October from 77.3% in September. Capacity utilization has been rising slowly
and is at its highest level since July 2008.
Wednesday, November 16, 2011
Wow, you know I’m thinking of joining the Occupy Wall Street
people after hearing the news this morning. Being a Canadian and living here
I must say I am very proud to be Canadian today! As I mentioned the other day
with MF Global America going bankrupt because it wanted to keep any of its cash
away from the American affiliate MF Global also moved into bankruptcy. It then
proceeded to make sure that all of their clients were receiving “all”
of their cash and trades and this week it is finishing that promising with the
move to Dominion Securities! Never thought I would be dealing with them as I
worked with them in the 80’s day trading the S&P 100! Anyhow, I just
read that there is a possible $40 million shortfall in investor funds which
you would think at first is bad news!! I know what your thinking right away
but guess what, their insurance fund the Canadian Investor Protection Fund is
putting up the missing money and STILL GIVING BACK EVERYTHING to those investors
right away!!! Their trustee “requested short-term liquidity of up to $40-million
in order for those transfers to occur,” rather than incur more delays
waiting for the funds tied up in the U.S. and Britain to become available. CIPF’s
board approved the request.”
The key point that they said about this is that: “once those
U.S. and British funds are freed up, CIPF would be reimbursed for any amounts
KPMG draws down under the liquidity request. In the court ruling Monday that
approved the bulk transfer of accounts to RBC Dominion, CIPF was granted top
priority among creditors to recover whatever funds it provides to KPMG to distribute
to customers. They also said CIPF would fund the liquidity requirements out
of its $400-million “liquid bond portfolio” – the nest egg
the industry fund has accumulated to backstop investor losses in the event of
an insolvency of a CIPF member firm, such as MF Global Canada. She said that
in addition to the fund’s bond portfolio, it also has a $100-million credit
line and an insurance policy that would pay off $116-million in the event the
fund had to pay out $100-million or more in a member insolvency.”
You know this isn’t rocket science, everyone knows that the American
SIPC has loads of cash, the CME has offered up to $300 million cash for losses
so why isn’t the trustee, SIPC in the States just letting everyone have
their cash back and then go looking to get their cash back like the Canadians?
America has become a nation of regulators, regulations, lobbyists and lawyers
when it comes to big business. Its not about the client its about the greed
and what can “I” get out of this. Canada appointed an accounting
firm for its trustee while America awarded that position to a lawyer who is
making over $800 per hour so of course he’s not going want to give those
clients their money to fast because he says he needs to “account for the
missing funds before he can give out any additional funds.” Anyhow, there
is some good news for American MF Global clients this morning as Gidden is going
to court to move some more cash to clients because pressure is mounting as clients
who were completely in cash haven’t received a dime so it will likely
flow out to everyone. Once again I encourage you to write, e-mail anyone you
can about the difference between the two countries and even contact the news.
Things need to change and “We the people” need to take back our
rights!
Tuesday, November 15, 2011 4:03 p.m est.
The market started the day slightly lower but it turned midday after
Europe closed with the Dow seeing highs of +80.00 points, S&P 500 +10.00
points and the Nasdaq +35.00 points but selling in the final hour pulled the
market back quite a bit going into the close. At the close the Dow was up by
+17.00 points to 12,096.00, S&P 500 +6.00 points to about 1258.00, S&P
100 +3.00 points to 565.00 and the Nasdaq Composite +29.00 points to about 2686.00.
Oil was up again closing +$1.25 higher to finish the day around the $99.50 level.
Producer Prices dropped by the largest amount in 20 months as a big
drop in gas prices as well as the introduction of new-model-year vehicles offset
a rise in the cost of eggs, poultry and medications, according to data. The
producer price index fell a seasonally adjusted -0.3% last month. Economists
had predicted no change but that will change next month anyhow as oil itself
has rallied over +30% this month alone. Wholesale prices were dragged lower
as a -1.4% drop in energy prices offset a+0.1% gain for finished consumer foods.
Minus those two categories, core wholesale prices were flat, below the +0.1%
gain forecast by economists. Over the past year, wholesale costs have risen
+5.9%, with the core increasing a lesser +2.8%.
Retail sales climbed +0.5% in October as Americans continued to spend
at an accelerated pace. Economists expected an increase of +0.2% on a seasonally
adjusted basis. The rise in retail sales was driven by higher purchases at internet
stores such as Amazon and electronics and appliance stores such as Best Buy.
Sales of autos rose just +0.4% after a big surge in September while gasoline
sales fell. Excluding the auto sector, retail sales increased +0.6%, compared
to the forecast calling for a +0.1% gain. Sales for September, which were originally
reported as up +1.1%, were unchanged. Over the past 12 months, retail sales
have risen +7.2%.
The Empire State manufacturing index moved slightly into positive territory
in November after five months in negative territory, the New York Fed said.
The Empire state index rose to +0.6 in November from negative -8.5 in October.
Readings above zero indicate expansion, with higher numbers of firms reporting
that conditions had improved. Economists expected the index to remain at negative
-3% in November. Despite the improvement in the headline, underlying conditions
were mixed. The new orders index fell to negative -2.1 in November from -0.2
in October, while the shipments index rose to +9.4 from +5.3. Inventories fell
to negative -12.2 in November from negative -9.0 in the prior month. The employee
index fell to negative -3.7 in November from -3.4 in the prior month while the
average workweek was positive for the first time in six months. The prices paid
index fell to its lowest level in nearly two years. A reading of expected conditions
six-months ahead strengthened in November to its highest reading since May.
Thursday, November 17, 2011 4:03 p.m est.
So the debt of America went over the $15 trillion mark yesterday. Currently
it costs about $1 billion a week just to pay for the debt. The supposed super
committee is meeting and more news is coming out as they must make a deal by
November 24th otherwise automatic cuts will come to the budget. There are $1.2
trillion over the next 10-years in "savings" or "spending cuts",
being talked about which will likely lead to higher taxes for working people,
rich or poor. What's not clear is what will be cut and how much taxes will go
up, either if the Super Committee comes to an agreement, or if the automatic
$1.2 trillion cuts go into effect if the group fails. Some things sound just
like a politician, such as massaging budget assumptions and painting rosy economic
scenarios. Others include taking credit for "saving" money on wars
that are ending and putting off until next year what lawmakers don't want to
deal with now." Yet, as the Journal points out "none of these efforts
make the fundamental policy changes needed for a long-term budget fix,"
while "Any perception of gimmickry could undermine the bill's credibility
especially among tea-party conservatives and on Wall Street, possibly risking
another hit to the U.S.'s credit rating." The big question is whether Washington
can even make cosmetic changes to its arrogance and self-interest driven, lobbyist
fueled pyramid scheme!!! Yesterday the market sold off about -1.5% as worries
about the EU continued and questions about the future were kicking around. Strangely
oil rallied hard to close well over the $100 level, up about $3.20. Many analysts
thought it was because of the Trans Canada pipeline going down from Alberta
Canada to the Gulf being canceled but that seemed like a loose reason to rally
that much. Today seemed to prove the point as oil sold off strongly back below
the $100 level, once again. Stocks followed suit as they were down hard all
day except for a brief stint where the Dow made it barely into the positive
area first thing in the morning. The Dow saw lows of -230.00 points, S&P
500 -28.00 points and the Nasdaq -65.00 points.
At the close the Dow was down by -135.00 points to 11,771.00, S&P
500 -21.00 points to about 1216.00, S&P 100 -10.00 points to 546.00 and
the Nasdaq Composite -52.00 points to about 2588.00. Oil closed down -$3.70
higher to finish the day around the $99.00 level. Tomorrow is expiration and
once again we are going to see very nice profits. As we move into the final
trading expiration cycle of the year the question will be all of the problems
out there will continue or will a year end rally to make things look "okay"
transpire!! Thank goodness we'll just be following our Program Numbers!!
Jobless Claims fell last week by -5,000 to a seasonally adjusted 388,000,
the lowest level since early April. Economists had expected a rise to 397,000.
Claims in the prior week were revised up to 393,000 from an original reading
of 390,000. The average of new claims over the past four weeks, meanwhile, dropped
by -4,000 to 396,750, also the lowest level since early April. Continuing claims
declined by -57,000 to 3.61 million, and a total of 6.77 million.
New construction of Houses fell only slightly in October after a strong
gain in the previous month. Starts fell -0.3% in October to a seasonally adjusted
628,000 annualized units, stronger than the 605,000 pace expected by economists.
Starts in September were revised to a +7.6% gain to 630,000 units compared with
the initial estimate of a +15% increase to 658,000 however. Starts of new single-family
homes rose in October after falling in the prior month. Starts of large apartment
units fell last month after a big gain in September. Building permits, a leading
indicator of housing construction, surged +10.9% to a seasonally adjusted annual
rate of 653,000. This is the highest level of permits since March 2010.
Yesterday it was reported that Consumer prices fell a seasonally adjusted
-0.1% in October mainly because of falling gas costs, but "core" inflation
edged up +0.1%. The core data strips out volatile food and energy categories
and is used the Fed to guide its interest-rate decisions because its not important
that people eat. Economists had forecast CPI to be unchanged, with a +0.1% increase
in the core rate. Consumer prices have risen an unadjusted +3.5% over the past
12 months, down from +3.9% in September. The core rate has risen at a slower
+2.1% pace over the 12 months ended in October, but that was up from +2% in
September. Gas costs dropped -3.1% last month but they are on the rise the last
month so look out. Food prices rose +0.1%.
The output of the nation's factories, mines and utilities rose +0.7%
in October, the Fed said. The October gain was the biggest since July and was
stronger than the +0.4% increase expected by analysts. However, industrial output
in September was revised to a decline of -0.1% compared with the initial estimate
of a +0.2% gain. Factory activity alone rose +0.6% in October after a +0.2%
increase in September. Mining and gas exploration had a strong +2.3% gain in
October. Capacity utilization - a gauge of slack in the economy - rose to 77.8%
in October from 77.3% in September. Capacity utilization has been rising slowly
and is at its highest level since July 2008.
Monday, November 14, 2011 4:03 p.m est.
The market was lower today as European bond yields were making new highs once
again with the Dow seeing lows going into the final hour of -130.00 points,
S&P 500 -17.00 points and the Nasdaq -35.00 points before bouncing a bit
in the final hour to cut losses.
At the close the Dow was down by -75.00 points to 12,079.00, S&P
500 -12.00 points to about 1252.00, S&P 100 -5.00 points to 563.00 and the
Nasdaq Composite -22.00 points to about 2657.00. Oil was down closing -$.80
to finish the day around the $98.00 level.
Well it seems about every second day there is a claim that the money
has been found that MF Global is missing and the good news is that this one
is only being said by one reporter so there’s a possibility its true.
Nonetheless the trustee for the case says that he must account for every cent
that is possibly missing before he can give out any money but also said that
it may be “close at hand” in finding out! Another matter is that
the CME is starting to make an effort on making things right about MF Global
as it says it will put up $300 million of the missing $593 million dollars.
This is nice and it should as MF Global was a supposedly a "highly regulated"
entity with its regulators being the CFTC and the supposedly "self-regulating"
futures exchange CME Group. They actually brag about how they protect clients
money in their advertisements!
“Clearing members must calculate segregation and secured requirements
and ensure compliance with capital requirements on a daily basis. CME Clearing
monitors intra-day price movements and trading activity throughout the trading
session. To assess the impact of these price changes on clearing members, intra-day
mark-to market calculations are performed on clearing member positions and reviewed
by CME Clearing throughout the day and overnight. Additionally, CME Clearing
monitors its clearing member firms’ settlement variation and performance
bond activities at non–CME cleared exchanges and clearing organizations
daily. The risk management team may contact the exchanges or clearing organizations
to follow up on this activity.”
This is all great but if the CME really does all that it says it does,
how in the world did $593 million dollars go missing in the first place? How
did so much cash manage to slip out of supposedly segregated client accounts
and into MF Global's corporate account? Obviously it should have been doing
an automated computer-based audit everyday as I’m sure it would have been
relatively easy to set up.
The overall picture appears to be one of negligence on the part of
CME with respect to its regulatory duties and obligations and maybe that’s
why they are willing to put up some cash, however I think they should be putting
it all up if it is missing. The thing is that the CME Group in my view has a
contractual duty that it created itself to reimburse customers for any and all
of their segregated fund losses because it promised to do so. The promise is
seems legally binding by them for every customer who opens an account with a
CME Group approved clearing member.
Specifically, CME's promise is as follows:
If a clearing member were unable to meet its financial obligations to CME Clearing
and a default occurred in its customer segregated or customer secured account,
CME Clearing may act immediately to:
...Apply the clearing member’s guarantee fund and house performance bond
deposits to the failed obligation...
The CME Group wrote up the pamphlet from what I’m talking about
for the purpose of convincing customers to have confidence in the system and
to do business with it. This is why its sad that they didn’t immediately
credit customer accounts with the full amount of all cash, even if it means
dipping into their emergency fund to do that above the $300 million they’ve
mentioned. They make about $1.5 billion per year anyhow and and this would help
to convince people to continue to do business with them and once the cash is
found they can get reimbursed instead of making people wait, especially those
who were prudent and went to cash just before they went bankrupt.
I think on that part it is negligent of the trustee who must have an
idea by now of how much isn’t missing and at least give 80% of the peoples
money back! Once again I look North and see that Canada now has everything straightened
out and clients are getting their trades and cash back tomorrow with a new brokerage.
They the reason this is taking so long is because of MF Global’s atrocious
book keeping but they have been stuck at that $593 million or about 10% of all
funds for awhile now!
Another reason it may be taking so long is the trustee’s $891
per hour cost! Anyhow I encourage everyone to e-mail your government representatives,
the CME,CFTC, SIPC etc even if you don’t have a futures account with MF
so this won’t happen again and let them know that this is starting to
take way to long and will be bad for business unless clients start to receive
a larger portion of their cash to make things right!
Friday, November 11, 2011 4:03 p.m est.
Today is Remembrance Day and Lest we shouldn’t forget what the brave men
and women did to grant us our freedom from years past and present. Please tell
one of them today how much you appreciate them for being willing to give their
lives for our freedom. Out of all the days of the year I wish this was a world
wide holiday as there would be no stock or bond markets if we weren’t
granted this freedom years ago and I encourage you to send an e-mail to the
NYSE to make it a holiday.
The market was higher today as there was no news from Europe with the
Dow seeing highs of +290.00 points, S&P 500 +29.00 points and the Nasdaq
+60.00 points however it was on dwindling volume likely because most traders
were observing Remembrance day. At the close the Dow was up by +260.00 points
to 12,154.00, S&P 500 +24.00 points to about 1264.00, S&P 100 +10.00
points to 568.00 and the Nasdaq Composite +54.00 points to about 2679.00. Oil
was up closing +$.90 higher to finish the day around the $99.00 level. As we
head into expiration next week the volatility will likely continue as the problems
in Europe are far from over and investors will start to focus on the government’s
committee to make the much needed cuts to get the deficit down by November 23rd,
the due date before mandatory cuts and taxes raised etc.
Consumer sentiment rose to 64.2% in the preliminary reading for November,
compared with a final October reading of 60.9%, on the data from the University
of Michigan and Thomson Reuters. Economists had expected a November result of
63%, with consumers cheered by higher equity prices and lower unemployment-insurance
claims. The sentiment reading, which covers how consumers view their personal
finances as well as business and buying conditions, averaged about 87% in the
year before the start of the most recent recession. Economists watch sentiment
data to get a feel for the direction of consumer spending.
Thursday, November 10, 2011 4:03 p.m est.
Interesting: According to The Wall Street Journal: "Retirement trust funds
created to cover billions of dollars in medical costs for unionized workers
and their families are running short, forcing the funds to cut costs, trim benefits,
and ask retirees and companies to pony up more cash."
Of course the market had to rally today because it was down so much
yesterday and the fact that in the shortest of times it was oversold. The Dow
saw highs of +190.00 points, S&P 500 +18.00 points and the Nasdaq +20.00
points. It didn’t last though but it was only the Nasdaq that turned into
the red with lows of -20.00 points before turning around a bit in the final
hour.
At the close the Dow was up by +113.00 points to 11,894.00, S&P
500 +11.00 points to about 1240.00, S&P 100 +5.00 points to 558.00 and the
Nasdaq Composite +4.00 points to about 2625.00. Strangely oil was up once again
closing up +$2.00 to finish the day around the $98.00 level.
Here is an interesting statistic: Pre election years for the stock
market have been up every year except for 1931. One year wouldn’t normally
mean anything except that was also a year ending in a 1 and other 1 ending decades
also saw pressures on the market! 1931 was down -53% but it too had a great
rally in October and up from Oct 5th to Nov 9th. If it sounds similar the current
low was October 4th and then we fell hard after November 8th.
Jobless claims fell by -10,000 to 390,000, below the 398,000 forecast
and the lowest level since April. The four-week average dropped by -5,250 to
400,000, the lowest level since April 16th.
The trade deficit narrowed by -4% in September to $43.1 billion. The
trade deficit was below the consensus forecast of economists of a deficit of
$45.4 billion. The government also revised the deficit in August to $44.9 billion
from $45.6 billion. The narrower deficit should add to third quarter GDP. Exports
rose faster than imports in September and hit a new record level. Exports rose
+1.4% in September after a +0.1% gain in August. Imports rose +0.3% after a
-0.2% decline in the prior month. The trade deficit with China remained virtually
unchanged at $28.06 billion compared with the same month last year.
Wednesday, November 9, 2011 4:03 p.m est.
Yesterday I noted that “One interesting aspect about this rally was that
it remained higher even though the Italian bond moved to a new higher yield
and the Euro was flat. It will be interesting to see how we end the week.”
I knew it seemed strange that the U.S dollar wasn’t rallying yesterday
with those bonds staying up and with the Italian bond now moving above 7.00%
everyone is saying the EU is moving into crisis mode. The dollar was up hugely
today and thus the reason for the market to be down so hard.
The Dow saw lows of -440.00 points, S&P 500 -50.00 points and the
Nasdaq -110.00 points. Just as anticipated once the Greece problem was masked
over and a more important country such as Italy is looking to be in major trouble,
the market fell pretty hard. The 10-year yield on their bond closed around the
7.25% level which is extremely high but with an almost $2 trillion dollar debt
and GDP the past 15-years averaging less than 1%, its not surprising. The key
thing to note is that America is facing $15 trillion plus debt and so far our
bond yields are moving down as people seek safety but eventually,,,, will America
being facing the situation!!!
At the close the Dow was down by -390.00 points to 11,781.00, S&P
500 -47.00 points to about 1229.00, S&P 100 -20.00 points to 553.00 and
the Nasdaq Composite -106.00 points to about 2622.00. Oil closed down -$1.00
to finish the day around the $95.50 level.
Inventories at Wholesalers fell -0.1% in September, but they were up
+11.9% from the prior year which isn’t a good longer term sign as we move
into the Christmas season. Sales of wholesalers rose +0.5% in September, while
the inventory-to-sales ratio moved to 1.15.
Tuesday, November 8, 2011 4:03 p.m est.
The market was up and down today as Italy was voting on in its budget plans.
When it appeared that there wasn’t going to be a vote the market fell
with the Dow seeing lows of -70.00 points, S&P 500 -7.00 points and the
Nasdaq -20.00 points. When it was finally passed but it wasn’t a majority
the market waited awhile before deciding to rally or not and when it did the
Dow saw highs of +120.00 points, S&P 500 +17.00 points and the Nasdaq +35.00
points. The market continues to move higher as volume continues to move lower
and lower and is getting itself into an overbought condition as it approaches
highs made last week. One interesting aspect about this rally was that it remained
higher even though the Italian bond moved to a new higher yield and the Euro
was flat. It will be interesting to see how we end the week.
At the close the Dow was up by +102.00 points to 12,170.00, S&P
500 +15.00 points to about 1276.00, S&P 100 +7.00 points to 573.00 and the
Nasdaq Composite +32.00 points to about 2728.00. Oil closed with a gain of +$1.00
to finish the day around the $97.00 level.
Monday, November 7, 2011 4:03 p.m est.
The market was under pressure with Italy now being under pressure about its
austerity plans but eventually it was ignored with the Dow seeing highs of +70.00
points, S&P 500 +7.00 points and the Nasdaq +10.00 points. It couldn’t
hold though as there are still questions about what’s going on and the
fact that Italian bonds hit new record high yields. The Dow saw lows of -60.00
points, S&P 500 -8.00 points and the Nasdaq -35.00 points. The market came
back though to basically close at the highs of the day as it seemed that the
EU was getting things under control and Greece announced a possible new Prime
Minister.
At the close the Dow was up by +85.00 points to 12,068.00, S&P
500 +8.00 points to about 1261.00, S&P 100 +4.00 points to 566.00 and the
Nasdaq Composite +9.00 points to about 2695.00. Oil closed with a gain of +$1.30
to finish the day around the $96.00 level.
One of the things that is also hurting the market is the American MF
Global mess that continues to go on. Interestingly, once again Canada is shining
as its regulatory system has protected its clients. KPMG their bankruptcy trustee
says that once the books are done the cash is supposed to be returned to clients.
I wish my accounts were up here now!! Anyhow, since the American MF Global announced
their bankruptcy, traders have been unable to get cash out or close positions.
This is hard to believe in the futures industry and the fall out has been huge
with some traders because of it who trade in the commodity’s market. Finally
over the weekend accounts were moved to a new brokerage with trades still on
and were able to receive about 60% of their margin or about 50% of their cash
balances. This haircut unfortunately put trades into a margin call this morning
however so although it supplied some cash I’m sure all it did for some
people was to help cover losses. This is where I am really glad about the way
we trade as time is working for us not against us!
Last Monday it was determined that the best way to protect client assets
was through bankruptcy. This made more sense in light of the news that customer
money may have gone missing to the tune of $600 million. In bankruptcy, the
SIPC can seize some of MF Global’s $40 billion in assets and put clients
at the head of the list of creditors to make sure that all of its clients are
made whole, while in a sale, they would have had no control over that. In this
light, bankruptcy, while temporarily freezing access to client funds –
may be the best way for clients to insure the return of their funds. Even just
a single $1 of misappropriated client funds is unacceptable and if this money
really is missing, so far to the tune of about $593 million, down from $900
million last Monday, it represents about 10% of the total segregated customer
funds. This should mean in an absolute worst case scenario where there is fraud
and the bankruptcy judge can’t get any of their assets to cover client
funds gone missing, each account would be looking at a reduction in their accounts
of around 10%. This is terrible but not the end of the world but the worst thing
is not knowing exactly what’s going on and when more money will be moved.
Listening to a regulatory analyst today he said that MF Global’s book
keeping was a massive mess and is hard to track but he said that it should be
finished in the next few days or by the end of the week for sure so hopefully
by next week things will be back to normal!
Friday, November 4, 2011 4:03 p.m est.
The market started the day lower once again as the employment data wasn’t
that good and questions remained about what the EU was going to do after the
G20 meeting ended with little results made. Lows were hit midday with the Dow
seeing -185.00 points, S&P 500 -22.00 points and the Nasdaq -45.00 points.
The market crawled back a bit in the final hour but still finished the day on
the downside.
At the close the Dow was down by -61.00 points to 11,983.00, S&P
500 -8.00 points to about 1253.00, S&P 100 -4.00 points to 562.00 and the
Nasdaq Composite -12.00 points to about 2686.00. Oil closed with a slight gain
of +$.30 to finish the day around the $94.00 level.
There were+80,000 jobs added in October and the unemployment rate edged
down to 9.0% from 9.1%. Economists had forecast a +100,000 increase in employment
and no change in the jobless rate. Although the increase in employment fell
short of expectations, government revisions showed sharply higher job growth
in September and August. Hiring in September was revised up to +158,000 from
+103,000 and job growth in August was revised up to +104,000 from +57,000. In
October though which is good news. Companies in the private sector hired +104,000
workers, but government cut -24,000 jobs to reduce the overall gain to +80,000.
Hourly earnings rose +0.2% and the workweek was unchanged at 34.3 hours. The
broader and more accurate unemployment rate fell to 16.2% from 16.5% in September
which is also good news. Slow and steady is the word....
Thursday, November 3, 2011 4:03 p.m est.
The market was up again today as the European Union decided to lower
interest rates a quarter of a point to 1.25% and investors now a days like lower
interest rates even more than growth because they said their economy seems to
be slowing down again. There was one blip during the rally after it was announced
that the Greek government may collapse and Jefferies, an investment bank was
halted because of questionable trades related the EU. This put the S&P 500
and Nasdaq in the red but in the end the final hour saw the Dow saw highs of
+230.00 points, S&P 500 +25.00 points and the Nasdaq +60.00 points.
At the close the Dow was up by +208.00 points to 12,045.00, S&P
500 +23.00 points to about 1261.00, S&P 100 +23.00 points to 566.00 and
the Nasdaq Composite +58.00 points to about 2698.00. Oil closed with a slight
gain of +$2.00 to finish the day around the $94.00 level.
Jobless Claims fell by -9,000 last week to 397,000 while economists
had expected new claims to fall to 400,000, on a seasonally adjusted basis.
Claims from two weeks ago were revised up to 406,000 from an original reading
of 402,000. The average of new claims over the past four weeks, fell by -2,000
to 404,500. Continuing Claims declined by -10,500 to 3.70 million. Continuing
claims are reported with a one-week lag.
The productivity of Businesses climbed +3.1% in the third quarter as
workers produced more goods and services in nearly the same amount of time.
Economists had expected productivity to increase by +3.7% in the third quarter.
Output climbed +3.8%, the fastest rate since the second quarter of 2010, while
hours worked rose a much smaller +0.6%. As a result, unit-labor costs fell -2.4%,
the biggest drop in six quarters. In the second quarter, meanwhile, productivity
was revised up to show a -0.1% decline compared to a previously stated -0.7%
decrease. Although hourly wages rose +0.6% in the third quarter, higher inflation
more than offset the increase. Inflation-adjusted wages fell -2.4%. In the past
12 months, productivity has risen at a 1.1% rate. Higher productivity is widely
regarded as the key to a rising standard of living because it tends to lead
to higher pay for workers and larger profits for companies.
Wednesday, November 2, 2011 4:03 p.m est.
The market was up today as investors decided to ignore what was going on with
the EU and the Dow saw highs of +220.00 points, S&P 500 +24.00 points and
the Nasdaq +45.00 points. After the Fed released its decision about leaving
interest rates alone but didn’t make any type of promise for a QE3 stimulus
package so it sold off a bit but still closed with a decent gain.
At the close the Dow was up by +178.00 points to 11,836.00, S&P
500 +20.00 points to about 1238.00, S&P 100 +8.00 points to 556.00 and the
Nasdaq Composite +33.00 points to about 2640.00. Oil closed with a slight loss
of -$.50 to finish the day around the $92.00 level.
By a 9-to-1 vote, the Fed voted to keep the target Fed funds rate at
a level between 0% and 0.25%, to continue its "Twist" program of shifting
$400 billion in its bond portfolio toward longer maturities and continue reinvesting
maturing principal payments into mortgage-backed securities. The Fed kept its
pledge that "exceptionally low levels" of rates are warranted at least
through mid-2013. "Economic growth strengthened somewhat," the Fed
statement said, but the unemployment rate will decline only gradually toward
levels that the Fed judges to be consistent with its dual mandate and there
are "significant downside risks" to the economic outlook. The three
Fed members who dissented from the prior two decisions, Richard Fisher, Narayana
Kocherlakota and Charles Plosser, voted with the majority, while Chicago Fed
President Charles Evans dissented as he called for additional policy accommodation.
Private-sector payrolls moderately increased in October, led by the
services-producing sector and small businesses, according to the ADP employment
report. Payrolls rose +110,000, as services employment gained +114,000 and goods-producing
employment fell -4,000. Economists had expected an overall gain of about +100,000.
“The recent trend in private employment is probably below a pace consistent
with a stable unemployment rate and reflects the sluggish pace of GDP growth
exhibited earlier this year,” said Joel Prakken, chairman of Macroeconomic
Advisers, which produces the report from anonymous payroll data supplied by
Automatic Data Processing Inc.
Small-business employment rose +58,000, compared with +53,000 for medium
businesses. Large-business employment fell -1,000. September’s growth
result was also revised higher, to an expansion of +116,000 for private-sector
payrolls from a prior estimate of +91,000. Markets look to ADP’s report
on private-sector payrolls to provide some guidance on the estimate for employment,
which will be released Friday and includes information on both private- and
public-sector payrolls. Analysts expect the Labor Department to report a slight
slowdown for employment, with overall employment up a weak +90,000 in October,
compared with +103,000 in September. Analysts also expect the nation’s
unemployment rate to remain at 9.1%.
Also out were that the number of planned job cuts announced in October
as compiled by outplacement firm Challenger Gray & Christmas fell to about
-43,000, the lowest since June. The biggest cuts were in the financial and government
sectors. Last month’s result is down 63% from September, but up +12.6%
from October 2010.
“Most of the government cuts this year were at the state level. We have
yet to see the full impact of mandated federal spending cuts,” said John
Challenger, chief executive of the firm bearing his name.
Tuesday, November 1, 2011 4:03 p.m est.
The market started the day down pretty hard as the Greek President decided that
they should have a referendum to see if they should accept the EU’s plan
for their country because they’re in such great condition they feel they
can do that! This is when you know that people are in denial! Anyhow, the Dow
saw lows of -320.00 points, S&P 500 -39.00 points and the Nasdaq -85.00
points. The final hour saw a bit of a comeback but it didn’t last long.
Then of course there was news out first thing this morning that MF Global had
been skimming money off of clients accounts to the tune of $700 million however
by the end of the day they say it was down to $100 million as there were still
trades going through and their lawyer said that everything was matching up in
accounting.
At the close the Dow was down by -297.00 points to 11,658.00, S&P
500 -35.00 points to about 1218.00, S&P 100 -15.00 points to 548.00 and
the Nasdaq Composite -77.00 points to about 2607.00. Oil closed with a loss
of -$1.00 to finish the day around the $92.00 level.
So far this is looking like a correction in an up market but with the
new old news out of the EU it will likely remain under pressure for some time
to come. Actually if you look at volume patterns it looked more like a counter
trend and not the real thing anyhow considering how overbought it was. We also
saw a +10% move in one month so a pullback shouldn’t be a surprise. With
the MF Global problem etc, there is also more and more evidence to show that
the U.S. stock market is an increasingly unattractive place to park savings
for the public. The signs of discontent remain apparent across the globe and
frankly, it is disturbing. The groundswell of protest near Wall Street is a
sign of the times and it is a clear declaration that too many have been impacted
by a recession that never ended. Another thing is that money continues to flow
out of domestic mutual funds ($4.3 billion in the week the rally began), thus
higher prices are probably being driven substantially by a short covering panic.
That may mean this past rally was capitulation and this reversal may imply a
new trend for a bit. reversal very soon. While we are aware the sentiment is
nowhere near as optimistic as it was a couple of months ago, we believe a lasting
bottom can only be achieved with a true capitulation– tremendously one
sided. We would allow some room on the upside but remain firmly in the bear
market camp.
Growth in the Manufacturing sector slowed in October as production
and inventories declined, according to a closely followed index. The Institute
for Supply Management's manufacturing gauge dropped to 50.8% last month, just
slightly above a 2011 low from 51.6% in September. Economists had expected the
index to rise to 52.1%. Readings over 50% indicate that more manufacturers are
expanding instead of shrinking. Only eight of the 18 industries tracked reported
growth in October, down from 12 in the prior month. The ISM's new-orders index
was unchanged, employment rose and prices fell.
Construction spending rose +0.2% in September. The increase put spending
on building at a seasonally adjusted annual rate of $787.2 billion and is below
the $799.6 billion level reached in June. The gain in construction spending
in September was slightly below analysts' expectations of a +0.3% gain. Year-over-year,
construction spending is down -1.3%. There were revisions to the prior two months.
Spending in August was revised up to a +1.6% gain compared with the initial
estimate of a +1.4% increase. However, spending in July was revised to a -3.3%
drop compared with the prior estimate of a -1.4% fall. In September, spending
on private construction paced the increase, rising +0.6% for the second straight
month. Residential construction rose +0.9%. Spending on public projects fell
-0.6% in September after jumping +3.5% in the previous month. School construction
fell -0.9% in the month and unbelievably spending by the federal government
fell -6.8% in September, the most since last December.
Monday, October 31, 2011 4:03 p.m est.
The market sold off today when Japan said overnight that they were going to
make another attempt at weakening the Yen so the dollar rallied pretty hard
which pulled the market back. For the month it was going to set a record anyhow
as it was up well over +10% but in the end it was still the best since 1991!
Another factor in a very small way was that MF Global declared bankruptcy because
Jon Corzine took some risky trades on EU bonds and with them only paying 50
cents on the dollar, it was a trade gone bad. Anyhow, because of this they didn’t
allow any trading in any accounts as all of their retail accounts will need
to find new homes. There are rumors flying around about who it will be but one
thing for sure is that they will be picking up a lot of investors! The Dow saw
lows in the final hour right at the close of -280.00 points, S&P 500 -33.00
points and the Nasdaq -55.00 points.
At the close the Dow was down by -276.00 points to 11,955.00, S&P
500 -32.00 points to about 1253.00, S&P 100 -14.00 points to 563.00 and
the Nasdaq Composite -53.00 points to about 2684.00. Oil closed with a slight
loss of -$.65 to finish the day around the $93.00 level.
Friday, October 28, 2011 4:03 p.m est.
The market decided to take a break from its rambunctious moves with it opening
a bit lower after economic data was average. The Dow saw lows of -40.00 points,
S&P 500 -8.00 points and the Nasdaq -15.00 points. It didn’t last
long though as it moved back to the unchanged level as traders decided what
to think about the EU over the weekend. The final hour saw the Dow see highs
of +30.00 points, S&P 500 +1.00 points and the Nasdaq +1.00 points.
At the close the Dow was up by +23.00 points to 12,231.00, S&P
500 +.50 points to about 1285.00, S&P 100 +.07 points to 577.00 and the
Nasdaq Composite -2.00 points to about 2737.00 to finish with its fourth straight
weekly gain. Oil closed with a slight loss of -$.65 to finish the day around
the $93.00 level.
One of the reasons that the market may have stalled is because the
more and more you look at the EU rescue plan, you realize that it might not
work for a few reasons. One thing right off the top is that they’re missing
about an additional 21 billion Euros in "official aid." Another thing
is that the fundamental situation remains unchanged as structural problems have
yet to be solved. The banks themselves need more than 106 billion in recapitalization
efforts and the fact that the French banks only need to raise 8.8 billion is
insane. Besides that do you really think that investors in their right mind
will fund Greek and Spanish banks to the tune of $56.2 billion euros!!! With
regard to leverage, all I can say is that it probably won't turn out well. Then
of course you have to question, where will they get all this money anyhow? One
thought was that China will help out but something tells me that China's help
won't come cheap and that could be troublesome. Finally, the 50% cuts on the
private bonds weren’t voluntary so when it gets right down to it we may
hear a lot of kicking and screaming!
The main point of all of this though is that this is looking exactly
the same as when America flushed the system with cash instead of solving the
structural problem, just like Japan did 30-years ago. Questions will also start
to emerge once again because don’t forget Italy and Ireland are still
sitting out there with their hands out for cash and we won’t know what
the real EU plan will be until it's revealed in November and something tells
me that won’t be as pretty as what was revealed yesterday. For example
Italy sold some 10-year bonds this morning and they jumped about +2% percentage
points which isn’t good. Oh and don’t forget that as we move into
November the questions about the “Super Committee” solving America’s
budget problems by Thanksgiving will start to arise! This tells me that although
this rally could run for a while longer on rumors and blind hope, it will eventually
wear itself out and volatility will start up again. I do believe we have seen
the lows for the year though because there are a lot of window dressers out
there still for yearend its just that we can’t keep up this torrid pace
forever!
The wages of workers rose slightly in September, but people spent money
at a more rapid pace and seemed to dip into their savings to pay for their purchases,
which is never a good thing. Personal income rose +0.1% last month, while personal
spending climbed +0.6%. As a result, the personal savings rate fell to +3.6%
from +4.1% the month before and that was the lowest level in almost four years.
Adjusted for inflation, wages fell -0.1% last month. Inflation as measured by
the personal consumption expenditure price index rose +0.2% in September, down
from a +0.3% increase in August. Economists had forecast a +0.3% increase in
personal income and a +0.6% rise in consumer spending. The core PCE index was
expected to edge up +0.1%.
A gauge of consumer sentiment rose to 60.9% in the final reading for
October, compared with a preliminary reading of 57.5%, according to reports
on the data from Thomson Reuters/University of Michigan. Economists had expected
a slight gain to 58% with consumers somewhat happy by stock gains. The September
level was 59.4%. The sentiment reading, which covers how consumers view their
personal finances as well as business and buying conditions, averaged about
87% in the year before the start of the most recent recession. Economists watch
sentiment data to get a feel for the direction of consumer spending.
Thursday, October 27, 2011 4:03 p.m est.
Yesterday the market started the day higher but as news came out of Europe that
nothing was going to be done the market sold off but turned around again to
close near its highs of about +1% once again with the Dow up +160.00 points,
S&P 500 +13.00 points and the Nasdaq +12.00 points because hope lingered.
Today Europe came through and saved the day as European leaders reached a deal
with Greek debt holders overnight that would see private investors take a -50%
cut in the face value of their bonds! Your kidding right,,,that’s good
news,,, I’m glad I don’t own those bonds!!! I’m not sure how
this is all good news anyhow as all this will do is reduce Greek debt levels
to 120% of gross domestic product by the end of the decade and this deal doesn’t
include Italy who is in even worse shape than Greece when you add it all up!
Anyhow the market rocketed out of the gate making most of its gains right away
but the final hour saw some more added with the Dow seeing highs of +420.00
points, S&P 500 +51.00 points and the Nasdaq +110.00 points. You know that
volatility is still around when in the final ten minutes over -100.00 points
were shaved off the Dow, but it still finished with great gains.
At the close the Dow was up by +340.00 points to 12,208.00, S&P
500 +43.00 points to about 1285.00, S&P 100 +18.00 points to 577.00 and
the Nasdaq Composite +88.00 points to about 2739.00. Of course with all of this
good news oil also rallied with a gain of +$3.75 to finish the day around the
$94.00 level.
We are now coming into the end of the month so part of this rally is
likely due to window dressing as its looking as if this could be the strongest
monthly gain ever for the market. At the highs today the market was up about
+14% for the month so by November 2012 this could mean that the the Dow could
be up around +170%, somewhere around 33,000.00!!! If you take it from the lows
that were hit in early October we’re up +20%, so the market could be up
a whopping +230% by November 2012 or, Dow 40,000! Something tells me that this
won’t be the case and in the shorter term I think were closer to a peak
to at least allow the market to consolidate these huge gains. The fact that
were also running into some pretty good resistance also speaks of it so the
next couple of weeks could see volatility kick up once again.
Jobless Claims fell slightly in the latest week down -2,000 to 402,000. Economists
was for claims to rise +2,000 to 405,000. The four-week average fell -1,750
to 405,500 while continuing claims were down by -96,000, to 3.65 million.
Pending home sales fell -4.6% in September the National Association
of Realtors said. The pending-home-sales index fell to 84.5% from 88.6% in August
but +6.4% above Sept. 2010 level. "A combination of weak consumer confidence
and continuing tight lending criteria held back home buyers, even though the
private sector added nearly 2 million net new jobs in the past 12 months."
A sale is listed as pending when the contract has been signed but the transaction
has not closed, though the sale usually is finalized within one or two months
of signing. An index of 100 is equal to the average level of contract activity
during 2001.
The Economy expanded at a much faster pace in the third quarter, growing
+2.5% as consumers spent more on big-ticket items such as autos and businesses
investment surged. Growth almost doubled the +1.3% rate of the second quarter.
The forecast was to expand by +2.8% in the third quarter by economists. Consumer
spending climbed +2.4%, the highest rate since the end of 2010, and business
investment shot up +16.3%. Inventories, which subtract from gross domestic product,
rose 1.9%. Excluding inventories, final sales of goods and services increased
+3.6%. Inflation, as measured by the price index for gross domestic purchases,
fell to 2% in the third quarter from 3.3% in the second quarter. Excluding food
and energy, the index fell to +1.8% from +2.7%.
Yesterday it was reported that Sales of new single-family homes rose
by +5.7% in September as prices fell to the lowest level in nearly a year. New
home sales climbed to an annual pace of 313,000 in September from August's slightly
revised level of 296,000, on a seasonally adjusted basis. Economists had forecast
new home sales to rise to 300,000. Yet sales are still -0.9% lower compared
to one year ago. The median selling price of new homes, meanwhile, fell by -3.1%
to $204,400, marking the lowest level since last October. The supply of new
homes available fell to 6.2 months at the current sales pace from 6.6 months
in August, matching the lowest level since April 2010. The South accounted for
more than half of all new home sales last month, while sales fell in the Northeast
and Midwest.
Orders for long-lasting goods fell in September for the third time
in four months, mainly because of lower demand for autos and commercial aircraft.
Yet, outside of the volatile transportation and defense sectors, orders rose
again for a broad range of manufactured goods to suggest the economy is still
on a modest growth path as it enters the fourth quarter. Bookings for American
made products designed to last at least three years fell by -0.8% last month.
Economists had expected a -1% fall.
Tuesday, October 25, 2011 4:03 p.m est.
According to Reuters, Southern Europe now has a lost generation of
"young professionals" who will take any job, just to have one. The
result is a "lost generation stuck in junk jobs."
The article reports that in countries like Spain and Portugal, as well
as increasingly so in Italy "young professionals accept any conditions
as they try to start their careers." Spain has a 40% youth joblessness
rate, and the so called "junk jobs" are described as "temporary
contracts that used to be common in tourism, farming and construction but are
now used by all kinds of companies."
More important are the macro-aspects of the situation. According to
Reuters: "In Spain, Portugal and Italy, a rigid dual system has emerged.
Middle-aged people have stable jobs with benefits. They are expensive to fire
and protected by masses of legislation. Meanwhile, younger workers are stuck
in a revolving door of temporary contracts that are easy to abuse. The two-track
job market is stunting economic growth, studies show. Temporary workers get
trapped for longer and longer periods without benefits, which affects output
and makes southern Europe less competitive." This is quite interesting
as this is what is starting to happen over here and maybe why Consumer Confidence
hit lows that were seen in 2009 today!
Yesterday the market closed with gains of about +1% with the Dow up
+105.00 points, S&P 500 +16.00 points and the Nasdaq +62.00 points up about
+2.3%. Today the market started the day lower as earnings were mixed and the
market was getting quite overbought and when they announced that there will
be no Eurozone finance minister meeting to announce their decisions about troubled
countries, the market tanked with the Dow seeing quick lows of -180.00 points,
S&P 500 -22.00 points and the Nasdaq -40.00 points. It did rally by midday
but then started to fall back again.
At the close the Dow was down by -207.00 points to 11,707.00, S&P
500 -25.00 points to about 1229.00, S&P 100 -10.00 points to 554.00 and
the Nasdaq Composite -61.00 points to about 2638.00. Oil has been rallying this
past week and appears to want to get to the $100 level once again. It finished
with a gain of +$1.30 to finish the day around the $93.00 level.
Consumers became even more pessimistic in October, with worse expectations
and views on the current economy, as consumer confidence dropped to its lowest
level since March of 2009. The consumer-confidence index declined to 39.8% from
a September level of 46.4%, which was upwardly revised from a prior estimate
of 45.4%. "Consumer confidence is now back to levels last seen during the
2008-2009 recession," said Lynn Franco, director of the Conference Board's
consumer research center, in a statement. Generally when the economy is growing
at a good pace, confidence readings are at 90% and above. Economists had expected
a reading of 46% for October, illustrating consumer concerns over long-term
trends. The expectations index fell to 48.7% from 55.1% in September, while
the present-situation gauge fell to 26.3% from 33.3%. Consumer spending is the
largest portion of the economy, and economists watch confidence readings to
get a feel for the direction of spending. Still, the two always seem to differ
as people continue spending.
The S&P/Case-Shiller 20-city composite index rose +0.2% in August,
as 10 of 20 cities saw gains and is the fifth straight month of gains, S&P
said. On a year-on-year basis, prices are down -3.8% however. The 20-city composite
is down -30.8% from its peak. The S&P/Case-Shiller 20-city composite rose
+0.2% on the month to narrow year-on-year declines to -3.8%. The data add to
a perception of a housing market that is stabilizing both in terms of transactions
and prices but at low levels. “With 16 of 20 cities and both Composites
seeing their annual rates of change improve in August, we see a modest glimmer
of hope with these data,” said David Blitzer, chairman of the index committee
at S&P Indices. Blitzer said the data from the Midwest “really stands
out” as Chicago, Detroit and Minneapolis have all posted very sharp monthly
increases going back to May. Prices of multi-family homes — a rare area
of strength in the housing market — aren’t measured in the Case-Shiller
report.
The Richmond Fed said its manufacturing index was unchanged in October
at -6%, as shipments and plans for hiring fell. The new orders gauge rose 12
points to finish at -.5%, however. Two months ago, the Richmond Fed's index
hit its lowest level since June 2009. The Richmond Fed is a diffusion index,
calculated by subtracting the percentage of respondents who say activity has
dropped from those who say it has increased.
Friday, October 21, 2011 4:03 p.m est.
Today was expiration for the October options and I have to say it was
another extraordinary expiration cycle for profits as the volatility this past
month really pumped up premiums in the options especially for the S&P 500
futures e-mini’s! I would suspect that the November cycle will start to
see premiums get back to normal as we start approaching year end which usually
sees a nice rally to finish up.
Today was very interesting trading wise as Germany and France ruined
the plans for the weekend goal of solving the European liquidity crisis. The
summit that was scheduled will go on, but it's likely that the highly anticipated
announcement of a solution, scheduled for release on October 23rd, won't be
going on as scheduled. It's just as likely that any announcement that is made
may not be as good as expected either. You would think that this would have
killed the market yet it rallied pretty strongly so maybe things may change
over the next couple of days. If nothing is said by Monday morning however all
of the gains could vanish just as quick.
The Wall Street Journal added: "European officials are looking
for ways to bolster the euro-zone bailout fund's firepower without increasing
financial commitments from governments such as Germany that are backing it.
As the French and German leaders met, it emerged that the talks are focusing
on using the fund to provide collateral to back up bond issues by troubled countries.
The idea would be to use the collateral to boost investor confidence by providing
guarantees for an initial portion of losses in the event of default—known
as first-loss insurance—and keep borrowing costs for countries like Spain
and Italy from spiraling to unaffordable levels." The European economy
and especially Europe's banks remain too leveraged and in danger of collapse
if another problem emerges, such as those with the sub-prime mortgage crisis.
The market saw quick highs with the Dow up +230.00 points, S&P 500 +24.00
points and the Nasdaq +50.00 points but then fell back losing half of the gains.
Of course being expiration it came back in the final hour with the Dow making
slightly new highs of +275.00 points in the final hour of trading but the rest
of the indices didn’t follow along.
At the close the Dow was up by +267.00 points to 11,542.00, S&P
500 +23.00 points to about 1238.00, S&P 100 +9.00 points to 559.00 and the
Nasdaq Composite +39.00 points to about 2637.00. Oil was up all day as the dollar
was weaker and gold rallied a bit. It finished with a gain of +$1.35 to finish
the day around the $87.40 level.
Thursday, October 20, 2011 4:03 p.m est.
The market saw lots of volatility today starting higher on decent economic
data but then falling after Greece was unable to get a vote for new austerity
measures. The Dow saw lows of -110.00 points, S&P 500 -12.00 points and
the Nasdaq -45.00 points. It then turned around likely because of expiration
which starts tomorrow morning with the Dow seeing highs of +70.00 points, S&P
500 +10.00 points and the Nasdaq seeing highs of only +5.00 points. The final
hour saw it pullback once again though closing mixed.
At the close the Dow was up by +37.00 points to 11,542.00, S&P
500 +6.00 points to about 1215.00, S&P 100 +3.00 points to 550.00 and the
Nasdaq Composite -5.00 points to about 2599.00. Oil was down hard at the start
of the day but turned around to finish with only a loss of -$.70 to finish the
day around the $85.00 level.
Jobless Claims fell by -6,000 to 403,000 last week but claims from
two weeks ago were revised up to 409,000 from an original reading of 404,000.
Economists had expected new claims to fall to 400,000 on a seasonally adjusted
basis. The average of new claims over the past four weeks fell by -6,250 to
403,000 which is starting to see a nice trend. The monthly average is seen as
a more accurate gauge of labor trends because it smoothes out volatility in
the week-to-week data. Continuing claims also dropped by -7,500 to 3.72 million.
Sales of existing homes fell -3% in September, reflecting continued
tough times in the housing market as well as newly imposed tougher loan limits.
The National Association of Realtors said sales fell to a seasonally adjusted
annual rate of 4.91 million, pretty much in line with the 4.9 million consensus.
August data was revised higher to 5.06 million from an initially reported 5.03
million. The impact of tougher jumbo loan limits was seen in the West, where
sales dropped -8.8%. The median price of homes dropped -3.5% from year-ago levels
to $165,400. Inventories declined -2% to 3.48 million units which was good news,
representing 8.5 months of supply at current sales rates.
Manufacturing in the Philadelphia region showed signs of recovery in
October, the Fed’s Bank of Philadelphia reported. The Philly Fed diffusion
index rose to +8.7% in October from negative -17.5% in September. This is the
first positive reading in three months. Readings above zero indicate expansion.
The increase was much larger than expected as economists were expecting the
index to improve only to negative -10%. Underneath the headline, labor market
conditions improved only slightly however. The Philadelphia index has been weaker
than the national data for the past two months. The Institute for Supply Management
reported that its key reading of the health of the manufacturing sector rose
to 51.6% from 50.6% in August.
Leading economic indicators rose +0.2% in September. The increase in
the index, which rose +0.3% in August, matched the forecast of economists. Although
the index has risen five straight months, the board also said the data shows
weakening growth, with only five of the 10 indicators posting an increase. The
slow pace of LEI suggests a growing chance that this slow economy is going to
be here for a while. The coincident index, which measures current conditions,
rose +0.1% in September, while the lagging index climbed +0.2%.
Wednesday, October 19, 2011 4:03 p.m est.
It was a poor start to the day as Apples earnings last night were much
less than expected with their stock off -5% overnight. Meanwhile Intel’s
earnings were really good but that’s an old tech company so everything
is ignored. Remember Netscape... Anyhow, the market started the day lower but
with hopes of the EU saving the day it turned around and the Dow saw highs of
+60.00 points, S&P 500 +5.00 points but the Nasdaq was still off -5.00 points.
Unfortunately after the Fed announced “that the economy was expanding,
although many areas described the pace of growth as “modest” or
“slight,”in its beige book report released at 2:00 p.m est, the
market started to sell off with the Dow seeing lows of -110.00 points, S&P
500 -20.00 points and the Nasdaq -60.00 points.
At the close the Dow was down by -72.00 points to 11,505.00, S&P
500 -16.00 points to about 1210.00, S&P 100 -7.00 points to 547.00 and the
Nasdaq Composite -53.00 points to about 2604.00. Oil was down pretty good -$2.40
to finish the day around the $86.00 level.
Housing starts surged +15% in September to the highest level in one-and-a-half
years, aided by increased demand for rental stock as well as rebuilding after
Hurricane Irene. The Commerce Department said starts rose to a seasonally adjusted
annual rate of 658,000, which also is +10.2% above the September 2010 reading
and the best level since April 2010, the month the homebuyer tax credit expired.
The figures were well ahead of the 590,000 forecast, but single-family starts
rose a more modest +1.7% to 425,000, which is only a two-month high. The less-volatile
building permits figures declined -5% to 594,000, and single-family permits
eased -0.2%. August's reading on housing starts was modestly revised higher
to 572,000 from 571,000, and August's reading on permits was revised higher
to 625,000 from an initial reading of 620,000.
Consumer prices rose a seasonally adjusted +0.3% in September, while
so-called core prices rose a lesser +0.1%. The core data, which posted its smallest
increase since March, strips out volatile food and energy costs. Economists
had forecast CPI to rise +0.3% overall, with a +0.2% increase in the core rate.
Consumer prices have jumped an unadjusted +3.9% over the past year while the
core rate has risen at a slower +2% pace, unchanged from August. The increase
in prices in September was led by gas and a wide variety of groceries. In a
related report, the government said average hourly wages adjusted for inflation
fell -0.1% in September, seasonally adjusted.
Tuesday, October 18, 2011 4:03 p.m est.
Here’s a good one for my most favorite country in the world;
A record number of Americans applied for temporary work visas last year, so
says the latest Immigration Canada statistics because of the contrasting health
of the two countries labor markets. Canada is the only major economy that has
fully recovered from the 2008 financial crisis and there are more Canadians
working today than in September 2008. No other G7 country can say the same.
The biggest reason is likely because they don’t have a moron for a President
but mostly because Canada never got sucked into buying too much house as you
actually had to have a job and money for a down payment! Then when the global
recession hit, commodity prices were high which is what Canada is all about
so that helped to support it. Commodities aren’t high now but the relatively
strong economy can probably handle current commodities headwinds! Besides all
that Forbes just said that Canada is the best country in the world to invest
in and it does produce the best hockey players in the world! I mean really,
look at Boston who won the Stanley Cup last year, 16 Canadian players!!
The market was lower this morning as it was reported overnight that
China’s economy appears to be falling faster than previously thought it
would and France received the first shots across the bow of a possible downgrade.
Moody’s said it may put a negative outlook on France's Aaa rating in the
next three months if slower growth and the costs for helping bail out banks
and other euro zone members stretch its budget too much. Add into the fact that
Goldman Sachs reported a bigger than expected loss and IBM had weaker sales
than expected out of their earnings report and the the Dow saw early lows of
-110.00 points, S&P 500 -10.00 points and the Nasdaq -30.00 points. Of course
there was Apples earnings to look forward to after the close today so the market
turned around with the Dow seeing highs of +260.00 points, S&P 500 +34.00
points and the Nasdaq +60.00 points in the final hour. The market pulled back
after the highs just in case Apples earnings weren’t stellar and it was
a good thing as they were less then expected after the bell.
At the close the Dow was up by +180.00 points to 11,577.00, S&P
500 +24.00 points to about 1225.00, S&P 100 +11.00 points to 555.00 and
the Nasdaq Composite +43.00 points to about 2657.00. Oil was up to about +$2.00
to finish the day around the $88.00 level.
The Producer Price index rose a seasonally adjusted +0.8% in September
to mark the biggest increase since April. Economists had predicted a +0.4% gain.
Higher wholesale prices were driven by a +2.3% increase in energy costs and
a +0.6% rise in food costs. If those two categories are excluded, "core"
wholesale prices rose a lesser +0.2%. Economists were expecting a +0.1% increase.
Over the past 12 months, wholesale prices have climbed an unadjusted +6.9%.
Omitting food and energy, wholesale prices have risen a more modest +2.5% in
the past year.
Home-builder confidence in October rose by the largest amount since
the introduction of the now-expired home-buyer tax credit program, though the
gauge remains mired at historically weak levels, according to an index released
Tuesday. The National Association of Home Builders/Wells Fargo housing market
index rose by four points to 18, the biggest one-month gain since April 2010.
The index, which measures builder confidence in the market for new-built single-family
homes and is closely correlated with single-family housing starts data, came
in stronger than the 14 reading seen by a MarketWatch-compiled economist poll.
That said, the index - designed so that a reading of 50 is consistent with a
"good" assessment - is still not back to pre-recession levels. The
index hasn't been above 50 since April 2006.
Monday, October 17, 2011 4:03 p.m est.
The market started the week on the downside as questions arose once
again how long it will take to fix the EU problems as German Chancellor Angela
Merkel said it may take awhile to fix everything! Really, isn’t it supposed
to be instantly because that’s how the market has been trading. None the
less the market moved lower and lower all day with the Dow seeing lows of -270.00
points, S&P 500 -27.00 points and the Nasdaq -65.00 points.
At the close the Dow was down by -248.00 points to 11,397.00, S&P
500 -24.00 points to about 1201.00, S&P 100 -11.00 points to 544.00 and
the Nasdaq Composite -53.00 points to about 2615.00. Oil was down about -$1.00
to finish the day around the $86.00 level. As I mentioned on Friday we could
see some volatility with it being an expiration traded week and the fact that
the market was getting quite overbought. It all came true today but was on low
volume so either investors don’t really care or its just a pullback from
the extended run we saw last week. Time will tell and I have a feeling we’ll
end the week nearer to where we started it so we’ll see...
The economy isn’t showing any signs of getting better as the
Empire State manufacturing index increased only slightly in October and remained
in negative territory for the fifth straight month, the New York Federal Reserve
said. The Empire state index inched higher to a negative -8.5% from a negative
-8.8% in September. Readings below zero indicate deterioration, with higher
numbers of firms reporting that conditions had worsened. Economists expected
the index to improve to negative -5%. Several key components were stronger than
the headline though. The new orders index rose to +0.2% from negative -8%, while
the shipments index rose to +5.3% from negative -12.9%. The employee index rose
to +3.4% from negative -5.4% while the average workweek was negative for the
fifth month in a row. The prices paid index fell to its lowest level since last
November. A reading of expected conditions six-months ahead weakened in October
to its lowest level since February 2009.
Industrial production edged up a seasonally adjusted +0.2% in September, and
August's output was downwardly revised to zero growth from an initially reported
+0.2% gain, the Fed said. Economists had anticipated a +0.1% gain for the month.
September's gain was led by business equipment production, which rose +1% on
the month and is up +10.3% from September 2010 levels, while the big drag came
from utilities, where production dropped -1.8%. Utilization inched up to 77.4%
from a downwardly revised 77.3% in August. For the third quarter, industrial
production rose an annualized 5.1%.
Friday, October 14, 2011 4:03 p.m est.
Here’s a good one, 10-years ago Steve Jobs was alive, Bob Hope
was alive, Johnny Cash was alive but now we're outta jobs, outta hope and outta
cash....
Harrisburg Pennsylvania files for bankruptcy. Harrisburg, the Pennsylvania capital
that previously defaulted on its debt, cited a “continued erosion of its
finances.” According to Bloomberg News, Harrisburg listed liabilities
of $500 million, compared with assets of $100 million. A clerk at the U.S. Bankruptcy
Court for the Middle District of Pennsylvania confirmed receiving a physical
copy of the filing. The city's fiscal troubles have been triggered by an overhaul
of the budget and a trash-to-energy incinerator that didn’t increase revenue
by as much as expected, Bloomberg reported. The move comes as the state had
been mulling a takeover of the city’s finances and forcing the installation
of a fiscal rescue plan.
The market started the day lower even though Spain’s credit rating
was downgraded to AA- from AA overnight with a negative outlook, due to weak
growth, tightening fiscal conditions and high private sector debt but who cares
about the future when current Retail Sales came in better than expected. The
market saw early highs and then matched them at the close with the Dow seeing
highs of +170.00 points, S&P 500 +21.00 points and the Nasdaq +50.00 points.
At the close the Dow was up by +166.00 points to 11,645.00, S&P
500 +21.00 points to about 1225.00, S&P 100 +10.00 points to 555.00 and
the Nasdaq Composite +48.00 points to about 2667.00. Oil was up +$3.00 to finish
the day around the $87.00 level.
This turned out to be an interesting week as the market was up about
+5% by Wednesday and matched it again today by adding another +1%. In 7 trading
days the market was up +15%. Before that it was down -10% in 6 sessions and
so you wonder why people aren’t interested in getting in the market! The
market is right back to the highs it made in August and September in this large
sideways channel it has been that has been extremely profitable for us! The
question now is if we are going to see another pull back to the bottom of the
channel or breakout to the upside. Odds are for at least a correction from here
as we are getting pretty overbought and volume continues to fall but I do think
we may see a change in this trading channel as we leave the usual volatile October
period with a break out to the upside after our next pullback so the books look
decent going into year end. That will depend on how low we go from here though,
if its a move back to the bottom of the channel we may have to wait a while
longer. One thing I’m sure of is that as we move into the end of the month
and expiration trading next week, volatility will likely start to kick up again.
Retail sales jumped a whopping +1.1%, not, in September, the biggest
increase in seven months, as people bought more cars, clothing and home furnishings.
Economists expected an increase of +0.8% on a seasonally adjusted basis. Auto
sales jumped +3.6% last month, the biggest increase in a year and a half as
carmakers sold nearly 1.1 million vehicles but the deals are amazing my book.
You can now buy a car with 0 down, 0 interest for 84 months!!! Excluding the
auto sector, sales rose +0.6%, but that was still higher than market expectations
of a +0.4% increase. Sales for August, which were originally reported as unchanged,
were revised up to a +0.3% increase.
A gauge of consumer sentiment fell however to 57.5% from 59.4% in September,
according to reports on the data from Thomson Reuters/University of Michigan.
Economists had expected a slight rise to 59.7% with stock volatility offsetting
lower gas prices. The sentiment reading, which covers how consumers view their
personal finances as well as business and buying conditions, averaged about
87% in the year before the start of the most recent recession. Economists watch
sentiment data to get a feel for the direction of consumer spending.
Import prices made a surprise rise in September, with prices up +0.3%
in September, while economists had anticipated a -0.4% drop. In addition, August
prices were revised to show a -0.2% drop against an initially reported -0.4%
decline. Compared to September 2010, import prices are up +13.4%, as fuel prices
are up +43.4% and the prices of non-fuel imports have gained +5.5%.
Thursday, October 13, 2011 4:03 p.m est.
According to The Wall Street Journal: "Herman Cain has catapulted
to the lead in the race for the Republican presidential nomination, drawing
support from a GOP electorate disenchanted with Rick Perry and still wary of
Mitt Romney, a new Wall Street Journal/NBC News poll finds." The Journal
noted, that in a poll of 1000 adults conducted from October 6-10 "Drawn
by Mr. Cain's blunt, folksy style in recent debates, 27% of Republican primary
voters picked him as their first choice for the nomination, a jump of 22 percentage
points from six weeks ago. Mr. Romney held firm in second place at 23%, his
same share as in a Journal poll in late August, while Mr. Perry plummeted to
16%, from 38% in August."
The GOP tends to lead Mr. Obama in a generic poll. For example, according
to Rasmussen Reports.com: "The latest Rasmussen Reports national telephone
survey of Likely U.S. Voters finds the generic Republican earning 47% support,
while the president picks up 41% of the vote. Three percent (3%) prefer some
other candidate, and nine percent (9%) are undecided." Mr. Obama, according
to Rasmussen data leads, Mr. Romney, Mr. Cain, and Mr. Perry when individuals
are asked to choose individual names. Mr. Obama, according to Rasmussen data,
leads Mr. Cain by a 42-39% margin, Mr. Romney by a 43-41% advantage, and Mr.
Perry by a 49 to 35% distance.
Mr. Obama's favorability is low, but has not fallen much of late. According
to Rasmussen: "Overall, 45% of voters say they at least somewhat approve
of the president's job performance. Fifty-three percent (53%) at least somewhat
disapprove."Rasmussen polls have been the most accurate polls over the
last two election cycles.
The Intrade.com presidential election futures markets give Mr. Romney
a 67% chance of becoming the GOP presidential nominee. Mr. Cain is only receiving
9% of the vote, despite his recent climb in GOP polls. The Intrade.com futures
are currently giving the GOP a 71% chance of grabbing the senate from the Democrats
in 2012. Finally, Intrade.com gives Mr. Obama a 47% chance of being reelected.
The market was lower this morning as economic data was pretty average
and the fact that earnings so far have been less than expected. The Dow saw
lows of +140.00 points, S&P 500 -17.00 points and the Nasdaq -20.00 points.
It came back midday though with the Dow seeing highs of +5.00 points, S&P
500 +1.00 and tech stock being strong with the Nasdaq up +20.00 points.
In the end it pulled back a bit once again so at the close the Dow
was down by -40.00 points to 11,478.00, S&P 500 -4.00 points to about 1204.00,
S&P 100 -2.00 points to 545.00 and the Nasdaq Composite +16.00 points to
about 2620.00. Oil was down all day -$1.30 to finish the day around the $84.00
level.
Jobless Claims were down by -1,000 last week to 404,000 after being
revised up to 405,000 from an original reading of 401,000 last week. Economists
had expected new claims to climb to 406,000 on a seasonally adjusted basis.
The average of new claims over the past four weeks, meanwhile, dropped by -7,000
to 408,000, the lowest level since mid-August.
The Trade deficit remained virtually unchanged in August at $45.6 billion
and close to the consensus forecast of economists. The government revised the
deficit in July up to $45.6 billion from the initial estimate of $44.8 billion.
The deficit with China widened to a record $29.0 billion in August compared
with $28.2 billion in the same month last year. According to Reuters: "China's
trade surplus narrowed in September for a second month in a row as growth of
exports and imports both fell below forecasts, reflecting global economic weakness
and offering Beijing ammunition to resist U.S. pressure on the yuan." The
report added: "Exports increased 17.1 percent last month from a year ago,
slowing from a 24.5 percent gain in August, and imports increased 20.9 percent,
compared with August's 30.2 percent rise, the customs office said on Thursday.
That created a trade surplus of $14.5 billion in September, compared with $17.8
billion in August and $31.5 billion in July. The rolling 12-month trade surplus
reached $180.3 billion in September, dipping from $182.7 billion in August."
Wednesday, October 12, 2011 4:03 p.m est.
This is an “oh brother” moment. Fine print in the "Super
committee" agreement gives Congress a year to act. According to Investor's
Business Daily: "By Nov. 23, the Joint Select Committee on Deficit Reduction
is supposed to reach a deal to cut $1.5 trillion from the federal deficit over
the next 10 years. Yet the "super committee" has an escape hatch,
leading some analysts to contend that the bipartisan panel won't reach an agreement.
Under August's debt-ceiling deal, Congress has until Dec. 23 to act on a deficit
plan from the super committee. Failure to do so triggers "sequestration",
across-the-board discretionary spending cuts of $1.2 trillion over 10 years."
While that sounds bad, there is a catch. According to IBD: "the autopilot
cuts don't begin until January 2013, giving Congress nearly a full year to hash
out a deal to avoid them."
The market started the day higher after it was announced that Slovakia
would agree with the EU’s bailout plan with the Dow seeing highs of +210.00
points, S&P 500 +25.00 points and the Nasdaq +50.00 points but selling in
the final hour took well off of highs.
At the close the Dow was up by +103.00 points to 11,519.00, S&P
500 +12.00 points to about 1207.00, S&P 100 +5.00 points to 547.00 and the
Nasdaq Composite +22.00 points to about 2604.00. Oil was pretty quiet closing
down about -$.70 to finish the day around the $85.00 level.
Tuesday, October 11, 2011 4:03 p.m est.
Well maybe the change is starting to take hold as manufacturing may
actually be returning home which means jobs and “spending”! This
is the second company now who has announced that they are creating manufacturing
jobs in America. According to The Wall Street Journal: Otis Elevators, "The
U.S. manufacturer, whose elevators zip up and down structures as diverse as
the Empire State Building and the Eiffel Tower, is moving production from its
factory in Nogales, Mexico, to a new plant in South Carolina. More startling:
Otis says the move will save it money."
The reason? According to The Journal: "What's happening at Otis
is part of a broader shift in the way manufacturers tally costs. Their outlook
has been changing as the cost of producing abroad has risen and they have devised
more efficient ways to make things close to where they want to sell them."
The Journal added that companies such as Ford Motor and others are also making
the same kinds of moves "Wages and other costs are going up in foreign
countries—especially China—while pay in many industrial sectors
inside the U.S. has risen slowly or even fallen in many cases. Transportation
costs have grown, as have the costs of holding large stocks of inventory, a
common precaution when producing goods far from their end market."
Yesterday the market rallied pretty hard after it was announced by
the EU that they will reveal how they are going to save Greece and Italy by
November with it closing up about +3% but on falling volume. Today of course
after sane minds resumed and people came back from the Columbus holiday the
market started the day down with the Dow seeing lows of -70.00 points, S&P
500 -7.00 points and the Nasdaq -15.00 points after the little country of Slovakia
sounded like they didn’t want to join in with the other EU countries to
help pay for their bills. Slovakia has about 5 million people and a tax rate
of only 19% for both public and corporate accounts. Of course then people thought
that they are meaningless so the market rallied a bit with the Dow seeing highs
of +15.00 points, S&P 500 +4.00 points and the Nasdaq +25.00 points.
At the close the Dow was down by -17.00 points to 11,416.00, S&P
500 +.65 points to about 1196.00, S&P 100 +.43 points to 541.00 and the
Nasdaq Composite +17.00 points to about 2583.00. Oil rallied strongly yesterday
and today it continued closing up about +$.40 to finish the day around the $86.00
level.
Friday, October 7, 2011 4:03 p.m est.
The market started the day higher after the employment report came
out better than expected although not great with the Dow seeing highs of +110.00
points, S&P 500 +6.00 points and the Nasdaq +10.00 points but after Fitch
Ratings downgraded Italy and Spain, the market started to sell off with the
Dow seeing lows of -80.00 points, S&P 500 -14.00 points and the Nasdaq -40.00
points. Fitch cut Italy’s credit score to A+ from AA-, reflecting “the
intensification of the euro zone crisis“ that will require a “politically
and technically complex” solution. They also lowered Spain’s rating
to AA-. Because we were going into the weekend the market came back though and
almost made it back to old highs before selling off into the end of the day.
At the close the Dow was down by -20.00 points to 11,103.00, S&P
500 +10.00 points to about 1155.00, S&P 100 -3.00 points to 523.00 and the
Nasdaq Composite -27.00 points to about 2479.00. Oil was mostly flat closing
up about +$.25 to finish the day around the $83.00 level.
Employment was up +103,000 jobs in September, larger than the average
60,000 gain expected by economists. The sad thing was that it was from returning
workers after the end of a strike at Verizon which added about +45,000 workers.
Revisions to the past two months did add +99,000 workers to payrolls though.
The government sector continued to lose jobs in the month. Private payrolls
expanded by +137,000 jobs lower than average but the bad news is that overall
employment rose from 16.2% to 16.5% for the current month. The unemployment
rate held steady at 9.1% as expected while average hourly earnings increased
+0.2% to $23.12 in September, reversing a drop in August. Earnings are up +1.9%
in the past year with the average workweek rising six minutes to 34.3 hours.
Unfortunately this month has now set a record. According to AP, there
are now 4.5 million people who have been without a job for a year or longer.
This is a dynamic that is being considered as "semi-permanent" by
many. People are starting to give up hope of finding work and it's happening
more and more often and I think they are the people demonstrating in front of
Wall Street! Furthermore, the bad thing is that expectations are for jobs that
pay less for those fortunate enough to find one. As I have been saying, things
are ugly for people right now with the word "depression" now commonly
used, both in conversation as well as reporting with an increasingly prevalent
hopelessness in the air. This could be positive though at least for stocks as
it may mean were very near the bottom of the cycle at least until Christmas.
Inventories at Wholesalers rose +0.4% in August, and were up +14.4%
from the prior year. Sales of wholesalers rose +1% in August, while the inventory-to-sales
ratio was 1.16. I’m not even sure why I even continue to print this information
because since the turn of the century into our technical era, inventory control
is now seeing items replaced on the shelf the second it is sold with an order
sent to the factory that second, so ratios will now always remain tight.
Thursday, October 6, 2011 4:03 p.m est.
Today was a sad day as it was announced overnight that Steve Jobs of
Apple died. Our prayers go out for his family. One thing he will always be known
for is leading the world in technological advances with cool looking computers,
then the Ipod, Iphone and now the Ipad. The question of course is will the people
at Apple be able to keep up the vision that Mr. Jobs had. Many analysts are
thinking that they may not be able to for two reasons. One was that Steve Jobs
said himself that death was a good thing because that is how new life begins
so the question is how long will it take for someone to replace him. Secondly
other greats such as Henry Ford, IBM, Walt Disney, microsoft, and even all the
way back to Edison, all had their times of greatness but they eventually peaked
out so the question is what will the next great gadget be as smart phones and
Ipads are becoming commonplace now. Today Apple rallied initially on the news
but then pulled back too close lower. Will they may make it back to $400, only
time will tell...
The market started the day lower as economic data wasn’t that
good with the Dow seeing lows of -90.00 points, S&P 500 -9.00 points and
the Nasdaq -20.00 points. It turned around pretty quick though with more spiel
from the EU about saving the day. The Dow made highs at the close once again
up +200.00 points, S&P 500 +22.00 points and the Nasdaq +50.00 points.
At the close the Dow was up by +183.00 points to 11,123.00, S&P
500 +21.00 points to about 1165.00, S&P 100 +8.00 points to 527.00 and the
Nasdaq Composite +46.00 points to about 2507.00. Oil closed up another +$2.50
to finish the day around the $82.00 level.
Jobless claims increased by +6,000 to a seasonally adjusted 401,000,
smaller than the expected 410,000 that economists thought it may be but the
bad thing was that it was once again above 400,000. The four week average, viewed
as a more accurate gauge of employment trends, fell by -4,000 to 414,000, the
lowest level since late August. Tomorrow the monthly Employment report for September
is out and economists think there will be +59,000 created after a flat reading
in August. Continuing claims fell by -52,000, to 3.7 million, the lowest level
since July 30th. Still, the economy remains weak, and hiring by historical standards
is very slow at the current stage of recovery. There needs to be at least +125,000
jobs a month just to keep up with the growth of the labor force and double that
amount to drive down the nation’s unemployment rate, which stood at 9.1%
for August. Tomorrow could see some volatility after the employment number is
released to end the week.
Wednesday, October 5, 2011 4:03 p.m est.
The market pulled back after its big rally yesterday with lows hit
out of the gate with the Dow seeing lows of -70.00 points, S&P 500 -9.00
points and the Nasdaq -25.00 points. It turned around pretty quick though as
the dollar fell thus causing commodities to rally. The Dow made highs of +150.00
points, S&P 500 +22.00 points and the Nasdaq +65.00 points in the final
hour.
At the close the Dow was up by +131.00 points to 10,940.00, S&P
500 +20.00 points to about 1144.00, S&P 100 +8.00 points to 518.00 and the
Nasdaq Composite +55.00 points to about 2461.00. Oil closed up a strong +$4.00
to finish the day around the $80.00 level.
Yesterday the S&P 500 fell to an intra-day low early in the session
at 1,074.77 which was -21.2% below its closing market high of 1,363.61, hit
on April 29th. That’s in excess of the 20% drop that is often used as
the dividing line between a correction and a bear market although in reality
we have been in one since 2000. The good thing was that it was a turnaround
Tuesday and we saw it close higher so the question is was that the bottom and
will we rally now for awhile. It would be funny if this correction ended on
the very day it was to be considered a bear market.
I’m not completely convinced that we are finished this correction
just yet but sentiment is getting pretty bearish. Central bankers and policy
makers around the world are up against the wall and there are even demonstrators
in the streets of New York joining all of the others elsewhere in the world
now. Riots and looting have been commonplace in many countries for months and
social unrest is clearly on the rise everywhere. Cities, states, municipalities
and countries around the world are broke. The world is getting to a very dark
place now so it would be good to at least see a ray of sunshine or should I
say a break from the storm appear for a few months going into year end. I think
we’ll know more for sure after we get the employment report on Friday.
The private sector added a better-than-expected +91,000 jobs even as
the amount of expected layoffs hit their highest level in more than two years,
separate reports showed.
The monthly survey from ADP and Macroeconomic Advisors showed that
the service sector added +90,000 positions, goods-producing rose just +1,000
and manufacturing fell by -5,000. Economists had expected +75,000 jobs created.
August was revised from +91,000 to +89,000 and the governments report subsequently
showed a net zero overall job growth for the month, and the unemployment rate
actually ticked higher to 9.1%. Government job losses have been averaging -67,000
a month.
On the other end of it employers announced -115,730 planned job cuts
last month, more than double August's total of -51,114, according to the report
from consultants Challenger, Gray & Christmas. The figure was the highest
since April 2009 when -132,590 layoffs were announced. September's job cuts
were also much higher than the same time a year ago, tripling from the -37,151
job cuts announced in September 2010. For 2011 so far, employers have announced
-479,064 cuts, up +16.5% from the first nine months of 2010.
The Institute for Supply Management said its September services index
slowed slightly to 53% from 53.3% in August. Any reading over 50% indicates
expanding activity, and the reading came in marginally above economists estimates
of 52.7%. The new-orders index increased by +3.7 percentage points to 56.5%,
but the employment index fell -2.9 percentage points to 48.7%, indicating contraction
in employment after 12 consecutive months of growth.
Tuesday, October 4, 2011 4:03 p.m est.
Finally some good news: Ford said it signed a tentative, four-year
labor agreement with the United Auto Workers union that says they will hire
12,000 new hourly jobs in America of all places by 2015, and this was workers
that were once outsourced to Mexico, Japan and China! That estimate is nearly
double Ford's previous outlook, and also included $16 billion in investments
to design, engineer and produce more new and upgraded vehicles and components.
The main point about it is that maybe just maybe the big companies are starting
to realize that if they outsource everything, the people in America can’t
afford to buy their goods so even if it does cost more to build a car per say,
at least those 12,000 will now be able to buy a Ford!! Hopefully as time goes
by this will happen with more and more companies...
The market was down hard right from the start today as futures closed
well below fair value after stocks closed yesterday and overnight they moved
even lower. The Dow saw lows of -260.00 points, S&P 500 -26.00 points and
the Nasdaq -40.00 points. After Fed chief Ben Bernanke said in his testimony
to the Joint Economic Committee of Congress that the central bank’s so-called
Operation Twist will have the effect equivalent to a reduction of half a percentage
point in the federal funds rate and that the Fed could start a new lending program
to be a lender of last resort to the U.S. banking system should there be a bank
run if the European sovereign-debt crisis worsens, the market started to turn
around. Overall what he had to say wasn’t that good though as he thinks
the economy is on the brink of another recession but he made it a point to say
that its up to the governing bodies to create the jobs now. What really turned
the market around though was in the final hour when it was announced that the
EU was looking at bank aid plans. The Dow made highs into the close up +170.00
points, S&P 500 +26.00 points and the Nasdaq +75.00 points.
At the close the Dow was up by +154.00 points to 10,809.00, S&P
500 +25.00 points to about 1124.00, S&P 100 +10.00 points to 510.00 and
the Nasdaq Composite +67.00 points to about 2405.00. Oil closed down another
-$2.00 to be around the $75.60 level but it closed before the markets big rally
and is up over +$2.00 in after hours.
Factory orders fell -0.2% to $451 billion in August. Economists had
expected a -0.3% drop. July's gain was revised to +2.1% growth from an initially
reported +2.4% gain. In August, shipments fell -0.2%, unfilled orders rose +0.9%
and inventories increased +0.4%.
Monday, October 3, 2011 4:03 p.m est.
The market started the week on the downside but bounced on some good
economic news with the Dow seeing highs of +50.00 points, S&P 500 +4.00
points and the Nasdaq +10.00 points. It didn’t last though as the woes
of Europe took hold and it made new lows in the final minutes of trading with
the Dow off -260.00 points, S&P 500 -33.00 points and the Nasdaq -80.00
points.
At the close the Dow was down by -258.00 points to 10,665.00, S&P
500 -32.00 points to about 1099.00, S&P 100 -13.00 points to 500.00 and
the Nasdaq Composite -80.00 points to about 2335.00. Oil closed down another
-$2.40 around the $77.60 level.
September is now over and for the fifth month in a row the market was
lower and it’s the 15th time since 1900 that it has done this. The market
was down about -15% during the current losing streak so you would think its
time to bounce. The bad news is that we are now in the dreaded October trading
period when the market is usually lower and the above statistics indicate that
these streaks don’t typically stop at five months. Six out of 14 times
have seen it move up but only once in the last five occurrences, was the sixth
month positive. The longest monthly losing streak ended in 1942, when the Dow
was down nine months in a row. The good news though is that quarterly returns
since 1950, and over the last 20 years have seen the third quarter as the worst,
and this last one saw the market fall about -12%. Because of this generally
the fourth quarter which were now in till the end of the year, has been the
most bullish, averaging a gain of about +5%, and seeing a positive return almost
80% of the time over the last 20 years. The most important thing to also remember
is that this isn’t 2008 again so even though that is exactly what is happening
in Europe it doesn’t mean that we’ll be dragged down to the same
degree!
Manufacturing activity picked up a bit in September, according to the
Institute for Supply Management’s manufacturing index rising to 51.6%
from 50.6% in August. Economists had anticipated an unchanged reading. Though
the ISM gauge has yet to fall below to the 50% indicating expansion since the
U.S. officially emerged from recession, it’s nonetheless far below the
61.4% peak of 2011 reached in February. Globally, the readings also point to
slowing and in some places deteriorating activity, with Australia’s falling
to 42.3%, the worst since July 2009, and Brazil’s in negative territory
for the fourth month with a 45.5% reading. There were some minor signs of encouragement
in the report that saw the employment subcomponent rise 2 points to 53.8%, ahead
of Friday’s report on employment. The new orders subcomponent was unchanged
at 49.6%, while production rose 2.6 points to 51.2%. The ISM manufacturing index
is a diffusion survey, calculated by asking respondents to measure the change
of the current month from the previous month. The ISM combines questions on
new orders, production, employment, supplier deliveries and inventories and
then seasonally adjusts them.
Friday, September 30, 2011 4:03 p.m est.
The market started the day on the downside and slowly grinded lower
all day to make lows in the final hour with the Dow off -250.00 points, S&P
500 -30.00 points and the Nasdaq -70.00 points. With this the final day of the
month it was also the last day of the quarter with the market down about -14%.
This has been the worst quarter since the 2008 crash. At the close the Dow was
down by -241.00 points to 10,913.00, S&P 500 -29.00 points to about 1131.00,
S&P 100 -12.00 points to 513.00 and the Nasdaq Composite -65.00 points to
about 2415.00. Oil closed down pretty hard -$3.00 to be be around the $79.00
level.
Clearly the market isn’t liking what is going on and as we now
move into earnings season we may see how much things have slowed down. This
may be why it may be another 10-years before we get out of the business funk
were in now. Although yesterday we got an “okay” unemployment report
for once, it appears that businesses have continued to invest in machines, not
workers. In an early 1990s book titled; The End of Work, futurist Jeremy Rifkin
made an interesting point that is obvious but we still want to deny because
it takes away the way we make a living and that is that automation has slowly
lead us to where we are today. Millions of jobs have actually disappeared forever,
being replaced by machines that do incredible things. The funny thing is we
find them fascinating in what they can do but in reality unless you work in
the factory that builds the “machines,” your out of a job!!
The Wall Street Journal notes that in the war of "Man vs. Machine"
it's evident that the "machine is winning." Data from the Department
of Labor, the Journal reports: "Since the recession ended, businesses had
increased their real spending on equipment and software by a strong +26%, while
they have added almost nothing to their payrolls." It also said: "In
August, new orders and shipments of “capex goods” — defined
as non-defense capital goods excluding aircraft, increased by +1.1% and +2.8%,
respectively. In the same month, private payrolls edged up a mere +62,000."
So, why do companies hire robots, of course its obvious, they are
cheaper. They have no retirement plans, no health insurance, don't require raises
and when they break down, they can be replaced without fear of being sued. According
to The Journal: "First, employers face a jump in health insurance costs.
The Kaiser Family Foundation reported a +9% average increase in the premiums
paid by employers this year. The average yearly cost to cover a family hit a
record $15,073, up sharply from $13,770 in 2010. Second, companies must deal
with higher taxes to replenish state unemployment-benefits. According to the
Wall Street Journal, employers will get hit by higher tax bills as many states
have to pay back Washington for benefit money borrowed during the recession.
In comparison to these rising labor bills, the wholesale cost of capital goods
is up +1.6% over the past year."
The big problem is that we have an economy based on consumer spending
so the lack of jobs and income growth means consumers can’t spend. When
businesses have more of a preference for equipment, from a cost perspective,
its also the big reason why policy-makers are having problems igniting job creation.
Indeed, the Fed’s pursuit of low interest rates only widens the cost gap
because it cheapens the borrowing costs for capital projects while doing little
to hold down payroll expenses. Rifkin's conclusion is interesting. If the world
doesn't transition from "work" to something equally productive, humanity
is essentially done. People are getting by, maintaining living standards but
doing it by consuming their capital. Even those with a cushion are still living
it up a bit too much. Gerald Celente says, “when people have nothing left
to lose, they lose it.” So as I have been saying for quite some time,
I believe this will continue for years to come until we get back to the mid
1900’s standard of living so we’ll likely continue to see the market
move up and down in huge ranges. The good news we can make money trading in
up and down markets!
Personal income declined in August and consumer spending slowed. Personal income
fell -0.1% in August, the largest decrease since October 2009 while Consumer
spending rose +0.2% in August after a +0.7% gain in July. Real consumer spending,
adjusted for inflation, was flat. Economists were expecting a weak income and
spending report in part because of the poor employment report last month, which
showed no net new jobs created and a decline in average hourly earnings. Economists
had expected a flat reading for incomes and a +0.1% gain in spending. The savings
rate fell to 4.5% from 4.7% in July and is the smallest savings rate since November
2009. Wages and salaries fell -0.2% in August. Excluding inflation, real disposable
incomes fell -0.3% in August, the biggest drop since November 2009. The Fed's
favorite measure of inflation, the personal consumption expenditure price index,
rose +0.2% in August compared with July and is up +2.9% in the past year. The
core PCE rate rose +0.1% in August, weaker than the -0.2% gain forecast. The
core PCE index is up +1.6% year-on-year.
A gauge of consumer sentiment rose to 59.4% in September after tumbling
to a nearly three-year low 55.7% in August, according to Friday reports on the
gauge from Thomson Reuters/University of Michigan. Economists had expected a
slight rise to 57.6% with stock volatility and weak employment maintaining downward
pressure on sentiment. A preliminary reading released earlier this month estimated
a sentiment level of 57.8% for September. The sentiment reading, which covers
how consumers view their personal finances as well as business and buying conditions,
averaged about 87% in the year before the start of the most recent recession.
Manufacturing activity in the Chicago region expanded at a more rapid pace in
September. The Chicago purchasing managers index rose to 60.4% from 56.5% in
August and the rise was unexpected. Analysts were looking for a slight decline.
Readings over 50% indicate overall business expansion. The Chicago PMI is the
last of a series of regional indicators that give clues to the national Institute
for Supply Management manufacturers' survey for September to be released on
Monday. Based on other regional readings, economists expect the September ISM
manufacturing composite to slow a bit more to 50.5% from an August reading of
50.6%. This is down from an average reading of 58.8% in the first six months
of the year.
Thursday, September 29, 2011 4:03 p.m est.
Yesterday the market started the day higher but after its initial pop
higher it slipped into the red and although it looked like it was going to come
back in the final hour selling took hold and it ended the day down about -2%
with the Dow off -180.00 points, S&P 500 -24.00 points and the Nasdaq -55.00
points. Today the market started the day up strongly with the Dow seeing highs
of +260.00 points, S&P 500 +25.00 points and the Nasdaq +50.00 points. Selling
took hold in the final hour though and the market actually moved into negative
territory once again with the Dow off -20.00 points, S&P 500 -9.00 points
and the Nasdaq Composite -60.00 points at one point.
It did come back with a rally this time though to finish the day mixed. At the
close the Dow was up by +143.00 points to 11,154.00, S&P 500 +9.00 points
to about 1160.00, S&P 100 +5.00 points to 526.00 and the Nasdaq Composite
-11.00 points to about 2481.00. Oil closed higher finishing up +$2.00 to be
be around the $83.00 level.
Gross domestic product for the second quarter was revised to an increase
of +1.3% annualized from the earlier estimate of a +1% rise. Economists expected
second-quarter growth to be revised to a +1.2% rate. The revision to second-quarter
GDP was largely due to a pickup in construction spending and slightly faster
consumer spending. A key measure of inflation was revised higher. The core personal
consumption index, which excludes food and energy prices, increased +2.3% up
from +2.2% reported earlier. Corporate profits before-tax were also revised
higher Corporate profits before-tax increased +0.7% quarter-to-quarter, up from
the +0.5% reported earlier.
Jobless Claims fell by -37,000 last week to 391,000 to mark the lowest
level since April, but a government official suggested the surprising drop may
have been from a variety of "technical" issues not captured by normal
seasonal adjustments. Initial claims from two weeks ago were revised up to 428,000
from an original reading of 423,000. Economists had expected new claims to move
to 417,000. The average of new claims over the past four weeks, meanwhile, fell
by -5,250 to 417,000. Continuing Claims fell by -20,000 to 3.73 million. About
6.98 million people received some kind of state or federal benefit in the week
of September 10th, up 95,242 from the prior week.
The pending sales index of existing homes fell -1.2% to 88.6 in August,
the National Association of Realtors said. The pending sales index totaled 89.7
in July. The index's current level is 7.7% above the August 2010 level, but
it's well below the pace of pending sales in a healthy economy. The biggest
decline took place in the Northeast, while the Midwest and West also fell. The
South was the only region to post an increase.
Yesterday it was reported that Durable goods once again fell slightly
in August as demand shrank for motor vehicles and certain large defense goods.
Bookings for products designed to last at least three years fell -0.1% in August
after a +4.1% gain in July. Economists had expected orders to rise by +0.4%.
Slower demand for durable goods would be a worrisome sign for an economy whose
growth over the past year has been spearheaded by manufacturing and exports.
If companies cut back on capital investments because of fresh worries about
the economy, growth could slow even further. Orders for core capital goods climbed
+1.1%. That closely watched category gives a better read on trends in the private
sector because it excludes transportation and government spending on defense.
In addition, shipments of core capital-equipment goods, which the government
uses to help calculate gross domestic product, rose +2.8%.
Tuesday, September 27, 2011 4:03 p.m est.
This one is so true: Self-checking cashiers fading at grocery stores.
People are willing to spend a few extra minutes waiting for a cashier than to
waste even more time if a self-checkout cashier goes wrong says a report. According
to AP: "some grocery store chains nationwide are bagging the do-it-yourself
option, once considered the wave of the future, in the name of customer service."
Thank goodness because personally I can’t stand the things although I
do fly through them pretty quick but guess what it also means,,,,they might
even have to hire some people which could be good for the economy!
The market continued higher on the hopes that the EU would save the
day for Greece and Italy, and Iceland, and Portugal and Spain and..... The Dow
saw highs of +320.00 points, S&P 500 +32.00 points and the Nasdaq +75.00
points but selling in the final hour almost saw all of the gains wiped out but
the TradeBots, who have seemed to be in control of late, saved the day so the
market still finished the day with okay gains.
At the close the Dow was up by +147.00 points to 11,191.00, S&P
500 +12.00 points to about 1175.00, S&P 100 +5.00 points to 530.00 and the
Nasdaq Composite +30.00 points to about 2547.00. Oil closed before the selling
began finishing up +$3.40 to be be around the $84.00 level.
Home prices rose for the fourth month in a row in July, according to
the S&P/Case-Shiller 20-city composite. Prices rose +0.9% on a monthly basis,
narrowing the year-on-year loss to -4.1%. Detroit and Washington D.C. were the
only two cities posting annual price gains, while Minneapolis saw the worst
fall with a -9.1% annual drop. David Blizer, chairman of the index committee
at S&P Indices, said the market is still far from a sustained housing recovery,
which would require continued house price gains through the end of the year
and better annual results.
As employment expectations slightly improved, Consumer Confidence moved
up a bit in September while remaining at low levels. The consumer-confidence
index rose to 45.4% from 45.2% in August, when it had plunged on debt worries,
among other factors. Economists had expected a September reading of 46.1%. The
August confidence reading was upwardly revised from a prior estimate of 44.5%.
Generally when the economy is growing at a good clip, confidence readings are
at 90% and above. The expectations part of the report rose to 54% from 52.4%
in August. The present-situation gauge fell to 32.5%, the lowest since January
from 34.3%.
Monday, September 26, 2011 4:03 p.m est.
The market popped higher on new hopes that the EU would save the day.
It didn’t hold though as the S&P 500 fell into the red by -6.00 points
and tech stocks really took a hit down -40.00 points at one point as Apple was
really hit on worries that they may be having a production problem. The market
came back though as the day moved along with strong gains mostly in the Dow
seeing highs of +290.00 points, S&P 500 +28.00 points and the Nasdaq +40.00
points in the final hour.
At the close the Dow was up by +272.00 points to 11,044.00, S&P
500 +27.00 points to about 1163.00, S&P 100 +12.00 points to 525.00 and
the Nasdaq Composite +33.00 points to about 2517.00. Oil was below the $80 most
of the day but at the close it came to finish up +$.40 to be be around the $80.00
level.
The sale of New Homes fell -2.3% in August to an annual rate of 295,000,
marking the fourth decline in a row. Sales last month dropped to the lowest
level since February. In July, meanwhile, sales were revised up to 302,000 from
298,000 on a seasonally adjusted basis. After peaking in 2011 at 316,000 in
April, new-home sales have gradually declined. Also, the average selling price
fell another -8.7% from July to $246,000, the lowest level since early 2009.
At current sales rates, unsold new homes on the market represented a 6.6 month
supply. And the actual number of new homes available decreased to 162,00 to
set yet another record low. One analyst predicted that there is still another
-10 to -20% left to go in prices before the bottom is hit and it could take
another 5 years to see the bottom unless lenders figure out a new way to deal
with pricey mortgages.
Friday, September 23, 2011 4:03 p.m est.
Interesting poll: CNBC asked who thought the country was headed into
a depression and 67% actually thought it was!!
The day started with the market lower once again with the Dow off -100.00
points, S&P 500 -8.00 points and the Nasdaq -20.00 points. Buyers came in
afterwards though and drove the market up with the Dow seeing highs of +80.00
points, S&P 500 +12.00 points and the Nasdaq +40.00 points.
At the close the Dow was up by +37.00 points to 10,771.00, S&P
500 +7.00 points to about 1136.00, S&P 100 +3.00 points to 513.00 and the
Nasdaq Composite +28.00 points to about 2483.00. Oil was mostly flat closing
down -$.50 around the $80.00 level.
Here’s a scary thought, Goldman may post a quarterly loss. According
to The Wall Street Journal: "Global markets have turned so ugly that Wall
Street's mightiest firm, Goldman Sachs Group, is at risk of posting its first
quarterly loss since the financial crisis. Other banks are also under pressure."
This means many things. The stock is off some -45% from its 2011 high, achieved
in January as of the close on 9/22. It is just above 50% below its 200-day moving
average, which may be a sign that it is so vastly oversold that we may be nearing
a capitulation type move on the stock however but the fundamentals are something
to watch closely. Investors should be concerned about the markets losing confidence
in Goldman because they are the middle man for all kinds of transactions which
mean that if they go under, the repercussions throughout the stock, bond, and
commodity markets could be extreme, and extremely significant. Another thing
is that if they go down, it could be just as bad or even worse than Lehman however
its highly unlikely and if it just goes down in price it could be an buying
opportunity of some historical importance ahead.
Thursday, September 22, 2011 4:03 p.m est.
Interesting fact; Over 46 million people are now living under the poverty
level yet at the same time, there is a possibility of a government shutdown
at the end of month. According to The Washington Post: "The surprise defeat
in the House Wednesday of a special funding measure to keep the federal government
functioning past September 30th was a sharp rebuke of the GOP leadership that
controls the chamber and a testament to the fragility of the majority itself.
The rejection of the measure resurrected the specter of a government shutdown
at the end of the month and suggested that the heated confrontations that dominated
Washington in the spring and early summer are likely to return this fall."
This caused the market to fall out of bed this morning as it appeared
that congress is up to its old antics. As the day went on things continued to
get worse and worse with the Dow seeing lows of -490.00 points, S&P 500
-50.00 points and the Nasdaq -110.00 points.
At the close the Dow was down by -391.00 points to 10,734.00, S&P
500 -37.00 points to about 1130.00, S&P 100 -17.00 points to 510.00 and
the Nasdaq Composite -83.00 points to about 2456.00. Oil was hit hard to close
down -$4.50 around the $80.50 level.
Jobless Claims fell -9000 to 423,000 last week from 432,000 last week.
Claims from two weeks ago were revised up from an original reading of 428,000.
Economists had expected new requests for jobless benefits to drop to 424,000,
on a seasonally adjusted basis. The past four weeks, meanwhile, climbed to 421,000,
the highest level in two months. The monthly average is seen as a more accurate
gauge of labor trends because it smoothes out volatility in the week-to-week
data. Continuing claims fell by -28,000 to 3.73 million. About
6.89 million people received some kind of state or federal benefits two weeks
ago, down 256,256 from the prior week. The Index of Leading Economic Indicators
grew +0.3% in August, compared with a +0.1% gain expected by economists. The
LEI is a weighted gauge of 10 indicators that are designed to signal business
cycle peaks and troughs. Among the 10 indicators that make up the LEI, four
made positive contributions in August, led by the real money supply. The largest
negative contribution came from stock prices. The LEI for July was revised to
+0.6% from a prior estimate of +0.5%.
Wednesday, September 21, 2011 4:03 p.m est.
The market started the day higher even though the International Monetary
Fund said that "We have serious concerns that further intervention by the
Federal Reserve could exacerbate current problems or further harm the U.S. economy,''
but when Moody’s cut ratings on bank stocks it started to slip. Because
everyone anticipated the good news from the Fed though it came back with the
Dow seeing highs of +50.00 points, S&P 500 +4.00 points and the Nasdaq +30.00
points at one point.
After the Fed announced no change in interest rates and that they would
launch a new $400 billion program that will move its $2.85 trillion balance
sheet more heavily to longer-term securities by selling shorter-term notes and
using those funds to purchase longer-dated Treasuries the market started to
sell off. They will also reinvest proceeds from maturing mortgage and agency
bonds back into the mortgage market, an acknowledgement of just how weak conditions
in the sector have remained. The market started to really sell off after they
said that they are seeing “significant downside risks to the economic
outlook, including strains in global financial markets.” It seemed to
really sink in when traders started to think about it. With Moody’s downgrading
banks, the IMF saying things are really bad and the Fed is getting worried,
it was obvious the only path for the day was down so the selling continued right
into the close with the Dow seeing lows of -295.00 points, S&P 500 -36.00
points and the Nasdaq -55.00 points.
At the close the Dow was down by -283.00 points to 11,125.00, S&P
500 -35.00 points to about 1167.00, S&P 100 -15.00 points to 526.00 and
the Nasdaq Composite -52.00 points to about 2538.00. Oil was up earlier on but
fell into the close down -$1.00 around the $85.00 level.
There are more and more murmurings about the U.S. is Japan like and
seeing a "lost decade" according to Reuters or as I would say lost
12 years! According to Reuters: "As the U.S. economy slouches toward another
recession and confidence in policy-makers erodes, investors are coming to grips
with the notion that the country may already be several years into a Japan-style
lost decade." What makes the situation in the U.S. different than that
in Japan is that the U.S. has a different set of circumstances than those that
faced Japan after its real estate bubble burst in 1989, which by the way is
still below those levels here in 2011! As Reuters points out "U.S. households,
unlike those in Japan, have higher debts and lower savings, while massive deficits
have sapped political support for the type of robust government spending Japan
relied upon." Perhaps what this may mean is that because the problem in
the U.S. is of a higher magnitude "in a prolonged period of anemic growth,
the U.S. economy may have a slimmer margin for error." You don't have to
be an economist to look around and see the poor nature of the economy where
one day a business does well and the next day it could be gone. Perhaps the
best measure of what's out there with regard to expectations is what the markets
are telling us,,, we’ll continue in this situation for at least another
year....
Sales of existing homes climbed +7.7% to a five-month high in August,
as previously delayed deals closed, prices fell and rents rose. The National
Association of Realtors reported that sales rose to a seasonally adjusted annual
rate of 5.03 million, up from an unrevised reading in July of 4.67 million and
above the 4.8 million that economists. Compared to July 2010, sales surged +18.6%.
Two-thirds of real estate agents polled reported rents rising in August. At
the same time, the median price was $168,300, a decline of -5.1% from the same
period last year which isn’t good and may be why sales are so good. July
prices were revised lower to $171,200 from an initially reported $174,000. Inventories
fell -3% to 3.58 million units, representing 8.5 months of supply at current
sales rates.
Tuesday, September 20, 2011 4:03 p.m est.
I saw a funny cartoon about Treasury Secretary Geightner today where
he was beside rolls of paper and he said that “we can’t be out of
money, we still have paper left!!!
Interesting; While Italy was downgraded overnight, Israel’s credit
rating was increased!!! They have growth and unemployment around 5% per year
yet they are surrounded by countries that want to wipe them off the face of
the planet!
Well I wasn’t surprised this morning to hear that people are
still picketing on Wall Street! I hate to be so negative but I’m so tired
of these people as my own town is filled with them!! There is this guy that
stands in the middle of the road at a turn signal light on a meridian begging
for money because he’s hungry. Yet he seems to be able to keep his interesting
hair style, get tattoos and feed his rather large dog!!! And why is he there
constantly,,, because other idiots feel sorry for him and actually give him
money!! Oh but he has a mental disease they say,,,,, ya, its that he’s
a lazy butt that won’t work for less than $20 an hour!!!! This past generation
of kids has been raised to get whatever they want and don’t have to do
anything to earn it then when they’re older they expect a handout from
the government and anyone that will give them a free ride!!
Overnight Globex futures sank suddenly when S&P lowered the credit
rating of Italy but slowly traders decided what the heck, were all going down
in the ship anyhow so we might as well push the market up so we saw a higher
open. It could have also been that the Fed starts meeting today and everyone
is hoping that there will be another QE3 announced or as the new saying goes,
“operation twist”. I think they may be surprised in the end as interest
rates are already at record lows. After the initial pop selling took hold with
the Dow see slight lows of -10.00 points, S&P 500 -2.00 points and the Nasdaq
-5.00 points but after rumors started flying about other EU countries promising
money to Greece it rallied with the Dow seeing highs of +140.00 points, S&P
500 +17.00 points and the Nasdaq +35.00 points as Apple made a new all time
high. The final hour saw selling take hold however as rationality took hold
so the market moved back to its earlier lows.
At the close the Dow was up by +8.00 points to 11,409.00, S&P 500
-2.00 points to about 1202.00, S&P 100 -.63 points to 541.00 and the Nasdaq
Composite -23.00 points to about 2590.00. Oil was up earlier on over a $1 but
fell by the close down -$.50 around the $86.00 level.
Housing starts fell -5% to an annual rate of 571,000 last month, the
lowest level in three months so it appears that that sector remains in the doldrums.
Economists had expected housing starts to fall to a seasonally adjusted 590,000
from July’s revised level of 601,000. Most of August’s decline took
place in the Northeast and it was concentrated in multi-dwelling buildings such
as apartments. New building fell -29.1% in the Northeast while the construction
of multi-dwelling units sank -12.4%. Construction of single-family homes, which
account for three-quarters of the housing market, fell a much smaller -1.4%
to an annual rate of 417,000. Permits for new construction actually rose +3.2%
to an annual rate of 620,000, marking the highest level since January which
is good news. Permits give an indication of whether demand for new homes is
growing or slowing. Single-family permits climbed +2.5% to 413,000, the best
showing since December.
The residential-construction industry remains stuck in its worst slump in modern
times, building fewer than 600,000 new homes in both 2009 and 2010. By contrast,
nearly 1.1 million homes were built in the year before the recession and the
industry constructed 2 million homes as recently as 2005. Now new homes are
selling at about half the rate as would be the case in a healthy housing market.
Among the factors depressing sales are a persistently high jobless rate, a flood
of foreclosures and the difficulty that both builders and prospective buyers
face in trying to get financing from cautious lenders.
Monday, September 19, 2011 4:03 p.m est.
The market started the day down almost -2% as once again the European
worries came around and the fact that President Obama was making some sweeping
declarations about raising taxes on the rich. The Dow saw early lows of -260.00
points, S&P 500 -28.00 points and the Nasdaq -60.00 points. It did bounce
back though as the day went on and the final hour almost saw tech stocks move
into the green but in the end it fell back with about a -1% loss.
At the close the Dow was down by -108.00 points to 11,401.00, S&P
500 -12.00 points to about 1204.00, S&P 100 -5.00 points to 541.00 and the
Nasdaq Composite -10.00 points to about 2613.00. Oil was down hard all day closing
-$2.50 around the $85.00 level.
It’s obvious that volatility is going to remain which isn’t
a surprise as the market is dealing with Europe, the Economy and the upcoming
Election next year as it appears that Obama is already on the campaign trail.
I spoke about possible riots on Friday and they started to happen over the weekend
after he made announcements about his tax plan. Many young people without jobs
descended on Wall St with slogans declaring that “corporations are destroying
the country”! I get a kick out of that as they are the biggest supplier
of jobs but heh it shows how ignorant some people are!! I wouldn’t be
surprised to see them grow however as these are the same people that are likely
looking for a free ride. There was $900 billion dollars spent last year in programs
to help the poor that had nothing to do with welfare which means that each so
called “rich” person is paying about $9000 extra to help these people
stay in poverty. We are becoming a welfare state and so it makes me question
when the rich will start to revolt back. I have a friend who runs orphanages
around the world and he has seen first hand what happens when all you do is
give and give and give! His question for people, is it better to give or better
to teach them how to support themselves. From his experience he finds that its
better to teach people and more importantly that these people “want”
to learn ways to make it themselves, especially in poorer nations or places
like China and India who are coming out of third world status. This is what
North America was years ago when people worked their way up the ladder to that
three bedroom house and two car family. Maybe those people sitting on Wall St
should get off their *()$_ and get or even better, create a job!!!
Confidence in the market for newly built single-family homes fell slightly
in September to remain in very low territory, according to an index released
today. The National Association of Home Builders/Wells Fargo Housing Market
Index fell by a point to 14%, on a seasonally adjusted index where readings
above 50% are considered good. The index, which correlates closely with single-family
housing starts, has held between 13% and 16% for the last six months. Economists
had expected a 15% reading.
Thursday, September 15, 2011 4:03 p.m est.
Mortgage rates at record lows: The average rate on the 30-year fixed-rate
mortgage fell to a record low 4.09% -- these data go back to 1971 - from 4.12%
in the prior week, according to the buyer of residential mortgages. A year ago,
the rate was at 4.37%.
Blue collar jobs a better choice? According to The Washington Post:
"College graduates are the fastest-growing group of consumers who have
filed for bankruptcy protection in the past five years, according to a new study
by a financial nonprofit, which underscores the broad reach of the Great Recession."
The Post added: "The survey by the Institute for Financial Literacy, slated
for release Tuesday, found that the percentage of debtors with a bachelor’s
degree rose from 11.2 percent in 2006 to 13.6 percent in 2010. The group tracked
similar but smaller increases in consumers with two-year associate and graduate
degrees. Meanwhile, the percentage of debtors with a high school diploma or
who did not finish college declined."
There is an even worse message in the statistics. According to The
Post, citing the above referenced study, it's the older portion of the college
educated crowd that is increasing with "the number of people 55 and older,
who have less time to recover financially, has jumped 25 percent," while
"the number of consumers filing for bankruptcy between ages 18 and 34 has
fallen 31%" over the past five years. The report added that "credit
cards and other unsecured loans force most people into bankruptcy" are
"typically" the most common reason for bankruptcies, but "hefty
mortgages and falling home values contributed to the spike in filings among
wealthier households and college graduates."
The market has been very volatile this week as Tuesday saw a huge range
up and down and in the end it was higher by just about a percent. It was the
same thing yesterday as the European Unions rumors about saving Greece and other
countries were all over the place but again it was higher. This morning the
market was up again even though economic data was abysmal but with the European
Central Bank saying that they would loan U.S. dollars to euro-area banks to
make sure they have enough of the currency through the end of the year it helped
European indices rally along with ours. The key words were the central bank
saying it would hold a series of three liquidity operations so basically another
QE program to save the day but not really deal with the problem. How long will
this last who knows but the Dow saw highs of +190.00 points, S&P 500 +21.00
points and the Nasdaq +40.00 points making it a +4% gain going into the last
day of the week and the September expiration cycle.
At the close the Dow was up by +187.00 points to 11433.00, S&P 500 +21.00
points to about 1209.00, S&P 100 +9.00 points to 543.00 and the Nasdaq Composite
+35.00 points to about 2607.00. Oil was flat all day closing up +$.10 around
the $89.00 level.
The Philadelphia Fed said its manufacturing index was -17.5% in September,
the third negative reading in four months. Economists had anticipated a -13.4%
reading for September after a -30.7% disaster in August.
Jobless Claims also rose +11,000 last week to 428,000 and claims from
two weeks ago were revised up to 417,000 from an original reading of 414,000.
Economists had expected new claims to climb to 418,000 on a seasonally adjusted
basis. The average of new claims over the past four weeks, meanwhile, rose by
+4,000 to 419,500 while continuing claims fell by -12,000 to 3.73 million. About
7.14 million people received some kind of state or federal benefits, down 25,033
from the prior week.
Consumer prices rose a seasonally adjusted +0.4% in August while the
core prices, which strips out the less needed food and energy costs, increased
a smaller +0.2%. The core rate is now up +2.0% over the past 12 months, the
first time it's hit that level since November 2008. Economists had forecast
CPI to rise +0.2% overall, with a +0.2% increase in the core rate. Consumer
prices have jumped an unadjusted +3.8% over the past year. The increase in the
cost of goods and services has resulted in a -1.8% decline in inflation-adjusted
weekly wages for workers over the past 12 months. Average hourly wages adjusted
for inflation dropped -0.6% in August, marking the biggest one-month decline
since July 2008 and that is a very bad sign!
The Empire State manufacturing index fell to -8.8% in September from
-7.7% in August and remained in negative territory for the fourth straight month.
This is the lowest reading since November 2010 and readings below zero indicate
deterioration, with higher numbers of firms reporting that conditions had worsened.
The new orders index inched lower to negative -8%, while the shipments index
fell 16 points to -12.9%. After dropping sharply during the summer, the index
for prices paid increased in September which isn’t good news. Employment
indexes were below zero. A reading of expected conditions six-months ahead improved
a bit to 13% in September from a two-year low of 8.7% in August.
The output of the nation's factories, mines and utilities rose +0.2%
in August after a strong +0.9% gain in the prior month. The August gain was
bigger than the flat reading expected by analysts. Factory activity alone rose
+0.5% after a +0.6% increase in July. Production of motor vehicle and parts
rose +1.7% in August after a +4.5% gain in the prior month. Excluding motor
vehicles and parts, factory production rose +0.1% in August. Capacity utilization,
a gauge of slack in the economy rose to 77.4% in August from 77.3% in July.
Capacity utilization has been rising slowly and is at its highest level since
August 2008.
The current-account deficit fell to $118 billion in the second quarter,
or 3.1% of GDP, from first-quarter levels of $119.6 billion, or 3.2% of GDP.
The deficit narrowed due to an increase in income from U.S. owned foreign assets
as well as a increase in the surplus in services, which offset a widening goods
deficit and increased government grants. The first-quarter current-account deficit
was revised up to $119.6 billion from $119.3 billion.
Yesterday it was reported that Retail sales in August reached $389.5
billion, with virtually no growth from the prior month as consumers spent more
at gas stations and grocery stores, but less at motor vehicles and parts dealers.
Excluding the volatile auto segment, sales only rose +0.1%. Economists had expected
an increase of +0.3% for the overall number, as well as for the data excluding
autos. Sales for July were revised to +0.3% from a prior estimate of +0.5%,
while sales for June were revised to +0.2% from +0.3%. Over the past three months,
retail sales have climbed +7.9% compared to the same period one year ago. In
August, sales rose +0.3% at gasoline stations and +0.5% at grocery stores, among
other areas. Meanwhile, sales fell -0.3% at motor vehicles and parts dealers,
the lowest result since May.
The prices of goods at the wholesale level were unchanged in August
as another decline in fuel costs offset an increase in food. The more closely
followed core producer price index edged up +0.1% last month to mark the ninth
straight increase. Economists had predicted no increase in overall producer
prices and a +0.2% increase in the core rate. Energy prices fell for the third
straight month, down -1%. Yet the cost of food jumped +1.1% in August. Intermediate
prices fell -0.5% and crude goods rose +0.2%, the government said. Overall,
producer prices are up +6.5% compared to one year ago, while the core rate has
risen a slower +2.5% during that span.
On Tuesday it was reported that the cost of imports dropped -0.4% in
August. Economists had forecast import prices to fall -1%. Import prices rose
+0.3% in July and fell -0.7% in June. The cost of imports have fallen in two
of the past three months mainly because of lower fuel prices, which declined
-1.8% in August. Price-import data is viewed as key indicator of whether inflation
is rising or falling. Imports excluding fuel rose +0.2% last month, however.
Monday, September 12, 2011 4:03 p.m est.
The market hit lows right out of the gate as there were threats once
again of Greece defaulting and that it would affect European banks quite a bit
so Germany for example was off about -5% at one point. It did bounce around
lunch though with the Dow only seeing losses of -10.00 points, S&P 500 +2.00
points and the Nasdaq +20.00 points. New lows were hit midday though with the
Dow seeing -160.00 points, S&P 500 -17.00 points and the Nasdaq -30.00 points.
The final hour saw an announcement that China has decided to help out Italy
with their debt problems so the market turned around and rallied right into
the close finishing the day near highs.
At the close the Dow was up by +69.00 points to 11061.00, S&P 500
+8.00 points to about 1162.00, S&P 100 +4.00 points to 523.00 and the Nasdaq
Composite +27.00 points to about 2495.00. Oil interestingly was higher all day
closing up +$1.00 around the $88.00 level.
This is the final week of trading for the September expiration cycle
and it has been a volatile one so it will likely continue this week. There has
been a +15% increase in short interest since March but still far from the peak
levels of the financial crisis. Along with that there has been $36 billion in
outflows from equity funds, the second highest ever. Hedge fund managers have
been selling for months but they have been showing a little bit of evidence
that some are buying back in a bit. With $2 trillion under management, this
is an industry that could push the market higher at any given time, kind of
like today!
Last week's sentiment of investment advisers saw the percentage of
bulls and bears is nearly the same which is interesting considering the volatility
we’ve been seeing. This is unusual, as it is typical for bulls to outnumber
bears. On previous occasions when the two factions have been this close, buying
opportunities have occurred except 2008, when the bearish percentage was significantly
higher than the bullish percentage before stocks began a rally. It appears that
things need to get a lot more bullish or bearish to confirm a bottom or top
so the volatility will likely continue at least this week.
Friday, September 9, 2011 4:03 p.m est.
The market started the day lower once again as European woes continued
with Greek bonds now hitting 55%!! Could you imagine mortgage rates tied to
those rates!
The good news is that our 10-year bond fell to a sixty year low of
1.90% at one point today as investors looked for safe havens in bonds and the
American dollar. It’s hard to believe they would however after listening
to Obama’s speech last night sounding like he wants to borrow more money
for his continuing losing ideas to create jobs. The initial downfall wasn’t
bad though but after Juergen Stark, a top official at the European Central Bank,
stepped down, the market started to tank as everyone thought it was more than
just “personal reasons” he left. Lows were hit in the final hour
with the Dow seeing -370.00 points, S&P 500 -38.00 points and the Nasdaq
-75 but losses were cut by the close.
As we move into expiration week I’m sure the volatility will
continue with the market moving in both directions quite a bit. Actually, 19
of the last 24 sessions have seen triple digit moves in either direction with
the Dow! This is the kind of volatility I love for the style of trading we do
as premiums are hugely inflated so lets hope it continues at least for the next
couple of weeks!!!
At the close the Dow was down by -304.00 points to 10992.00, S&P 500 -32.00
points to about 1154.00, S&P 100 -14.00 points to 520.00 and the Nasdaq
Composite -61.00 points to about 2468.00. Oil was down pretty good -$2.00 to
close around the $87.00 level.
Thursday, September 8, 2011 4:03 p.m est.
Jobless claims this morning were once again disappointing remaining
about the 400,000 level so after a strong finish yesterday the market started
lower with the Dow off -60.00 points, S&P 500 -8.00 points and the Nasdaq
-15.00 points but of course it couldn’t stay down as everyone anticipated
Fed chief Ben Bernanke speech later on in the day that will hopefully reveal
another easing plan and then of course there is Obama’s speech later tonight
that will reveal an incredible plan to create millions of jobs. I mean really,
its not like these guys ever disappoint. I wasn’t surprised when Bernanke
said nothing and I’m sure it will be the same old same old from Obama.
Anyhow the Dow saw highs of +60.00 points, S&P 500 +6.00 points and the
Nasdaq +25.00 points but after Bernanke’s speech was released the market
fell once again with the Dow making new lows of -140.00 points, S&P 500
-15.00 points and the Nasdaq -30.00 points in the final hour.
At the close the Dow was down by -119.00 points to 11296.00, S&P
500 -13.00 points to about 1186.00, S&P 100 -5.00 points to 533.00 and the
Nasdaq Composite -20.00 points to about 2529.00. Oil was down pretty hard early
on but came back to close near the unchanged level, down -$.30 around the $89.00
level.
The number of people who are nearing retirement age but are having
to make changes in plans due to high debt burdens and other factors continue
to rise. According to The Wall Street Journal; "people are postponing retirement,
cutting living standards or both." According to Reuters: "the number
of Americans drawing Social Security retirement benefits will jump to 71 million
from about 55 million now." The center of the debt problem is mortgages
that are now in the hole due to the housing crash. According to The Wall Street
Journal: "Thirty-nine percent of households with heads aged 60 through
64 had primary mortgages in 2010 and 20% had secondary mortgages, including
home-equity lines, according to research group Strategic Business Insights'
MacroMonitor. That was up from just 22% and 12%, respectively, in 1994."
Those people can't sell their homes at a profit as often as they used to and
they can't borrow on their equity like they used to. Because they are getting
older many are turning to renting spare rooms as income. And finally, according
to The Journal: "People aren't saving enough either. As calculated in a
Wall Street Journal article earlier this year, the typical American household
nearing retirement with a 401(k) retirement account has less than one-quarter
of what it needs in that account to maintain its standard of living in retirement."
What this all means is that many people are now expecting to work for many years
into the future, despite their age, raising the retirement age. Usually as you
get older and “need” to work your income goes down so it will likely
continue to bring the standard of living down for the middle class until we
are about equal to the standard of living of the 1970’s and 80’s.
The next 10-years is going to be very interesting...
Jobless claims rose +2000 to 414,000 but economists expected them to
rise to a seasonally adjusted 411,000. Initial claims from two weeks ago were
revised up from an original reading of 409,000. The four week average rose by
+3,750 to 414,750, the highest level since mid-July. About 7.17 million people
received some kind of state or federal benefits, down -167,009 from the prior
week. Total claims are reported with a two-week lag. Continuing claims fell
by -30,000 to 3.72 million, reported with a one-week lag.
The trade deficit fell in July as record exports helped offset the
biggest trade gap with China in 10 months. The Commerce Department said the
trade deficit narrowed to a seasonally adjusted $44.8 billion in July from $51.6
billion in June, a decline of -13.1%, the largest percentage decline since February
2009. Economists had expected a $51 billion deficit. Downward revisions to the
nation’s trade deficits for April, May and June could mean the final reading
of second-quarter gross domestic product being revised upward from 1%. For the
first seven months of the year, the trade gap has been $329.8 billion, wider
than the $291.7 billion seen over the same interval during 2010.
In July there were a record $178 billion exports, up by $6.2 billion
from June, led by industrial supplies and materials, capital goods and the highest-ever
export of automotive vehicles, parts and engines. By contrast, imports $222.8
billion during the month, which was marginally lower than the $223.4 billion
in June but still near highs of the year. The decline came down to oil, as petroleum
imports shrank, as oil prices fell to $104.27 a barrel in July from $106 a barrel
in June and as Americans used 4% less imported energy products. For the year
to date, the trade gap with China has been $160.4 billion, +10% worse than the
same period of 2010. Exports to South and Central America of $14.7 billion,
however, were the largest on record in July, on demand from Brazil, Argentina
and Chile, helping the trade balance with the region turn positive.
Tuesday, September 6, 2011 4:03 p.m est.
How about interest rates like this! The Greek 2-year bond hit 50% at
one point today!!!
The market tanked once again this morning as European woes are back
once again as Greece is saying it may leave the Eurozone which basically means
it will default. It’s unlikely as Germany and France have a lot invested
in Greece but just saying it causes jitters to start. The Dow saw lows of -310.00
points, S&P 500 -34.00 points and the Nasdaq -65.00 points! It bounced off
of the lows though and the final hour saw a decent comeback but it was still
the worst first three day start to September ever.
At the close the Dow was down by -101.00 points to 11139.00, S&P
500 -9.00 points to about 1165.00, S&P 100 -6.50 points to 525.00 and the
Nasdaq Composite -7.00 points to about 2474.00. Oil was lower at one point down
almost -$3 at one point but it closed down -$.65 around the $86.00 level.
One thing that has been really nice about this expiration is the volatility!
Some of the trades being done on the sold options are equaling a 5 month supply
of trades! Some of them have even been able to be bought back and resold with
all of the up and down action. The month of August saw 14 days in which the
S&P 500 was up or down at least 1% which is the most we've seen in a month
since the flash crash month of May 2010. What’s interesting though is
that during the big August decline, there were just as many 1% up days as there
were 1% down days which is why its been great for selling option premium. August
had an intraday range of at least 1.5% and prior to that only 16% of trading
days in 2011 had such a substantial range. In fact, that's the first time we've
seen that kind of day-to-day volatility in over two years, since April 2009!
The average daily range spiked above 3% in September 2008 and July 2002 and
there were only two other spikes above 3% in the last 30 years. The first occurred
in October 1987, after the "Black Monday" crash, and the second happened
in September 1998, during the Russian default crisis. The volatility is likely
to continue for awhile but as September goes I’m sure it will slow as
the market gets tired of moving so much.
The Institute for Supply Management said its service-sector index rose
to 53.3% from 52.7% in July. Economists expected the services index to drop
to 51%. While readings over 50% indicate more firms are expanding than contracting,
the index is still sharply lower compared to its peak of 59.7% in February.
In a positive sign, the new orders index rose +1.1% to 52.8% and the backlog
of orders index climbed +3.5% to 47.5%. The employment index fell slightly,
however, and the price index jumped +7.5% points to a relatively high 64.2%.
Ten of the 18 service sectors tracked by ISM reported growth. The service sector
has areas such as health, finance and entertainment which accounts for 3/4 of
all economic activity and employs about four of every five workers. It’s
great that this indicator is up but employing 4 of every 5 workers isn’t
in my view. You’ve got to build it to see a robust economy in my view...
Friday, September 2, 2011 4:03 p.m est.
I wouldn’t suggest going to Greece for a holiday
anytime soon! Greece has just increased their VAT, (value added tax) from 9%
last year to 23%!!!
And here’s something that is different! For years people have always said
that the only reason America invaded Iraq was for its oil however in reality
they didn’t receive a drop for years as saddam hussein was only able to
sell it to other countries with a “food for oil” program and none
of it came America’s way. However it is making up for it now as the entire
world is scrambling to lay claim to Libya's oil. According to The Wall Street
Journal: "As world leaders debated how to help rebuild Libya, a global
race began to secure access to the country's oil and gas."
This morning the market was looking to open lower before
the employment report came out this morning but after it was more dismal than
expected, the market tanked right at the open. The Dow saw lows of -250.00 points,
S&P 500 -28.00 points and the Nasdaq -50.00 points! It did rally after that
a bit going into lunch hour but selling took hold in the final hour once again
with the Dow seeing lows of -290.00 points, S&P 500 -34.00 points and the
Nasdaq -80.00 points.
At the close the Dow was down by -253.00 points to 11240.00,
S&P 500 -30.00 points to about 1174.00, S&P 100 -2.50 points to 529.00
and the Nasdaq Composite -66.00 points to about 2480.00. Oil was sold pretty
good with the poor employment report indicating a slowing economy to close down
-$2.38 around the $86.55 level.
As we head into fall next week, ouch, I can’t
believe I’m saying that!!! After today’s dismal employment report
it is easy to say that the economy is flat at best. What it means is that those
who have jobs will continue to buy necessities and maybe once in a while spend
money on vacations and toys but they won’t go crazy because they’ll
always be worried they may lose their jobs! This morning the Presidents labor
secretary Hilda Solis was even attacked by CNBC’s financial hosts which
is a rarity and she didn’t even appear on Fox because she knew she was
really going to get it!! The question is what is Washington going to do to spur
growth. All she could say this morning was that Obama has a plan that will be
released next Thursday and that she is all for extending unemployment claims
and payroll taxes. Why try something new when everything your doing now is working!!!!
Anyhow that's one thing that investors are worried about.
The president has few admirers left in the business community and no one has
any hope for his highly hyped jobs speech, scheduled for next week. It’s
not expected to be anything that businesses will like, if his previous major
initiatives, such as health care reform are any hint of what could lie ahead.
Besides that he said himself it will only create a million jobs which is almost
an insult!!! The massive failure of several solar power firms, financed by the
government by half a billion dollars and backed by Mr. Obama, is a negative
background and if he mentions “green jobs” again he’ll likely
be run out of town!! He needs to put forth a credible jobs plan which has a
chance to pass Congress and to actually help people get back to work but the
bar is set so high that I give it low odds of success.
Then you have a report out from the WSJ reporting that
the Federal Housing Finance Agency is set to file suits against more than a
dozen big banks, accusing them of misrepresenting the quality of mortgage securities
they assembled and sold at the height of the housing bubble. The suits, which
are expected to be filed in the coming days in federal court, are aimed at the
Bank of America, JPMorgan, Goldman Sachs and Deutsche Bank, among others.
Goldman Sachs also pointed out this week in a leaked trading desk report to
high priced clients that Europe has big problems that many major banks are having
a hard time borrowing money and over the coming weekend we could actually see
two of their major banks say they need help. That's a lot of pressure on the
markets so even if Europe has another moderate to significant problem our markets
will have a problem rising.
Job growth was unchanged in August, the weakest performance
in almost a year and was the first time since World War II that the economy
had a net zero jobs created for a month. Employment in June and July were also
revised lower by a cumulative -58,000. Among the more disturbing numbers: the
amount of people "marginally attached to the labor force" rose to
2.6 million from 2.4 million. These are workers not included in the unemployment
count because they had not sought work in the past four weeks but have looked
in the past year. The weak report was lower than the +55,000 gain expected by
economists. A strike at Verizon cut -45,000 from payrolls in the month. Factory
payrolls fell by -3,000 in August after a +36,000 gain the prior month. Employment
at service-providers increased +3,000 in August and construction employment
fell by -5,000. The unemployment rate held steady at 9.1% as expected with average
hourly earnings decreasing -0.1% to $23.09. Economists had been expecting a
+0.1% gain. Earnings are up only +1.9% in the past year and that is very bad
news. Even worse is that people are working less with the average workweek falling
six minutes to 34.2 hours.
An alternative gauge of unemployment, which includes
discouraged workers and those with part-time employment, rose to 16.2% in August
from 16.1% in the prior month. The number of unemployed people rose slightly
to 14 million from 13.9 million in July. Over six million workers have been
out of work for 27 weeks or longer. The jobs picture was brighter in a separate
survey of households. The jobless rate held at 9.1% as the number of employed
increased by +331,000 and the share of the eligible population holding a job
climbed to 58.2% from 58.1%. However, private hiring, which excludes government
agencies, climbed +17,000 last month, the smallest increase since a decline
in February 2010.
Thursday, September 1, 2011 4:03 p.m. est.
The market was only down slightly at the open but rallied when manufacturing
came out a little better than expected but was still poor. The Dow saw quick
highs of +110.00 points, S&P 500 +11.00 points and the Nasdaq +30.00 points
but as the day wore on profit taking set in as traders started to worry about
the employment report tomorrow. The final hour saw the Dow off -130.00 points,
S&P 500 -16.00 points and the Nasdaq -40.00 points!
At the close the Dow was down by -120.00 points to 11494.00, S&P
500 -15.00 points to about 1204.00, S&P 100 -6.00 points to 542.00 and the
Nasdaq Composite -33.00 points to about 2546.00. Oil was again basically unchanged
to close around the $89.00 level.
Productivity fell by an annual rate of -0.7% in the second quarter
instead of a -0.3% drop as initially reported. Economists had forecast that
the revision would show a -0.6% decline on a seasonally adjusted basis. Worsening
productivity stemmed mainly from higher costs for labor. Unit-labor costs jumped
by an annual rate of +3.3% last quarter, up from an initial estimate of +2.2%.
Also, output of goods and services rose just +1.3%, not +1.8% as first stated.
The increase in hours worked remained the same at 2.0%. The hourly wages of
workers, adjusted for inflation, fell -1.4% instead of -2.1%. We have now had
three months in a row of negative productivity. The last time that this happened
was in 1973-74 and 1979. These were very rough times for the economy with strong
recessions so is this last three month period a warning, time will tell....
Jobless Claims fell by -12,000 last week to 409,000 and claims from
two weeks ago were revised up to 421,000 from an original reading of 417,000.
Economists had expected new requests for jobless benefits to drop to 405,000.
The average of new claims over the past four weeks, meanwhile, rose by +1,750
to 410,250. The monthly average is seen as a more accurate gauge of labor trends
because it smoothes out volatility in the week-to-week data. About 7.34 million
people received some kind of claims up +45,531 from the prior week. The number
of Americans who continue to receive regular state unemployment checks decreased
by -18,000 to 3.74 million.
Activity in the manufacturing sector grew slightly in August, according to a
closely followed index that nonetheless suggests the economy isn’t currently
in a recession. The Institute for Supply Management said its manufacturing index
slowed to 50.6% from 50.9% in July, marking the worst reading since July 2009
however. The index extended its string of readings above 50%, which indicate
expansion, to 25 months but barely. Economists had expected a reading on average
of 48.8%, and the 50.6% result was higher than every economist polled. The ISM
index was as high as 61.4% in February. Readings from new orders and production
weighed on the headline index in August as they contracted. The employment index
was positive at 51.8% but was -1.7 points lower than the July reading. The ISM
index is a long-running and seasonally adjusted series derived by asking purchasing
managers questions on new orders, production, employment, supplier deliveries
and inventories. Managers are asked the change in the current month compared
to the previous month.
Outlays for Construction projects fell -1.3% in July, the largest decline
since January. The decline came as a surprise to economists who were expecting
a +0.3% increase. The sharp drop in July was offset by sharp upward revisions
to May and June. The monthly construction data are highly volatile. Outlays
are up +0.1% compared with a year earlier. Spending on private and public projects
fell in July. Spending on private construction fell -0.9% after a +2% gain in
June. Residential construction fell -1.4% after a +1.1% gain in June. Non-residential
construction fell -0.4% after five straight monthly increases. Spending on public
projects fell -2.1% in July after rising +0.8% in the previous month. Public
construction is at its lowest level since December 2006.
Wednesday, August 31, 2011 4:03 p.m est.
Sign of the times: When in doubt, print your own money. A small town
in central Italy, Filettino does not like Italy's austerity measures. So it's
trying to become a principality. Thus, it's mayor, Luca Sellari 'has started
minting Filettino's own bank currency, the "Fiorito," with his photo
on the back, which he says is already being used by the townsfolk." Reuters
reported.
Whoops, yesterday I said it was the last day of the month but what
I meant to say was that it was that it was the last days of the month! Today
is the last day of trading so the market was up again on interesting economic
data. The much watched ADP employment came in worse than expected but because
it wasn’t as bad as it could have been the market rallied. When more data
came out worse than expected but again not into the depths of despair, the market
took off with the Dow seeing highs of +160.00 points, S&P 500 +18.00 points
and the Nasdaq +40.00 points. The final hour saw some profit taking and one
point the Dow was off -40.00 points, S&P 500 -3.00 points and the Nasdaq
-20.00 points!
In the end the Dow was up by +53.00 points to 11614.00, S&P 500
+6.00 points to about 1219.00, S&P 100 +2.00 points to 548.00 and the Nasdaq
Composite +3.00 points to about 2579.00. Oil was basically unchanged to close
around the $89.00 level.
From its intraday low on August 8th the market has now rallied just
about +12%! That’s a pretty good move in a short time and the market is
now quite overbought. With the employment report looming, a long holiday weekend
coming up and the start of a new month it will be interesting to see how September
turns out. It has been positive four of the last five years, averaging an almost
+2% return. That's a pretty decent performance, making September the fourth-best
month over the year. The last 10 years has seen September average a loss however
of about -1% ranking it ninth out of the 12 calendar months for the upside.
Historically whenever the market sells off in August, the last four months of
the year generally see the market rally though. Only once did the market end
lower and that was in 1981 so we’re likely to see volatility continue
into September. The average gain for the past 10 years is about +8% over the
last four months of the year so the bottom we saw at the start of the month
could be it for the rest of the year but in today’s market that’s
not a guarantee.
Private-sector payrolls increased a moderate +91,000 in August, led
by the service-producing sector and small businesses, according to the ADP employment
report. Economists were predicting the ADP figure would rise by about +100,000.
The July level was revised down to +109,000 from a prior estimate of +114,000.
Markets look to ADP's report on private-sector payrolls to provide some guidance
on the Labor Department's jobs estimate, which will be released Friday and includes
information on both private- and public-sector payrolls. Analysts expect the
report to show slow growth of about +53,000, compared with +117,000 in July,
and for the unemployment rate to remain at 9.1%.
Employers plan to cut -51,114 workers in August, -23% down on July's
16-month high of 66,414, according to consultancy Challenger, Gray & Christmas
which also said 2011 layoff figures are +47% higher than August 2010. In total,
employers have announced -363,334 planned layoffs in 2011. California, the District
of Columbia and New Jersey have been hardest hit, with the former experiencing
-45,105 layoffs since January.
Government agencies, which have borne the brunt of the layoffs this
year, announced their intentions to cut -18,426 staff, taking the total for
the year to -105,406. Reductions in the civilian and officer ranks in the military
were the main driver of the August cuts.
The Chicago business barometer, which also is called Chicago PMI, slowed
in August to a 56.5% reading from 58.8% in July, as managers in the region reported
slowing production and new orders and a shrinking in order backlogs. Though
the reading was ahead of expectations economists had anticipated a 53% reading
which puts the indicator at a 21-month low. Any reading over 50% indicates expansion,
and Chicago PMI has been in expansion for 23 straight months. The Chicago PMI
is closely followed because it's the last major regional indicator before the
national Institute for Supply Management's manufacturing gauge, which is due
for release tomorrow.
Orders for goods produced in factories rose +2.4% in July. Economists
expected orders to rise a seasonally adjusted +2%. Factory orders fell a revised
-0.4% in June, down from a prior estimate of a -0.8% decline. Orders for durable
goods, products meant to last at least three years climbed +4.1% in July. Orders
for nondurable goods edged up +1%.
Tuesday, August 30, 2011 4:03 p.m est.
Yesterday the market continued higher to close with an almost +3% gain.
Today the market started the day on the downside as economic data wasn’t
that great so the Dow saw lows of -60.00 points, S&P 500 -6.00 points and
the Nasdaq -15.00 points but because it was the last day of the month and the
Fed’s minutes from their last meeting were released indicating half of
them wanting more stimulus it rallied with the Dow seeing highs of +95.00 points,
S&P 500 +10.00 points and the Nasdaq +30.00 points in the final hour! So
far it looks like all of this volume will see the market close higher on the
day.
At the close the Dow was up by +21.00 points to 11560.00, S&P 500
+3.00 points to about 1213.00, S&P 100 +.66 points to 546.00 and the Nasdaq
Composite +14.00 points to about 2576.00. Oil was up +1.30 to close around the
$89.00 level.
Consumer confidence also fell in August as expectations dived, with
worsening views on future business conditions, jobs and income, the Conference
Board reported. The nonprofit organization said its consumer-confidence index
fell to 44.5% in August, the lowest level since April 2009 from a slightly downwardly
revised 59.2% in July. Economists had expected an August reading of 51.9%. Generally
when the economy is growing at a good clip, confidence readings are at 90% and
above. The expectations barometer tumbled to 51.9% in August, the lowest since
April 2009, from 74.9% in July, while the present-situation gauge fell to 33.3%
from 35.7%.
The gradual improvement in home prices continued in June with prices rising
+1.1% during June from May but are down -4.5% over the past year, according
to the closely followed S&P/Case-Shiller 20-city composite home price index.
Since the data are collected over three months, the report should be read as
one for the second quarter. Prices advanced +3.6% in the April-through-June
quarter from the January-through-March quarter. Nineteen of 20 cities saw monthly
advances. Despite those positive signs, home prices are still -32% below their
peaks, Cleveland in fact just moved over January 2000 levels. While all the
California cities as well as Dallas, Denver and Washington, D.C., bottomed in
2009, Las Vegas, Miami, Phoenix, Tampa and Detroit have set new lows this year.
“These shifts suggest that we are back to regional housing markets, rather
than a national housing market where everything rose and fell together,”
said David Blitzer, chairman of the index committee at S&P Indices. Other
home-price measures have painted a similar picture. Home prices advanced +0.6%
between the first and second quarters but declined 5.9% compared to the same
period in 2010, the Federal Housing Finance Agency reported using home sales
information from Fannie Mae- and Freddie Mac-acquired mortgages.
The Fed’s Open Market Committee said: On the economy: “Participants
noted a deterioration in labor market conditions, slower household spending,
a drop in consumer and business confidence, and continued weakness in the housing
sector. Manufacturing activity was reported to be mixed. Participants judged
that temporary factors affecting demand and production, including the damping
effect of higher energy and other commodity prices and the supply disruptions
from the Japanese earthquake, could account for only some of the weakness in
economic growth over the first half of the year.
While these effects appeared to be waning, the underlying strength
of the economic recovery remained uncertain. In addition, many participants
pointed to the recent downward revision to estimates of economic activity over
the past three years, and some to the financial market strains seen during the
intermeeting period, as contributing to a downgrade of the outlook for the economy.
Moreover, many participants saw increased downside risks to the outlook for
economic growth.” On whether to act: “Most members agreed that the
economic outlook had deteriorated by enough to warrant a Committee response
at this meeting. While all felt that monetary policy could not completely address
the various strains on the economy, most members thought that it could contribute
importantly to better outcomes in terms of the Committee’s dual mandate
of maximum employment and price stability. In particular, some members expressed
the view that additional accommodation was warranted because they expected the
unemployment rate to remain well above, and inflation to be at or below, levels
consistent with the Committee’s mandate.
A few members felt that recent economic developments justified a more substantial
move at this meeting, but they were willing to accept the stronger forward guidance
as a step in the direction of additional accommodation. Three members dissented
because they preferred to retain the forward guidance language employed in the
June statement.” On the pledge to keep rates low until mid-2013: “That
anticipated path for the federal funds rate was viewed both as appropriate in
light of most members’ outlook for the economy and as generally consistent
with some prescriptions for monetary policy based on historical and model-based
analysis. In choosing to phrase the outlook for policy in terms of a time horizon,
members also considered conditioning the outlook for the level of the federal
funds rate on explicit numerical values for the unemployment rate or the inflation
rate. Some members argued that doing so would establish greater clarity regarding
the Committee’s intentions and its likely reaction to future economic
developments, while others raised questions about how an appropriate numerical
value might be chosen.” On what options are available: “Reinforcing
the Committee’s forward guidance about the likely path of monetary policy
was seen as a possible way to reduce interest rates and provide greater support
to the economic expansion; a few participants emphasized that guidance focusing
solely on the state of the economy would be preferable to guidance that named
specific spans of time or calendar dates. Some participants noted that additional
asset purchases could be used to provide more accommodation by lowering longer-term
interest rates. Others suggested that increasing the average maturity of the
System’s portfolio — perhaps by selling securities with relatively
short remaining maturities and purchasing securities with relatively long remaining
maturities — could have a similar effect on longer-term interest rates.
Such an approach would not boost the size of the Federal Reserve’s balance
sheet and the quantity of reserve balances. A few participants noted that a
reduction in the interest rate paid on excess reserve balances could also be
helpful in easing financial conditions.”
On dissents: “Mr. Fisher discussed the fragility of the U.S.
economy but felt that it was chiefly nonmonetary factors, such as uncertainty
about fiscal and regulatory initiatives, that were restraining domestic capital
expenditures, job creation, and economic growth. He was concerned both that
the Committee did not have enough information to be specific on the time interval
over which it expected low rates to be maintained, and that, were it to do so,
the Committee risked appearing overly responsive to the recent financial market
volatility. Mr. Kocherlakota’s perspective on the policy decision was
shaped by his view that in November 2010, the Committee had chosen a level of
accommodation that was well calibrated for the condition of the economy. Since
November, inflation had risen and unemployment had fallen, and he did not believe
that providing more monetary accommodation was the appropriate response to those
changes in the economy. Mr. Plosser felt that the reference to 2013 might well
be misinterpreted as suggesting that monetary policy was no longer contingent
on how the economic outlook evolved. Although financial markets had been volatile
and incoming information on growth and employment had been weaker than anticipated,
he believed the statement conveyed an excessively negative assessment of the
economy and that it was premature to undertake, or be perceived to signal, further
policy accommodation. He also judged that the policy step would do little to
improve near-term growth prospects, given the ongoing structural adjustments
and external challenges faced by the U.S. economy.”
Monday, August 29, 2011 1:33 p.m est.
Interesting Poll: Recession more Bush's fault than Obama. Majority
trust own judgment over President's. According to Rasmussen Reports.com: "Most
voters continue to blame the struggling economy on the recession that began
during the Bush administration, but the number that trusts their own economic
judgment more than the president’s is at a new high. " "52%
of voters say the nation’s current economic problems are due to the recession
that began under George W. Bush. Forty-three percent (43%) blame Obama’s
policies for the poor state of the economy. Voters were more evenly divided
on this question in June." The funny thing is were now three years into
Obama’s period and the one we really need to blame for this is Barney
Frank!
"The latest Rasmussen Reports national telephone survey of Likely
Voters shows that 65% say they trust their own economic judgment more than the
president’s. Prior to this survey, this finding ranged from 49% to 63%
since Barack Obama took office in January 2009. Twenty-four percent (24%) of
voters trust Obama’s economic judgment more than their own, which ties
the lowest level of trust in the president to date. Another 12% are undecided."
This morning the market popped again as economic data was pretty good
and Europe was behaving itself, actually bragging about Greece’s latest
bond offering coming in around 10%!!! So far the Dow is seeing highs of +225.00
points, S&P 500 +29.00 points and the Nasdaq Composite +75.00 points. It
will be interesting to see if these gains hold for the rest of the day. We are
going into a long weekend holiday this coming Friday which will also have another
Employment report for us to look at so the market may temper itself a bit before
that!! We’re also getting quite overbought in the shorter term and hitting
previous resistance levels. Along with the fact that volume is dropping, it
may be hard to hold the gains as there are many people likely looking to get
out after the sell off we saw the past couple of weeks.
People spent more money than they took in July which shouldn’t
be a surprise in today’s world, largely on auto purchases as the personal
savings rate fell. What do you need to save more for anyhow when you can buy
a new car!! The income of workers rose +0.3% in July, but spending climbed an
even faster +0.8% and for now that makes the market happy! The rise in spending
matched the increase in February as the largest since summer 2009. Adjusted
for inflation, personal spending rose +0.5% last month, compared with a less
than -0.1% decline in June. Economists had forecast a +0.4% increase in personal
income and a +0.6% rise in consumer spending. The core PCE index was expected
to rise +0.2%. “Purchases of motor vehicles and parts accounted for most
of the increase in July and for most of the decrease in June.” Since spending
rose more than income, the individual savings in July rate dropped to 5.0% from
5.5% of disposable income. That is better than the mid 2000’s when it
was negative however. Adjusted for inflation, disposal income actually fell
-0.1% to mark the first drop in 10 months. Disposable income is the money people
have leftover after paying for food, fuel, housing costs and other necessities.
Inflation, meanwhile, rose +0.4% based on the latest reading from the personal
consumption expenditure price index. The index has increased +2.8% over the
past 12 months, pressured by rising gas prices. The core PCE, which excludes
volatile food and energy costs, rose a lesser +0.2%. The core index is closely
watched by central bankers and economists to gauge inflationary trends.
Consumer spending is by far the bigger source of growth, but people
have been reluctant to spend because of persistent weakness in the economy.
The jobless rate remains high at +9.1% and many companies area hesitant to hire,
prompting consumers to save more and cut their debts. Consumers won’t
sharply increase spending until the economy improves and more jobs become available,
but companies won’t hire lots of new workers until the economy improves
and consumers spend more so it seems were in a no win situation right now. The
increase in spending in July, mainly on autos likely won’t hold. Customers
took advantage of good deals and the availability of new models after a recent
shortage. An index of pending home sales fell -1.3% in July, the National Association
of Realtors reported. The index is nonetheless +14.4% above July 2010 levels.
A sale is listed as pending when the contract has been signed but the transaction
has not closed, and high levels of cancellations meant gains in the pending-home-sales
series in May and June didn't translate to the final sales as measured in the
existing-home-sales series.
Friday, August 26, 2011 12:05 p.m est.
Interesting: There is a Merrill Lynch report out that says there is
a "80 Percent" chance of a double dip recession. "The probability
of a double-dip recession is now above 80%, BofA Merrill Lynch modeling shows.
One strategist put that number at 100% and said the recession might have already
begun."The market started the day lower as economic data about GDP was
a bit lower than expected but at least remained in the single digit level so
it wasn’t as bad as it could have been. It was quickly forgotten anyhow
as everyone anticipated Fed chief Ben Bernanke’s speech just after the
open. The market did see triple digit losses at the open but when his speech
was released thirty minutes into trading the Dow saw quick lows of -230.00 points,
S&P 500 -24.00 points and the Nasdaq -40.00 points as I mentioned yesterday
would likely happen because he didn’t have any comments about another
QE3 program. Once traders caught their breath and realized that it was going
to be up to them and that one of Bernanke’s points was that they were
going to add a day to their next meeting to figure out what to do, the market
rallied back with the Dow now seeing highs of +150.00 points, S&P 500 +18.00
points and the Nasdaq +55.00 points!!! So far it looks like all of this volume
will see the market close higher on the day.
Fed Chairman Ben Bernanke put off a lengthy discussion of the easing options
available to the central bank until the next Fed’s Open Market Committee
meeting late next month. In a highly anticipated speech, Bernanke announced
that the Fed had decided to expand its September meeting to two days, September
20th and 21st to review the pros and cons of further easing. Many Fed watchers
had expected at least a discussion of the options in today's speech but Bernanke
refrained, saying it was still difficult to judge how recent stock market weakness,
debt-ceiling negotiations and the European debt crisis had impacted the economy.
The Fed does expect "a moderate recovery" to continue and strengthen,
he said. Bernanke criticized Congress, saying the recent debate over the debt
ceiling had hurt the economy.
The economy grew +1% in the second quarter, down from an original estimate
of +1.3%. The decline stemmed mainly from slower export growth and less restocking
of inventories. Economists predicted GDP would be revised down to +1% on a seasonally
adjusted basis. The increase in exports was lowered to +3.1% from +6%. Inventories,
meanwhile, increased by $40.6 billion, but that was less than the prior estimate
of $49.6 billion. On the upside, consumer spending rose +0.4% in the second
quarter instead of +0.1% as initially reported. Consumer spending is the single
biggest source of growth in the economy. Corporate profits, meanwhile, rose
+3% to $57.3 billion. Real disposable personal income, which adjusts for inflation,
rose +1% in the second quarter and +1.2% in the first quarter. That's higher
than the prior +0.7% estimate for each period. The core personal consumption
expenditure index - an inflation gauge that excludes food and energy prices
- rose +2.2%.
This is the 2nd estimate and many people were saying before that we
are in a 2nd Recession but they're looking kind of silly because even though
things are slower were still plodding along here. I have mentioned before that
to me we never got out of the first one or at least not enough growth to balance
out the first drop! Until our GDP is EXPANDING as opposed to bouncing back to
where it was, it’s not much of a recovery, but that doesn’t mean
it’s getting worse, either. All of the recent data is backward looking
data anyway and July Durable Goods was up +4% and Retail Sales have been ok
so 3rd quarter GDP could be a bit stronger. Inventories may be down and that’s
a negative but I think that’s a good thing as it means restocking should
be coming. Exports have also been picking up but government spending could throw
that off but hopefully Congress will get it together! We also need to watch
the GDP Deflator, which was +2.3% and that lowers the +3.4% increase in consumer
spending to +0.8% and that’s 70% of the GDP so that could end the story
right there. Al l in all were moving just like Japan now just slowly plodding
along! The main thing we need is jobs so we get wage inflation and until then
we are never going to recover…
Thursday, August 25, 2011 4:03 p.m est.
Yesterday the market was higher once again making it three straight
days of gains. This morning the market was looking to open lower but when it
was announced that Warren Buffet was going to buy about $5 billion of stock
of Bank of America the market shot up giving it a gain of +5% this week alone.
The Dow saw quick highs of +85.00 points, S&P 500 +13.00 points and the
Nasdaq +20.00 points. Because the move has been strong and their was a rumor
out that Germany may be downgraded and that they were going to put more restrictions
on short selling, the market started to fall and the Dow saw lows of -200.00
points, S&P 500 -22.00 points and the Nasdaq Composite -50.00 points. From
there it basically meandered as now everyone is interested to see what Ben Bernanke
will say tomorrow morning as it could be market moving. I don’t expect
to hear anything significant and after the initial reaction the market will
likely start moving in its own way once again. It will be an interesting end
to a strong week thus far!!
At the close the Dow was down -171.00 points to 11150.00, S&P 500
-18.00 points to about 1159.00, S&P 100 -7.00 points to 525.00 and the Nasdaq
Composite -48.00 points to about 2420.00. Oil was flat down -.31 to close around
the $85.00 level.
Jobless Claims rose +5,000 to 417,000, they were revised up to 412,000
from an original reading of 408,000 two weeks ago. Economists had expected them
to total 410,000. The data was boosted by a Verizon strike, applications for
jobless benefits but they remain at an elevated level which is associated with
subpar hiring trends. In a strong economy, claims usually fall far below 400,000
as companies rapidly add workers. The four week average rose by +4,000 to 407,500
while continuing claims fell by -80,000 to 3.64 million. The slow rate of hiring
explains why the federal government is still paying extra benefits to millions
of Americans. Some 3.64 million people received extended federal benefits last
week, down about -20,000 from the prior week. These people have already used
up state benefits, which usually last six months. A total of 7.29 million people
received some kind of state or federal benefit, down -45,989 from the prior
week.
Tuesday, August 23, 2011 4:03 p.m est.
The market continued higher today with it making triple digit gains
early on and it only slowed down when there was a 6.0 earthquake in Michigan
that was felt all along the eastern seaboard for some reason. Highs were hit
in the final hour with the Dow seeing highs of +330.00 points, S&P 500 +40.00
points and the Nasdaq +110.00 points as everyone was supposedly thinking that
Fed chief Ben Bernanke is going to announce a QE3 program on Friday. I think
it had more to do with the fact that bonds and gold sold off! The precious metal
was off -$60 today to $1830.00 after hitting a new high of $1909 overnight.
At the close the Dow was up +322.00 points to 11177.00, S&P 500
+39.00 points to about 1162.00, S&P 100 +17.00 points to 525.00 and the
Nasdaq Composite +101.00 points to about 2446.00. Oil rallied up +1.12 to close
around the $85.00 level.
I don’t think that Bernanke will announce anything this Friday
except that the Fed will be there if need be because were not in any type of
financial mess at all! Actually liquidity has risen quite a bit the past couple
of months. Here’s the reason why I say this isn’t 2008 all over
again like many people are trying to claim! Banks are in great shape “financially”
as they have plenty of cash! For the first time since 2006 the FDIC just reported
that they actually had a decrease in problem banks that are in trouble. Their
list of “problem” banks fell by 23 to 865 in the second quarter,
the first drop since 2006, as the cost for bad loans eased. The FDIC’s
confidential list of banks at greater risk of collapse shrank for the first
time since the third quarter of 2006 as lenders put aside less money to cover
bad loans and charge-offs dropped -42%. The $20.9 billion decline in charge-offs
was the largest since the recovery in credit quality, the FDIC said. “Banks
have continued to make gradual but steady progress in recovering from the financial
market turmoil and severe recession that unfolded from 2007 through 2009,”
Martin Gruenberg, the FDIC’s acting chairman, said today in a statement.
The deposit insurance fund, which protects customer holdings up to $250,000
per account in the event of a failure, was positive for the first time in two
years, the agency said.
Sure we may be slowing down and maybe even going back into recession
so that means that companies earnings are lower so the market could be down
a bit but no where near the levels were at now or at the least it should be
a slower drip lower as most bear markets are. Fair value for the S&P 500
right now is sitting around 12 which is on the low side anyhow so fundamentally
there is a bit of support around these levels! The big question for now though
is if we rally right into Bernanke’s speech we could see another down
draft but no matter what I think were getting close to a short term bottom that
should last at least a few more weeks.
New Home sales fell for the third straight month in July, -0.7% to
a seasonally adjusted annual rate of 298,000 and was a surprise to analysts.
The consensus forecast of economists was for new home sales to rise +1% to 315,000.
New-home sales in June fell a revised -2.9% to a 300,000 level compared with
the previous estimate of a -1% fall to 312,000. New-home sales are still up
+6.8% compared with a year ago. The supply of new homes inched down -0.6% to
a record low 165,000. The supply in relation to sales held steady at 6.6 months
in July. Median sales prices have risen +4.7% in the past year to $222,000.
The Richmond Fed said that its manufacturing index fell to -10% in
August from -1% in July, as shipments and new orders declined sharply. The Richmond
Fed gauge wasn't as bad as the -30.7% reading of a similar Philadelphia Fed
indicator which came out yesterday but was still the worst reading since June
2009. The Richmond Fed is a diffusion index, calculated by subtracting the percentage
of respondents who say activity has dropped from those who say it has increased.
Monday, August 22, 2011 4:03 p.m est.
Not surprisingly, the market popped at the open reversing the sell
off after Friday’s record lower August expiration close with the Dow seeing
quick highs of +200.00 points, S&P 500 +22.00 points and the Nasdaq +60.00
points in the first few minutes of trading. You could tell it wouldn’t
hold it though and about an hour into trading the Dow only had a gain of +5.00
points, S&P 500 -2.00 points and the Nasdaq -5.00 points. From there it
rallied again but the final hour saw stocks move back to lows once again.
At the close the Dow was up +37.00 points to 10855.00, S&P 500
+.30 points to about 1124.00, S&P 100 -.30 points to 509.00 and the Nasdaq
Composite +4.00 points to about 2345.00. Oil rallied today as the market bounced
+1.86 to close around the $84.00 level.
Interesting: According to The Wall Street Journal: "More than
three in five U.S. workers in their 50s and 60s plan on working past 65 -- and
47% of that group say they'll do so because they'll need the money or health
benefits, according to a 2011 study from the nonprofit Transamerica Center for
Retirement Studies." That being said it appears that the so called "New
World Order” based on financial engineering and globalization has failed.
It seems a certainty now that if you take jobs away from America, especially
manufacturing, people here will lose their ability to buy products because they
have no jobs. It also seems that no matter how much crap Washington tries to
sell the public, they are actually starting to figure out that the whole thing
is a scam, and that the government can't actually do everything for them and
they may actually have to start to think for themselves and plan their own lives
and futures.
The global economy is in bad shape because America, Europe, and China
are all in trouble. The U.S. is where it all started with the sub-prime mortgage
crisis increasing peoples debt levels to astronomic levels thus taking the economy
into the recession. Even though it was supposedly saved with another fake money
scheme, QE1 and 2, the now pathetic jobless recovery, and a possible double
dip recession has been the result. The sub-prime mortgage crisis took Europe
who bought a lot of the worthless paper churned out by Wall Street that was
backed by air. along with the other EU countries failing all over the place
creating a double barrel blow to the Europeans. China meanwhile had been the
beneficiary of U.S. bond interest, and big money flows from U.S. and European
corporations but the money which started streaming there right after 9/11 has
fueled the building frenzy in China and has also created a new wave of income
inequality and started corruption there. So....George Friedman put out a nice
piece over the weekend where he reached a nice understandable conclusion! The
reason that things are so bad right now is because the system that world governments
have created has failed, globalization just may not work! The question is, when
will it bottom out, I think we’ll know by this Friday when Ben Bernanke
speaks at Jackson Hole. If he doesn’t promise another stimulus program
I think we’ll be very close, if he does make something up, I think we’ll
continue to grind the “world” economy into the ground!!
Friday, August 19, 2011 4:03 p.m est.
The market started the day lower as Europe was down and it was expiration
so the Dow saw quick lows of -110.00 points, S&P 500 -10.00 points and the
Nasdaq -30.00 points in the first few minutes of trading. Once the S&P 500
cash indexes expiration number was settled it wasn’t surprising to see
the market turnaround and quickly rally with the Dow up +100.00 points, S&P
500 +12.00 points and the Nasdaq Composite +40.00 points. After that it once
again turned lower however and the final hour saw the Dow make lows of -180.00
points, S&P 500 -19.00 points and the Nasdaq -45.00 points and remained
there basically into the finish of the day. More out over the weekend.
At the close the Dow was down -173.00 points to 10818.00, S&P 500
-17.00 points to about 1124.00, S&P 100 -8.00 points to 509.00 and the Nasdaq
Composite -39.00 points to about 2342.00. Oil was basically unchanged on the
day to close around the $82.00 level.
Thursday, August 18, 2011 4:03 p.m est.
Yesterday was a pretty quiet day in the market with it closing mostly
flat but it made up for it today as European stocks were hit once again with
concerns about the transaction fee’s that Germany's Angela Merkel and
France's Nicolas Sarkozy want to charge the banks. There was a triple digit
loss right out of the gates but when the Philly Fed had an absolutely terrible
economic report on its area, the market tanked big time with the Dow seeing
lows of -530.00 points, S&P 500 -60.00 points and the Nasdaq -140.00 points
in the first 45 minutes of trading. From there volume dried up and the market
meandered around until the end of the day where the final hour saw the S&P
500 see -63.00 points and the Nasdaq -150.00 points. One thing that was very
interesting was that the 10-year bond hit 1.87% at one point today which hasn’t
been seen since 1945!
At the close the Dow was down -420.00 points to 10990.00, S&P 500
-53.00 points to about 1141.00, S&P 100 -22.00 points to 517.00 and the
Nasdaq Composite -131.00 points to about 2380.00. Oil was killed closing down
about -$5.00 to close around the $82.00 level. I think that with the start of
expiration tomorrow morning were going to see some more wild swings, likely
to the upside, but even more interesting is that the coming cycle is going to
be exciting as the August cycle is going to go down as one of the worst expiration
cycles ever!
Manufacturing activity weakened sharply in the Philadelphia region
in August, the Philly Fed reported. The bank's business condition index fell
to negative -30.7% in August from +3.2 in July and is the lowest level since
March 2009. The size of the decline surprised analysts. Economists expected
a slight decline in the index to +0.5. The headline business condition index
is a separate question and not a buildup of components. As a result, economists
pay close attention to the details of the report, which were also very weak.
The index for new orders fell to negative -26.8% in August from +0.1% in July
while the index for number of employees decreased to negative -5.2% from +8.9%
in the prior month. The prices paid index declined to -12.8% from +25.1% in
July.
Also negative was that the Consumer Price Index increased +0.5%, the
largest monthly gain since March. Energy prices rebounded +2.8% in July after
a -4.4% drop in June. Food prices rose +0.4% after a +0.2% gain in the prior
month. The core CPI, which excludes food and energy costs, was up +0.2% in July.
Economists were expecting the overall CPI to rise +0.4% while the core rate
was expected to rise +0.2%.
Jobless Claims also rose +9,000 to 408,000 and the increase was larger
than expected. The consensus forecast of economists was for claims to rise to
400,000. The four-week average fell -3,500 to 402,500. Continuing claims increased
by +7,000, to 3.7 million.
There was no good news all day as sales of Existing Homes fell -3.5%
in July to an eight-month low, with a high cancellation rate again taking its
toll on an already troubled housing market. The National Association of Realtors
said sales fell to a seasonally adjusted annual rate of 4.67 million. June's
data was upwardly revised to 4.84 million from an initially reported 4.77 million.
Economists had expected a 4.99 million annual rate for July. The numbers for
the second straight month went against the increase in pending home sales, again
showing the difference between agreed and closed transactions. Sales in July
were +21% above the same month of 2010, which represented the cyclical low following
the expiration of the home buyer tax credit. The median price was $174,000,
a decline of -4.4% from July 2010. June prices were sharply downwardly revised
to $176,100 from an initially reported $184,300, which NAR blamed mostly on
late-reporting data from the troubled Phoenix area.
The economy should expand at a "modest pace" through the fall, the
Conference Board said as it reported that its index of leading economic indicators
grew +0.5% in July, compared with a +0.4% gain expected by economists. "The
economy is slow, with little momentum, and shows no indication of acceleration.
The LEI is a weighted gauge of 10 indicators that are designed to signal business
cycle peaks and troughs. Among the 10 indicators that make up the LEI, six made
positive contributions in July, led by the real money supply. The largest negative
contribution came from the index of supplier deliveries. In June, the LEI rose
+0.3%.
Tuesday, August 16, 2011 4:03 p.m est.
There were a bunch of interesting tidbits out this morning:
Foreign investors have been dumping out of American assets. According to Reuters:
"Foreigners unloaded U.S. assets in June for a second straight month and
were net sellers of Treasuries for the first time in more than two years as
concern about a U.S. credit downgrade soured overseas demand." The wire
service added: "U.S. government notes and bonds suffered a net outflow
of $4.5 billion, the first since May 2009, as heavy selling by private investors
outweighed buying from central banks."
Starbucks CEO Howard Schultz says he'll withhold all donations to the
President and members of Congress until a fair budget deal is worked out and
is putting together a letter for other CEO’s to sign that they too will
withhold contributions! This could make the coming election interesting!
The market was looking lower this morning and after a huge three day
run of almost +10% bottom to top its not surprising. When economic data was
pretty good and Fitch came out and reaffirmed its coveted 'AAA' rating on the
U.S, with a long-term outlook of stable, Globex futures turned around and cut
losses quite a bit.
The Dow saw lows of -130.00 points, S&P 500 -12.00 points and the Nasdaq
-32.00 points After . The bad thing about it was that volume really dropped
off. As Germany's Angela Merkel and France's Nicolas Sarkozy unveiled a tax
plan, proposed a new euro-zone council and reaffirmed their commitment to defend
the euro, the market turned around and almost made it into green territory but
when they said that they weren't going to create Eurobonds the market fell once
again with new lows on the Dow of -190.00 points, S&P 500 -24.00 points
and the Nasdaq -60.00 points. After this buying came in to cut losses though
and at the close the Dow was down -77.00 points to 11406.00, S&P 500 -12.00
points to about 1193.00, S&P 100 -5.00 points to 538.00 and the Nasdaq Composite
-32.00 points to about 2523.00. Oil was mostly flat to close down about -$.030
to close around the $87.90 level.
Housing starts fell -1.5% in July, demonstrating the negative impact
on demand for new houses that comes from cheaper foreclosed homes, underwater
mortgages, tight lending standards and high unemployment. The Commerce Department
said starts fell to a seasonally adjusted annual rate of 604,000 from a downwardly
revised 613,000 rate in June. Economists had anticipated a 600,000 annualized
rate for July, and many had thought June's initial reading of 629,000 was too
strong. Single-family starts slipped -4.9% to 425,000 from a downwardly revised
447,000. Building permits, a less volatile statistic, fell -3.2% to an annual
rate of 597,000 in July, and June's data also was downwardly revised, to 617,000
from 624,000. Demand for apartments stayed strong, with starts for structures
with five or more units up +6.3%.
The output of the nation's factories, mines and utilities were up +0.9% in July
as auto assemblies rebounded and the output of utilities jumped because of hot
weather, the Fed said. The gain, the biggest since last December, was in line
with expectations. There were broad-based gains in July as production increased
for all major market groups. Factory activity alone rose +0.6% in July. Total
motor vehicle assemblies rose to 8.7 million unit annual rate in July from a
7.9 million rate in June. Excluding motor vehicles and parts, factory production
rose +0.7% in July. Capacity utilization,a gauge of slack in the economy rose
to 77.5% in July from 76.9% in June and is the highest level of capacity utilization
since August 2008.
Monday, August 15, 2011 4:03 p.m est.
Everyone expected a down day to start the week but instead the market
was up and remained that way all day, making new highs in the final hour! The
Dow saw highs of +215.00 points, S&P 500 +26.00 points and the Nasdaq +50.00
points. The bad thing about it was that volume really dropped off.
At the close the Dow was up +214.00 points to 11483.00, S&P 500
+26.00 points to about 1204.00, S&P 100 +11.00 points to 542.00 and the
Nasdaq Composite +47.00 points to about 2555.00. Oil was higher once again to
closing up about +$2.00 to close around the $87.60 level.
One of the things that might have helped the rally today was a statement
the Fed’s Atlanta President saying that “If additional actions are
required, I can assure you the Federal Reserve is not out of bullets. If the
anemic growth in the first half of this year is a soft patch in an ongoing,
moderately paced recovery, additional monetary stimulus is probably of limited
marginal value. But saying this is not the same thing as saying that monetary
policy would be ineffective if conditions deteriorate.
Expansion of the balance sheet or changes in the composition of the
Fed's asset portfolio are available, in my view. These could be quite effective,
particularly if done insufficient size, in the event that the economy retreats
back into contraction territory.”
The market has rallied about +7.5% from the bottom last week with volatility
falling back a bit but remaining high. Usually you will get either a retest
or bit of a pullback after such a big decline and then rally and this time around
shouldn’t be any different except that it may hold off for now as this
is an expiration traded week. Even if we do correct it would likely be a normal
correction but one thing is sure, we’re likely stuck in a new trading
range for a while until all of the problems are remedied. Some of the bulls
are already saying that its a V bottom similar to the March 09 low however I
don’t think so as that was after a +50% decline.
Last week the volatility index challenged the 48 area, as realized volatility
on the S&P 500 surged as a result of Monday’s sell-off but then retreated
the rest of the week. Usually its an encouraging sign when volatility drops
and this is no different. Since 1997, about when the index started to be tracked,
the volatility index has peaked five times on its six previous trips to the
upper 40’s. The only exception was the financial crisis in 2008, when
credit markets essentially stopped functioning but just as I have said, that’s
not the case today. If volatility can stay below 50 in the upcoming week, a
case can be made for another peak, which would be great but don’t forget
we may need some more confirmation that a bottom truly is in.
Manufacturing activity contracted in the New York region in August
for the third straight month, according to the Empire state survey from the
New York Fed. The Empire state index worsened to a negative -7.7% in August
from negative -3.8% in July. Economists had expected a flat reading. Readings
below zero indicate deterioration, with higher numbers of firms reporting that
conditions had worsened. The new orders index fell to negative -7.8% also, while
the shipments index improved to +3%. A reading of expected conditions six-months
ahead plunged to +8.7% in August from +32.2% in July and is the lowest level
since February 2009. It will be important to follow the national number because
if it is down again we may be headed back into a recession!
A measure of confidence in builders for new single-family homes remained
stuck at very low levels during August, according to a report from the National
Association of Home Builders/Wells Fargo home market index remained at 15% in
August, on a seasonally adjusted measure where readings over 50% are considered
"good," which hasn't been the case since April 2006. Two of the three
components, current sales conditions and traffic of prospective buyers, inched
higher, but the component measuring sales expectations for the next six months
declined two points.
Friday, August 12, 2011 4:03 p.m est.
Wow the market started the day to the upside even though if it was
on schedule to be down as it has changed direction for the past 8 sessions!
It did look like it was going to be a down open as overnight trading saw Globex
futures on the S&P 500 down -20.00 points at 3:00 a.m est but it came back
after France ignored its zero percent growth status this last quarter!
At the open the market was higher but it didn’t last long with
the Dow almost entering negative territory but the S&P 500 was down -1.00
point and the Nasdaq Composite -10.00 points. It did turn around though to move
back to old highs on the Dow of +150.00 points, S&P 500 +15.00 points and
the Nasdaq +25.00 points.
At the close the market broke tradition being up with the Dow seeing +126.00
points to 11269.00, S&P 500 +6.00 points to about 1179.00, S&P 100 +3.00
points to 531.00 and the Nasdaq Composite +15.00 points to about 2508.00. Oil
was pretty flat closing down about -$.50 to close around the $85.30 level.
Retail Sales rose +0.5% in July as consumers spent more money on autos,
gas, clothing and electronics. Excluding the volatile auto segment, sales still
rose +0.5%. Economists expected an overall increase of +0.7% on a seasonally
adjusted basis, or +0.3% excluding autos. Sales for June and May, meanwhile,
were also revised higher. Over the past three months, retail sales have climbed
+8.2% compared to the same period one year ago. Gas sales increased +1.6%, electronics
and appliances +1.4%, autos +0.5% and clothing +0.5%. Excluding gas, total retail
sales rose +0.3%.
A gauge of consumer sentiment fell pretty strongly to 54.9% in August,
the lowest level since May of 1980 from 63.7% in July, according to the gauge
from Thomson Reuters/University of Michigan. Stocks experienced extreme volatility
during the survey period for the preliminary August reading. Also, with a tough
employment environment and a malfunctioning Washington, consumers have been
concerned about current and future economic conditions. The sentiment reading,
which covers how consumers view their personal finances as well as business
and buying conditions, averaged about 87% in the year before the start of the
most recent recession. It’s obvious though that with Retail Sales up strongly
that is a better indicator of what sentiment really is.
Business Inventories increased a seasonally adjusted +0.3% to $1.52
trillion in June, marking an +11.1% increase from June 2010 levels. Economists
expected an increase of +0.4%. The total business inventories-to-sales ratio
based on seasonally adjusted data at the end of June was 1.28.
Thursday, August 11, 2011 4:03 p.m est.
I think volatility is coming to a fulcrum because when I went to bed
last night Globex S&P 500 futures were up about +15.00 points but when I
woke up they were down -15.00 points!!! The reason was because of a bunch of
rumors that French banks can’t meet their debt obligations! The problem,
they're rumors!!! The strange thing is that it was from Reuters, one of the
best news sources ever! The only good thing is that they had the courtesy to
say at the end of their statements that they couldn’t confirm the sources!
In the past they wouldn’t have even reported it then but I guess everyone
is looking for news nowadays!!! Nonetheless it took futures down as its easier
to sell now and ask questions later. When rationality came into play and Bank
of France Governor Christian Noyer said in a statement that French banks have
reported first-half results that underline their solidity in a difficult economic
environment and that their capital is "adequate and their medium and long-term
funding programs are being carried out under perfectly satisfactory conditions,"
the market turned around. Noyer also said that the recent market turmoil "doesn't
affect the financial solidity of French banks and the capacity to resist that
they have demonstrated since the start of the crisis," the statement added.
Anyhow this helped to turn European stocks around and futures so at
the open the market was higher and it built on it with the final hour seeing
the Dow making highs of +560.00 points, S&P 500 +65.00 points and the Nasdaq
+140.00 points. At the close the Dow was up +423.00 points to 11143.00, S&P
500 +52.00 points to about 1173.00, S&P 100 +22.00 points to 529.00 and
the Nasdaq Composite +112.00 points to about 2493.00. Oil rallied again up about
+$2.80 today to close around the $85.70 level.
I keep hearing an interesting stat out there that the market has to
fall another couple of percent to a -20% decline before it can go up and everyone
can call it a bear market. In case no one noticed we made a high at the beginning
of May and with that number we are now down -20%! Did I miss something or did
the rules change! Not that it matters either way but here’s something
interesting that no one else is talking about. If you do believe this is 2008
once again and want to go by the rule that we are moving into a bear market,
if you go back to the 2008 high and then trace a line to the initial slide you
find that the decline was exactly the same as we have just seen! The really
interesting thing though is that the timeline it exactly the same as when we
hit our recent in May! Coincidence maybe but the correlation is very interesting!
After that the market went back and forth like we are seeing now but in short
order it rallied about +8% before falling back to a lower high. Comparing this
to our current time frame it puts the market higher going into expiration next
week. After that it fell back again to make a lower high before rallying once
again to final peak before selling off strongly once again.
Or here’s another interesting comparison if you think the bull
market is just taking a respite! When we made our first initial high after the
March 2009 low the market sold off pretty strongly -14% pretty quickly but not
quite as steep as this week. It then bounced and finally made a lower low of
-16% before continuing the rally. We’re off a bit more and faster, but
its close. The point of these -15% plus declines I’m talking about is
that they actually occur more often then not in both bull and bear markets and
that after all of these declines volatility increased but some type of bottoming
process occurred for awhile.
So the next question is, are we still in the bull market or has it
changed to a bear? Personally I think we may have changed back to a bear unless
we can continue to rally higher instead of turning down again later this month.
There is still a lot to deal with in Europe and America but in the end all I
worry about where the market will be expiration to expiration so the longer
term doesn’t mean that much. The one thing this sell off has confirmed
is that September and October are likely to be pretty volatile now but because
the market will be testing itself to find its way back and forth, premiums will
be rich so it should be very profitable!!
It was reported this morning that Jobless Claims dropped by -7,000
last week to a seasonally adjusted 395,000. Initial claims from two weeks ago
were revised up to 402,000 from an original reading of 400,000. Economists expected
new claims to rise to 410,000. The average of new claims over the last four
weeks fell by -3,250 to 405,000, the lowest level since mid-April. Continuing
Claims fell by -60,000, to 3.69 million.
The Trade deficit widened by +4.4% in June to $53.1 billion, the largest
deficit in almost three years. The widening of the trade deficit was unexpected
as economists expected the deficit to narrow to $48.2 billion. Both imports
and exports weakened in June, but exports had a larger decline. The trade deficit
with China widened to $26.7 billion in June, the highest since September 2010.
The government also revised the deficit in May to $50.8 billion from $50.2 billion.
The June deficit suggests a downward revision to second-quarter GDP growth from
the initial estimate of a +1.3% annual rate.
Monday, August 8, 2011 4:03 p.m est.
So America gets downgraded from Standards and Poor’s Friday night
giving the bears an entire weekend to relish the moment and proclaim its the
end of the world and when I wake up Monday morning I see the American dollar
and the 10 and 30-year bonds actually rallying so I have to say, what downgrade!!!!
Nonetheless Globex futures were interesting as they were down about -2.5% likely
only because of the reaction of bonds and the dollar. It seemed that more of
the concentration was worries about Europe but it all came to a head after Obama
had to open his mouth and attack S&P for the downgrade and then make that
pivotal error of keeping the two governmental parties apart by talking about
the need for higher taxes!!! The Dow saw lows shortly afterwards of -610.00
points, S&P 500 -79.00 points and the Nasdaq Composite -170.00 points making
it the worst start to August ever. The next closest time was 1896 and for the
1900’s was 1990 with a -6% loss!!! The final hour saw a bit of a rally
start after S&P came out and said that not all stocks are worthy of a downgrade
so that little tidbit helped to cut losses almost in half or +3% but by the
close it fell to new lows once again with the Dow off -640.00, S&P 500 -80.00
points and the Nasdaq Composite -170.00 points. I have been calling for volatility
but unfortunately its only been in one direction but it will find a bottom and
when it does the market is really going to move...
At the close the Dow was down -635.00 points to 10809.00, S&P 500
-80.00 points to about 1119.00, S&P 100 -34.00 points to 509.00 and the
Nasdaq Composite -175.00 points to about 2358.00. Oil really took a hit closing
down about -$6.00 today to close around the $81.30 level.
The -12% decline the S&P 500 has seen over the first six trading days of
August is the worst start to the month in the S&P 500's history ever and
In 11-trading days the market has now fallen -17% and -9% in just 3-days. Things
are bad but with decent earnings, bonds and the dollar stable it seems that
its become way to bearish too fast so we could easily see a turnaround with
a huge pop in the market in the matter of hours to settle out a new range. The
question will be from what level and interestingly where we ended the day is
right where there is some strong support. Of course the index continued to decline
for the remainder of August in 1990 by -3.66%. It then rallied slightly from
September through the end of the year. There have been three other starts to
August where the S&P declined more than -3% (1982, 2002, 2004), and in each
of these instances, the index gained significantly for the remainder of August.
In 1982, the S&P then went on to gain +35% for the remainder of the year,
and in 2004, the index gained +14% over the rest of the year. In 2002, the index
was essentially flat for the remainder of the year after dropping -4% in the
first five days of August. That is more where I think we are now but through
all of the dismal news it is due for a bounce and today may have seen the lows.
One of the biggest indications at least in the short term is that the number
of stocks above their 50-day exponential moving average has dropped to a lower
level than during the 2008 and March 2009 lows so you can see how extreme we
are at right now! In addition, it is an extreme that suggests investors are
totally bearish on both the economy and stocks and are throwing in the towel.
I’ll likely have more out later tonight after looking at some charts.
Friday, August 5, 2011 4:03 p.m est.
The market popped higher this morning after the employment report came
in better than expected. The Dow saw quick highs of +175.00 points, S&P
500 +18.00 points and the Nasdaq Composite +40.00 points. Unfortunately its
never a good thing to see a pop after a big down day because you know its not
going to hold usually because there are margin calls from money managers occurring
and today was no different because the selling began pretty quick with the Dow
selling off to lows of -250.00 points, S&P 500 -33.00 points and the Nasdaq
Composite -100.00 points which takes the market off -15% from its yearly high.
Of course not five minutes after that the market went green again after the
announcement that the EU may buy the debt of Italy and Spain if they reform
their banking systems. After Italy said they would make reforms the market really
started to rally with the Dow seeing highs of +140.00 points, S&P 500 +12.00
points and the Nasdaq Composite +2.00 points, not back to highs but it confirms
that volatility is strong! Selling took hold in the final hour with all indices
going red but the finish indices were mixed!
At the close the Dow was up +61.00 points to 11445.00, S&P 500
-.73 points to about 1199.00, S&P 100 -1.00 points to 543.00 and the Nasdaq
Composite -24.00 points to about 2532.00. Oil remained lower closing flat up
about +$.05 today to close around the $86.90 level.
Yesterday was interesting as the sell off seemed to be very controlled
but the numbers were incredibly negative indicating huge panic selling. Advance-declines
were about 19 to 1 negative and up/down volume was the most incredible number
of all with only 19.7 million traded on the upside, and nearly 1.8 billion to
the downside on the NYSE. The advance-declines on Nasdaq were almost as bad
with 2452 down and only 208 up and that was about 11 to 1 negative. Up/down
volume was 38 million up and 3.75 billion to the downside, about a 100 to 1
ratio. What’s interesting about that is it has only happened seven other
times since 1994. Ten days later the market was up about +5% and three months
later was also higher in all seven instances! It will be interesting to see
if it happens once again...
The S&P 500 is now in bear market territory, along with many other
indexes but the index is actually doing fairly well, all things considered as
its only off about -4.5% for the year. The problem is that its been mostly in
the last ten days which have been extremely painful to investors who were betting
on steady growth in the economy and corporate earnings. The problem is that
most of the damage has been done to individual sectors in the market, many of
which are down double figures for the year, not to mention what they've lost
from their recent highs. For example the biotech area is off -11.8% for the
year, banking sector nearly -19% for the year and the housing stocks are off
nearly -17%. The main point is that seeing housing and banking off that much
underlies the basic problem in this economy. The U.S. was too reliant on housing
as a growth engine the past decade instead of manufacturing and innovation that
was America's industrial engine moving it overseas, thus taking away jobs and
adding to the inability of the U.S. economy to rebound. This is going to take
much longer to heal than anyone expects...
The economy added +117,000 jobs in July and an even larger +154,000
in the private sector while the unemployment rate fell to 9.1% from 9.2%, partly
because -193,000 people dropped out of the labor force, basically giving up
on looking for a job!!! The unemployment rate doesn’t count discouraged
workers or those who have stopped looking for a job or just part time jobs and
if you did, the jobless rate would have been 16.1%, down from a whopping 16.2%
in June. Job gains in May and June were also revised up by a combined +56,000.
Average hourly wages rose +10 cents, or +0.4%, to $23.13. The workweek was unchanged
at 34.3 hours. Economists had projected a +75,000 increase in jobs in July,
with the unemployment rate holding steady at 9.2%. Average hourly wages were
expected to rise +0.2%.
This was a better than expected number and when you look at it with
rose colored glasses its at least a start! However,,,,,the jobless rate has
stayed above +8% for 30 straight months now, the longest stretch of high unemployment
since the Great Depression in the 1930’s!!!! During times of growth you
normally see at least +200,000 jobs a month, and much larger increases would
be required for months on end to move the unemployment rate back down to expansion
levels. Once again the rate of hiring in July wasn’t even enough to absorb
the natural increase in the labor force, which requires about +125,000 new jobs
a month. .
Thursday, August 4, 2011 4:03 p.m est.
The market so far today is selling once again as Japan made a play
to sell the Yen which strengthened the U.S dollar. The market sold off enough
to hit the -10% from the recent high in at the start of May. The market was
down pretty good all day with lows hit in the final hour with the Dow off -525.00
points, S&P 500 -61.00 points and the Nasdaq Composite -135.00 points. The
past 10-days have seen a very controlled sell off and one of the reasons is
likely because of the low volume and the question of what the future holds!
Many people are screaming that its 2008 all over again but no its not! Yes things
are bad and the future looks bleak but companies have adjusted to the slowdown
now, stocks are cheap and earnings are good. This is a correction,,,,for now.
Besides that, which money manager wants to see a crash while on holidays!! I
think this is one of the reasons why they always seem to be in the September/October
time frame! People have come back from holidays, its the end of summer, kind
of depressing,,,,that is until you start thinking about Christmas!!!! Anyhow,
for now, “this expiration cycle” is now 11 days away from ending
so were likely near the end of this downturn. Pessimism is getting extreme and
the market is technically extremely oversold here so were at least close to
a bounce starting anytime!!! There are low expectations for the employment report
tomorrow so as I said yesterday it will be interesting to see how the market
reacts to the number.
At the close the Dow was down -513.00 points to 11384.00, S&P 500
-60.00 points to about 1200.00, S&P 100 -23.00 points to 544.00 and the
Nasdaq Composite -137.00 points to about 2556.00. Oil really sold off today
closing down about -$5.20 today to close around the $86.83 level.
Jobless Claims were down by -1,000 last week to 400,000. The number
was basically what economists were looking for. Claims from two weeks ago were
revised up to 401,000 from an original reading of 398,000. The average of new
claims over the last four weeks,fell by -6,750 to 407,750, the lowest level
since mid-April. The monthly average smoothes out volatility in the week-to-week
data. Continuing claims increased by +10,000, to 3.73 million. A total of 7.57
million people received some kind of government benefit in the week ended July
16th, down -75,192 from the prior week.
Wednesday, August 3, 2011 4:03 p.m est.
The market started the day slightly higher but a large sell program
took it down midday with the Dow off -170.00 points, S&P 500 -20.00 points
and the Nasdaq Composite -50.00 points but the market did turn around once again
to move into the green finishing the day similar to yesterday but on the upside.
Unfortunately the Dow didn’t match its record of 9 consecutive days down
by closing higher today. Its too bad because it was last done in 1978!! At the
close the Dow was up +30.00 points to 11896.00, S&P 500 +6.00 points to
about 1260.00, S&P 100 +3.00 points to 568.00 and the Nasdaq Composite +24.00
points to about 2693.00. Oil continued taking a hit down about -$2.60 today
to close around the $91.00 level.
Payrolls at companies increased by a quiet +114,000 in July, suggesting
modest job growth continued in the fragile economy, according to the ADP employment
report. It was the 18th straight month of job growth in the report. Economists
were predicting the figure would rise by +85,000 in July after increasing by
a revised +145,000 reported in June however there has been a huge discrepancy
between these numbers and the actual employment numbers. There were modest downward
revisions to earlier months data totaling +12,000. June’s gain was initially
reported as 157,000. The ADP report covers only private-sector employment, and
not government jobs. Economists are looking for a gain of +75,000 in total employment
in July, with the nation’s unemployment rate pegged to remain steady at
9.2% on Friday’s employment report.
Outplacement firm Challenger Gray and Christmas said planned layoffs
surged by 59% to 64,414 in July and is the highest monthly total since March
2010. The bulk of the planned job cuts occurred in just five companies: Merck,
Borders, Cisco Systems, Lockheed Martin and Boston Scientific.
The Institute for Supply Management on Wednesday said its service-sector
index fell to 52.7% from 53.3% in June. Economists expected the services index
to rise to 53.5%. While readings over 50% indicate more firms are expanding
than contracting, the index is sharply lower compared to a recent peak of 59.7%
in February. The new orders index dropped -1.9 percentage points to 51.7% and
the backlog of orders index declined -4.5 percentage points to 44.0%. Thirteen
of the 18 service sectors tracked by ISM reported growth. The service sector
areas covered are areas such as health, finance and entertainment which accounts
for three quarters of all economic activity and employs about four of every
five workers.
Factory orders fell -0.8% to $440.7 billion in June, May's data was
downwardly revised to show +0.6% growth instead of +0.8%. Economists had anticipated
a -0.9% drop in June. Inventories, up twenty of the last twenty one months,
rose +0.2% to $594.4 billion, the highest since the series started in 1992.
June durable-goods orders was revised to show a -1.9% fall instead of the initially
reported -2.1% decline.
Tuesday, August 2, 2011 4:03 p.m est.
Yesterday the market started the day strongly as it was announced there
was a debt deal made but by the close it was down slightly. Today the selling
continued as there was more negative economic data out indicating that this
Friday’s employment report may be weaker than expected. It wasn’t
that bad though until the final hour where selling really took hold. The market
basically closed at its lows with the Dow off -267.00 points, S&P 500 -33.00
points and the Nasdaq Composite -76.00 points.
At the close the Dow was down for the eighth day -266.00 points to
11867.00, S&P 500 -33.00 points to about 1254.00, S&P 100 -14.00 points
to 565.00 and the Nasdaq Composite -75.00 points to about 2669.00. Oil has been
lower the past couple days closing down about -$1.10 today to close around the
$94.00 level.
July is finally over which is good news, considering the market was
off by more than -2%. It's now been three straight months of negative returns
for the market, which hasn't happened since November 2008. Unfortunately, seasonality
data may not offer much hope in the end as we have started August just as bad.
Over the last 30 years, we find that August tends to be a very mediocre month
overall though. In fact, its one of the lowest for rallies only up about .50%,
the fourth lowest of all the months. So far its looking like this month will
be like that already down -3% and its only the second day of the month!! We’re
pretty oversold here so it will will be interesting to see if we start bottoming
out here, I would suspect that the employment report on Friday may provide a
reason for a turn even if its is bad as we are seeing rumor selling now. September
has historically been the worst month, on average, over the past 30 years. Therefore,
when you look at two-month time frames, the August-September period shows the
lowest average return. While the median return and percent positive of this
period aren't the lowest, they're still less than impressive compared to other
time frames. However, four of the last five years has seen the August-September
period up about +3.5%.
The Income of workers rose slightly in June, but they spent less and
saved more at the same time that consumer prices fell, according to government
data. Personal income increased a seasonally adjusted +0.1% on the month, the
smallest gain since last November. Spending by consumers, however, dropped -0.2%
to mark the first decline in nearly two years. Adjusted for inflation, personal
consumption fell less than -1% in June. As a result, the individual savings
rate for June climbed to the highest level of 2011, +5.4% of disposable income,
up from +5% in May. Inflation, meanwhile, also declined in June based on the
latest reading from the personal consumption expenditure price index. The index
decreased -0.2%, likely reflecting a drop in oil prices. Yet the core PCE, which
excludes volatile food and energy costs, rose +0.1%, suggesting prices for many
other consumer goods remain elevated. Economists had forecast +0.1% increases
in both personal income and consumer spending for June. The government also
revised data on consumer spending in May to show an increase of +0.1%. Personal
income for May was revised down to an +0.2% increase instead of an originally
reported +0.3%. Consumers’ spending ranks as the single biggest contributor
to expansion in the economy, accounting for as much as two-thirds of growth.
Yet consumer spending barely rose in the second quarter, up a measly +0.1%,
in a reflection of the weakened state of the economy.
Yesterday it was reported that the Institute for Supply Management's manufacturing
gauge in July dropped -4.4 points to 50.9%, barely staying above the 50% no-change
line and coming in below economists forecast's of 54.3%. The new orders index
fell into negative territory, and indexes for prices and employment in particular
saw big drops.
Outlays for Construction projects rose +0.2% in June. The gain was
in line with expectations. Outlays are down -4.7% compared with a year earlier.
Spending on private construction paced the increase, rising +0.8% compared with
a +0.3% gain in May. Residential construction fell -0.3%. Non-residential construction
rose +1.8%. Spending on public projects fell -0.7% after remaining flat in May.
By itself, the data suggests little revision to second quarter GDP. The government
assumed a +0.3% rise in construction spending in its initial estimate of second
quarter growth. The economy grew at a sluggish +1.3% pace in the second quarter.
Friday, July 29, 2011 4:03 p.m est.
Funny thing, Apple has more cash on hand right now than the government
with $75 billion and the government $73 billion! Maybe we need to see them take
over, Iphones for everyone in government!!!!!
Treasury bills are now in question with regard to safety which really
should be unthinkable! These are the gold standard of investment safety and
quality but the U.S. Treasury bill is being questioned with regard to risk by
investors. According to The Wall Street Journal: "As gridlock continues
in Washington, many in the market are scrambling to figure out which debt would
be most in danger of defaulting and a possible candidate, the Treasury bill
that matures August 4th."
The market was looking to open lower once again as Globex futures were selling
off after a vote by the Republicans fell through but when second quarter GDP
came in much worse than expected it fell even more. Lows were seen in the first
few minutes of trading with the Dow off -150.00 points, S&P 500 -17.00 points
and the Nasdaq Composite -40.00 points but when it looked like a deal may come
through the market rallied taking it into the green with the Dow up +2.00 points,
S&P 500 +2.00 points and the Nasdaq Composite +15.00 points. Unfortunately
that fell through and people didn’t want to hold for the weekend so it
was sold again closing lower.
At the close the Dow was down -97.00 points to 12143.00, S&P 500
-8.00 points to about 1292.00, S&P 100 -4.00 points to 581.00 and the Nasdaq
Composite -10.00 points to about 2756.00. Oil was sharply lower today as it
makes its way back to the mid $90’s closing down about $1.50 to close
around the $96.00 level.
Gross domestic product expanded at only a +1.3% annual rate in the
second quarter, after a downwardly revised +0.4% gain in the January-March quarter.
Economists had forecast GDP growing at a +1.6% rate in the second quarter from
a previously estimated +1.9% rate in the first quarter. This was the weakest
six months period since the recovery began in the second quarter of 2009. Growth
in the second quarter was held down by weak consumer spending, which only expanded
at a +0.1% rate. State and local government spending was also weak in the quarter.
Inflation, as measured by the core personal consumption expenditure index, rose
+2.1% in the second quarter, the fastest pace since the fourth quarter of 2009.
The Chicago PMI slowed to a reading of 58.8% in July from 61.1% in
June, though that marked the 22nd month the indicator was above the 50 line
indicating expansion. Economists had expected a 61.9% reading. Indexes for production
and new orders fell, while order backlogs bounced back into positive territory.
The employment index dropped sharply, to 51.5% from 58.7%.
A gauge of consumer sentiment fell to 63.7% in July, the lowest level
since March 2009 from 71.5% in June, according to media reports of the gauge
from Thomson Reuters/University of Michigan. A preliminary reading for sentiment
in July was at 63.8%. Economists had expected a final July reading of 64.3%.
Washington's stalled debt negotiations and a tough employment environment have
been taking a toll on consumer sentiment, analysts say. The sentiment reading,
which covers how consumers view their personal finances as well as business
and buying conditions, averaged about 87% in the year before the start of the
most recent recession.
Thursday, July 28, 2011 4:03 p.m. est.
Yesterday the market sold off pretty good as the talks about the debt
increase were non existent and got worse after the Fed reported a weakening
economy midday.
The Dow closed near its lows of -200.00 points, S&P 500 -27.00
points and the Nasdaq Composite -75.00 points. Today the market started a bit
lower but turned higher as short term it is quite oversold. The Dow saw highs
of +80.00 points, S&P 500 +12.00 points and the Nasdaq Composite +40.00
points. By midday those gains started to slip however and the market turned
into the red to close near its lows of the day except the Nasdaq which was able
to squeak out a gain.
At the close the Dow was down -62.00 points to 12240.00, S&P 500
-4.00 points to about 1301.00, S&P 100 -2.00 points to 584.00 and the Nasdaq
Composite +1.00 points to about 2766.00. Oil was lower on the day but not by
much closing down about $.30 to close around the $97.00 level.
As we approach the weekend and no deal is being made more and more
commentators are talking about another 2008 crash. Yes it is a bad thing but
the country actually won’t go into default for another 10-days after the
August 2nd deadline and may even be extended more after that as revenues have
been strong of late for the government. Even though were seeing both sides still
fighting it out Obama could easily put through legislation that will allow the
country to operate anyhow, but of course the media is ignoring that fact because
its not exciting! S&P would then likely put another threat out about a downgrade
but for them to actually do it would likely take another month, just in time
for that fall crash period!!! We are on a slippery slope towards that but many
things are different now with the Fed providing support and the economy is already
in the dumps. One big difference is that earnings are much better than back
then so there is support there. Right now this seems more like the April/May
1979 t-bill default which only caused a .06 % change in interest rates. You
would think that if a default was coming interest rates would already be on
the rise but instead they’re actually moving down as people are looking
for safety. The stock market then was pretty much in a trading range, the rest
of the year and that’s likely what we’ll do now. This default in
the end is going to be bad for stocks but for now it will likely be contained
as the Fed will do anything to keep interest rates low. Eventually if bonds
do take a hit, interest rates would likely rise to 4% on the ten year and 5%
on the 30 year and that could see the market down about -10% but not likely
in one day!
Jobless Claims dropped by -24,000 to 398,000 but Initial claims from
two weeks ago were revised up to 422,000 from an original reading of 418,000.
Economists had expected new requests for jobless benefits to fall to 413,000
in the latest week. The average of new claims over the past four weeks fell
by -8,500 to 413,750, also the lowest level since April. The monthly average
is seen as a more accurate gauge of labor trends because it irons out volatility
in the week-to-week data. Economists say claims would have to continue to fall
to indicate improvement in hiring trends. Until the past week, jobless claims
had topped the key 400,000 level for four months after hitting a three-year
low of 375,000 in late February. Applications usually fall far below 400,000
in a period of rapid hiring. Continuing claims fell by -17,000 to 3.7 million.
Pending home sales rose +2.4% in June, driven by gains in the West
and the South, according to an index released by the National Association of
Realtors. The pending home sales index rose to 90.9 in June from 88.8 in May
and was +19.8% above June 2010 levels, which was the low point following the
expiration of the home buyer tax credit. A sale is listed as pending when the
contract has been signed but the transaction has not closed, though the sale
usually is finalized within one or two months of signing. Cancellations led
to a decline in the June existing-home sales report despite the strength in
the May pending home sales report.
Yesterday it was reported that weaker orders for airplanes and automobiles
translated into a steeper-than-forecast -2.1% decline in durable-goods orders
in June, the Commerce Department. It was the second large drop in the past three
months for durable-goods orders, raising fears that manufacturing is running
out of steam after leading a tepid recovery over the past two years. Without
a strong manufacturing sector, it is hard to see how forecasts of a strong second-half
recovery can be realized. The decline in orders in June followed a revised +1.9%
rise in May and a -2.5% drop in April. The decline was a surprise to economists
surveyed as they had forecast a flat reading.
It was soft labor markets and weak real estate offset a slight boost
to consumer spending and an encouraging start to the tourism season, the Fed
reported in its Beige Book on the U.S. economy. The Beige Book, which is based
on information collected on or before July 15th, said growth has slowed in the
majority of districts, particularly those nearest the Atlantic seaboard, with
the Minneapolis district hurt by the now-concluded state government shutdown.
That represents a slightly worse result than the June 8th Beige Book, when seven
districts grew at a steady pace. It confirms economic data showing poor growth
from April to June. Consumer spending rose, helped by “modest” growth
of non-auto retail sales, which the report said may have been the result of
falling gas prices. Auto sales slowed, however, with inventories still lean
due to Japanese supply chain disruptions. The Labor Department reported that
the unemployment ticked up to 9.2% in June. Price pressures moderated somewhat
though some firms have been able to pass on some cost increases to customers,
the Beige Book said.
Tuesday, July 26, 2011 4:03 p.m. est.
Yesterday the market was lower on worries about the country defaulting
in seven days as both sides are still far away from a deal. It was interesting
to hear commentators over the weekend saying that if something wasn’t
done by Sunday night the world markets would collapse! That’s when you
know its not going to happen!!! At its worst the Dow saw lows of -140.00 points,
S&P 500 -14.00 points and the Nasdaq Composite -40.00 points but by the
close they were cut more than in half. Today the pressure was still there so
it started down again with the Dow seeing lows of -100.00 points, S&P 500
-8.00 points and the Nasdaq Composite -10.00 points. Tech stocks were strong
though with Apple moving over the $400 level so the market came back with the
S&P and Nasdaq actually moving into positive territory going into the final
hour.
Unfortunately it didn’t hold because at the close the Dow was
down -92.00 points to 12501.00, S&P 500 -5.50 points to about 1332.00, S&P
100 -2.50 points to 597.00 and the Nasdaq Composite -3.00 points to about 2840.00.
Oil was lower on the day to start but closed higher in the end up about +$.45
to close around the $99.50 level.
There has been significant progress made on overseas bailouts, even
as the debt debate here in America has been inching along but one thing that
has helped the market with support has been earnings. On the whole, second-quarter
earnings have been very strong so far but investors are still finding reasons
to doubt them and that may be because some companies are seeing a slowdown on
the way. Still you would think that better than expected earnings would start
a rally but one of the reasons may be that confidence in the economy is abysmal
because the jobs market is so bad. "Nationally, the average duration of
jobless in America shot up to 39.9 weeks as of June, or about 10 months, which
is a record high since 1948." "A year after the official end of the
recession, the percentage of the long term unemployed (out of work for 27 weeks
or more) now stands at 44.4% (or 6.3 million people) of the total jobless, up
from the 43.1% level last June. Those out of work for a year or longer jumped
to around 4.4 million, or 30.3% of all unemployed." What's more worrisome
is that: "more than two million (2,039,000) Americans (over 14% of the
unemployed, up from 9% in 2010) have been out of work for 99 weeks or longer.
Huffington Post reported that this is the first time since the 99 week statistic
has been tracked that it has exceeded the two million mark." The Huffington
Post (not known as a conservative publication) is even saying that "Hope
is gone. The future is terrifying."
There are plenty of workers to choose from for any rare job opening.
According to Econmatters.com: "The elevated long-term unemployment could
be partly attributed to the fact that there are 4.7 unemployed workers in May
for every job available, i.e. 13.9 million jobless competing for 3.0 million
job openings. The ratio was the same as in April and has never risen above 4-to-1
for nearly 2.5 years, whereas in the 2001 recession, the ratio never exceeded
2.8-to-1, according to the Economic Policy Institute." With ongoing debt
worries and the economy not moving the great earnings are being offset so its
understandable that the market is falling but not by that much so we continue
in this sideways action we’ve basically been in since March! We are near
the top of the range right now so If we actually see a default in seven days
we could still see a significant correction start however right through support!
This morning it was reported that Consumer Confidence rose in July
on improved expectations, the Conference Board reported. The nonprofit organization
said its consumer-confidence index increased to 59.5% in July from a downwardly
revised 57.6% in June. Economists had expected the July reading to decline to
55.3% on concerns about the debt ceiling. Generally when the economy is growing
at a good clip, confidence readings are at 90% and above. The expectations index
rose to 75.4% in July from 71.6% in June, while the present-situation gauge
fell to 35.7% from 36.6%. "Overall, consumers remain apprehensive about
the future, but some of the concern expressed last month has abated," said
Lynn Franco, director of the Conference Board's consumer research center, in
a statement.
Sales of new single-family homes fell -1% in June to an annual rate
of 312,000, as purchases in the Northeast dropped to the lowest level on record,
the Commerce Department reported. Economists had expected housing starts to
increase to an annual rate of 325,000 on a seasonally adjusted basis. Sales
for May were revised slightly lower to an annual rate of 315,000. The median
sales price jumped +5.8% to $235,000 last month from $222,400 in May. At the
current sales pace, there was a 6.3 months supply of new homes. The number of
newly completed homes on the market at the end of June, meanwhile, fell to a
record low of 164,000.
Friday, July 22, 2011 4:03 p.m. est.
It was interesting when earlier in the week that Steve Wynn a well
known casino/resort owner in Las Vegas came out publicly slamming the Obama
administration saying that doing business in America today is the worst he has
ever seen in his life,,, and he’s a Democrat!! At first I thought it was
a one time deal but last night Caterpillar reported earnings that were worse
than expected and they said that China is slowing down but their main point
was saying that the Obama administration basically sucks for business!!! This
could turn out to be quite interesting for Obama if more and more companies
start talking....
The market was lower today on profit taking, Caterpillars poor earnings
and the fact that the GOP came out said that in reality the talks with the Obama
administration about the debt crisis are non existent! The Dow saw lows of -90.00
points, S&P 500 -8.00 points and the Nasdaq Composite -5.00 points. The
market became mixed midday however as tech stocks were strong on decent earnings
from AMD but the Dow was still in the red but the S&P 500 saw slight gains
of +3.00 points and the Nasdaq Composite +30.00 points.
At the close the Dow was down -43.00 points to 12681.00, S&P 500
+1.22 points to about 1345.00, S&P 100 +.35 points to 602.00 and the Nasdaq
Composite +24.00 points to about 2858.00. Oil was higher again up about +$.75
to close around the $100.00 level.
The other night I saw that movie Larry Crowne with an e as he said.
It was a great movie about life in America today. In the movie he is a regular
middle aged man working at Umart ala Walmart, and gets fired for not having
a college education. His house has a bigger mortgage than what’s its worth
so its going to be foreclosed on but he's optimistic. As time goes on he becomes
discouraged however as he can't find a job anywhere! In the end he ends up gong
to college and learns that its easier to walk away from paying his mortgage
instead of even attempting to pay it. It was a great example of the problem
in America today.
According to Bloomberg; "The U.S. homeownership rate has fallen
below 60% when delinquent borrowers are excluded, a sign of the country’s
move toward a “rentership society.” Meanwhile, The Las Vegas Review
Journal (LVRG.com) reports: "The vast majority of Americans (77%) are stressed
by at least one thing at work, finds the Harris Interactive-Everest College
Work Stress Survey." According to the report: "The most common issues
are: low pay, commuting, unreasonable workload and concern over being fired
or laid off." Other reasons for stress are "annoying coworkers - difficulty
with a boss, poor work-life balance and lack of opportunity for advancement."
Bloomberg added that the national renter rate "which stood at
66.4% on March 31st, would be 59.7% without an estimated 7.5 million delinquent
homeowners who may be forced into renting, according to Morgan Stanley analysts
led by Oliver Chang. The lowest homeownership rate on record was 62.9% in 1965,
the first year the Census Bureau began reporting the data." According to
the report: "The homeownership rate reached an all-time high of 69.2% in
2004." While many Americans don't want to rent a home forever, the rate
of worrying remains alarming. According to LVRG.com: "Concerns over low
pay and job security are consistently one of the top stressors for Americans.
In most regions of the U.S., 16 percent of Americans listed low pay as their
top stressor, and concerns over job security were a close second. For example,
13 percent of college graduates ranked losing their job as the biggest stressor,
which is in line with Americans without college degrees." This may be one
reason so many are looking to change careers. In many cases, the move toward
a new career seems to be leading toward healthcare, which is viewed as a stable
field.
It's increasingly clear that two major trends in America have been reversed.
First, homeownership was a pillar of society, traditionally being optimistic
and would do anything to own a home! Second, Americans have been relaxed about
life in general, given the history of a decent economy, despite an occasional
recession. The fact that people are moving toward renting their homes now, coupled
with the rise of stress, in my opinion is a significant set of changes.
Thursday, July 21, 2011 4:03 p.m. est.
Yesterday the market closed down a little as it was basically a quiet
day but today it started the day strongly higher after it was announced that
there was a deal made with France and Germany over Greece having a “selective
default.” Not sure how that’s good news but more of an excuse for
the bulls to run. When economic data came out revealing that Jobless Claims
continue to get worse the market ignored it and focused more on the fact that
the Philly Fed didn’t sneak further into the red so the Dow saw highs
of +190.00 points, S&P 500 +21.00 points and the Nasdaq Composite +40.00
points. It’s obvious the computers are in control once again and that
were likely just going to see volatility pick up here once we reach an overbought
level.
At the close the Dow was up +153.00 points to 12724.00, S&P 500
+18.00 points to about 1344.00, S&P 100 +8.00 points to 602.00 and the Nasdaq
Composite +20.00 points to about 2734.00. Oil is getting closer to that $100
level once again up about +$.55 around the $99.00 level.
Factory activity rebounded in the Philadelphia region in July slightly
but for traders it was good enough. The Philly Fed’s business activity
index rose to +3.2% in July from a negative -7.7% in June. This almost completely
retraces the steep drop in June. The index was +3.9% in May but as high as +43.4%
in March, which was a 27-year peak.
The decline in June raised fears that the manufacturing sector was
on the verge of contracting after leading the economic recovery over the past
two years. The increase in the Philly Fed index was larger than expected as
economists forecast the index would remain a negative -2.7%. The new orders
index rose to +0.1% from negative -7.6% in June. The shipments index rose slightly
to +4.3% in July from +4.0% in the previous month. The employment index increased
to +8.9% in July from +4.1% in June. The average workweek fell sharply to negative
-5.4% in July from +1.9 in June. Price pressures continued to ease. The prices
paid index fell to +25.1% in July from +26.8% in June after dropping by 22%
points in June. The prices received index fell to +1.1% in July from +4.4% in
June.
Jobless Claims rose last week by +10,000 to a seasonally adjusted 418,000.
Economists has expected new requests for jobless benefits to fall to 403,000.
Claims in the prior week were revised up to 408,000 from an original reading
of 405,000. The four week average fell -2,750 to 421,250 while continuing claims
decreased by -50,000 to 3.7 million. A total of 7.33 million people received
some kind of state or federal benefits.
Economic activity should slowly expand in coming months, the Conference
Board said as it reported that its index of leading economic indicators grew
+0.3% in June, matching estimates from economists. "The strengths among
the leading indicators have been balanced with the weaknesses in recent months,"
a Conference Board economist said in a statement. Among the 10 indicators that
make up the LEI, five made positive contributions in June, led by the real money
supply. The largest negative contribution came from stock prices. In May, the
LEI rose +0.8%. The LEI is a weighted gauge of 10 indicators that are designed
to signal business cycle peaks and troughs.
House prices rose a seasonally adjusted +0.4% in May, marking the second
straight increase, the Federal Housing Finance Agency said. Prices for April
were revised down to a +0.2% increase from an original reading of a +0.8% gain.
In the past 12 months, prices have fallen -6.3%, and are they down 19.6% from
an April 2007 peak. In May, prices rose the most in the Mountain region, up
+2.0%. The steepest decline occurred in the West South Central part of the U.S.
- Arkansas, Texas, Louisiana and Oklahoma - where prices fell -1.0%. FHFA data
is based on sales information compiled by the large mortgage firms Fannie Mae
and Freddie Mac.
Yesterday it was reported that Sales of existing homes slipped in June to a
seven-month low, with a trade group attributing the weak economy and a spike
in cancellations for the surprise downturn. The National Association of Realtors
reported sales of single-family existing homes fell -0.8% to a seasonally adjusted
annual rate of 4.77 million from 4.81 million in May. Economists had anticipated
a 4.9 million rate of sales. The data caught economists by surprise in part
because pending homes sales had gained +8.2% in May. Lawrence Yun, the chief
economist of the NAR, said "a very weak economy led to weak sales,"
and cancellations jumped to 16% from just 4% in May. The NAR also downgraded
its 2011 sales projection to 5 million from a range of 5.1 million to 5.2 million.
The median existing home price was $184,300, an increase of 0.8% from June 2010.
Tuesday, July 19, 2011 2:20 p.m. est.
According to Reuters: "Global consumer confidence fell in the
second quarter to its lowest level in a year and a half as an uncertain economic
outlook, a deepening euro zone debt crisis and rising inflation made people
more cautious, a survey showed on Sunday." The report added: "Confidence
dipped in China, due to rising inflation, as well as in the Middle East where
an initial bounce in consumer morale after social uprisings in the first quarter
gave way to caution as the political outlook became unclear and rising prices
curbed spending power. Egypt and Saudi Arabia posted the biggest falls from
the first quarter in Nielsen's ranking of confidence in 56 countries worldwide.
Confidence was lowest in euro zone countries engulfed by a deepening debt crisis
with Greece coming bottom of the global ranking . Portugal, Ireland, Spain and
Italy were also in the bottom 10 although while confidence fell from the first
quarter in Spain and Italy it rose slightly in Portugal and Ireland."
The market popped higher today as worries about Europe’s banks not really
passing their stress tests and the debt level/budget talks seemed to suddenly
be going well!! The Dow saw highs of +210.00 points, S&P 500 +21.00 points
and the Nasdaq Composite +60.00 points just after President Obama came out and
said that it looks like the two sides are very close to a deal! Yeah,,, President
Obama saves the day again or should I say the Republicans waffled once again!
Nonetheless, it appears the game of politics continues on and it won’t
likely change until there is a real crisis. Of course this is summer and everyone
is gone until late August so no one wants to react now but with fall coming
it seems like a perfect time for S&P or Moody’s to come out and lower
America’s debt rating! If that occurs you could see a quick drop for sure
at least for a day before Obama’s political engines put the fire out with
more promises! Greece’s default, excuse me, near default, has taken about
3 years and running, so don’t expect America’s to be much different!
Yes we could see a swift correction but it will likely be only for a short time
before it bounces back and then the real volatility will kick in.
New construction of Homes jumped in June to their highest level in
five months, the Commerce Department said. Starts rose +14.6% in June to a seasonally
adjusted 629,000 annualized units, stronger than the 580,000 pace expected by
economists. This is the highest level of starts since January. Starts of new
single-family homes rose by +9.4% to 453,000 in June, while starts of large
apartment units surged +31.8%% to 170,000. Building permits, a leading indicator
of housing construction, rose +2.5% to a seasonally adjusted annual rate of
624,000. This is the highest level of permits since December.
Monday, July 18, 2011 4:03 p.m. est.
The market started the day on the downside as worries about Europe’s
banks not really passing their stress tests and the debt level/budget talks
seemed to be going nowhere. There was also the fact that Moody’s came
out and lowered their GDP numbers for the last quarter. The Dow saw lows of
-190.00 points, S&P 500 -19.00 points and the Nasdaq Composite -50.00 points.
Of course the market turned around midday as there is no volume right now cutting
losses in half by the close. This is looking like it will be another quiet sideways
trading week as everyone is now expecting nothing from Obama and the Republicans
until 1159:59 August 1st so they can claim they saved the day!
At the close the Dow was down -95.00 points to 12385.00, S&P 500
-11.00 points to about 1305.00, S&P 100 -4.00 points to 584.00 and the Nasdaq
Composite -24.00 points to about 2766.00. Oil was lower as it appeared that
a slowdown may be on the day off about -$1.30 around the $96.00 level.
Builder confidence in the market for newly built, single-family homes
rose two points to 15% in July on the National Association of Home Builders/Wells
Fargo Housing Market Index. The gain offsets much of June's three-point fall,
but its still the ninth time out of 10 the index has held to the same three-point
range. "We view the upward movement in the July HMI as a correction from
an exceptionally weak number in June that was at least partly attributable to
negative economic news and the close of a disappointing spring selling season,"
said NAHB Chief Economist David Crowe in a statement. The seasonally adjusted
index is designed so that any number over 50 is considered "good"
which hasn't been the case since April 2006.
Friday, July 15, 2011 4:03 p.m. est.
Today was expiration and it was nice to see another fully profitable
expiration cycle! It was interesting this morning that the market ignored the
S&P warning on U.S. debt completely although not surprising as politicians
will likely continue to play their games until the final hours so they can claim
to have saved the day! Instead they focused on good earnings from Google and
Citigroup's results and started the day higher. Economic data wasn’t that
bad also so the Dow saw quick highs of +65.00 points, S&P 500 +9.00 points
and the Nasdaq +30.00 points. Of course worries about the budget/debt crisis
and now S&P threatening to lower the rating on American bonds even if they
get the budget in order and get the debt level set higher started traders thinking
and they sold the market off with the Dow seeing lows of -40.00 points, S&P
500 -2.00 points and the Nasdaq Composite -1.00 point but because it is expiration
the market came back to close near the highs of the day.
At the close the Dow was up +43.00 points to 12479.00, S&P 500
+7.00 points to about 1316.00, S&P 100 +3.00 points to 588.00 and the Nasdaq
Composite +27.00 points to about 2790.00. Oil was also higher rallying about
+$1.80 around the $97.50 level.
The cost of living for people fell last month for the first time in
a year, mainly because of a drop in gas prices. The consumer price index fell
a seasonally adjusted -0.2% in June. Energy costs sank -4.4%, the largest decline
since December 2008 as the price of gas and household electricity decreased.
Gas prices fell -6.8% and electricity declined -1.6%, the biggest drop in 14
years. The cost of food rose +0.2%, though it was the smallest monthly increase
in 2011. Consumer inflation has climbed an unadjusted +3.6% over the past year,
largely because of the surging cost of gas and many other commodities. The 12-month
increase in consumer inflation was as low as 1.1% as recently as November. The
so-called core rate of inflation, which excludes food and energy, climbed a
higher than expected +0.3%.
Manufacturers in the New York region said business activity had weakened
slightly in early July, according to a report released by the New York Fed.
The Empire State index remained below zero for the second straight month, rising
only to negative -3.8% in July from negative -7.8% in June. The index has fallen
dramatically the past three months after hitting a 12-month high of 21.7% in
April. Readings below zero indicate more firms said business was worsening than
said it was improving.
In July, 26% of firms said business got worse. At the same time, 23% said business
improved. The small increase in the index was well below expectations. Economists
expected the headline index to rebound to 5% in July. The new-orders index fell
to negative -5.5% from negative -3.6% in the prior month. Executives at the
manufacturing firms were more hopeful about a turnaround. The future-business
index rose almost 10 points to 32.2%. The future-employment index rose to 2.2%
in July from negative territory in the prior month. in July, the prices-paid
index fell to 43.3% from 56.1% in June. The index the difference between those
saying prices are higher and those saying lower has fallen a cumulative 27 points
in the past two months and is now at its lowest level since January. The prices-received
index also declined, to 5.6% in July from 11.2% in June.
Industrial production rose +0.2% in June, the first rise in two months
after supply chain disruptions following the earthquake in Japan, the Fed reported.
Economists had anticipated a stronger growth rate of +0.5%. The growth in June
was led by a +0.9% increase in the volatile utilities component, which largely
reflects air conditioning usage, and manufacturing output didn't budge at all.
Capacity utilization stayed at 76.7% for a second month, slightly below economist
expectations of 76.9%. For the second quarter, industrial production rose at
a slender 0.8% annual rate.
Thursday, July 14, 2011 4:03 p.m. est.
The market started the day with decent economic data so the Dow saw
quick highs of +90.00 points, S&P 500 +10.00 points and the Nasdaq +25.00
points but as worries about the budget/debt crisis and Moody’s threatening
to lower the rating on American bonds if it isn’t resolved started to
hit home so selling took hold with the Dow seeing lows of -80.00 points, S&P
500 -11.00 points and the Nasdaq Composite -45.00 points going into the final
hour.
At the close the Dow was down -55.00 points to 12437.00, S&P 500
+9.00 points to about 1309.00, S&P 100 -3.00 points to 585.00 and the Nasdaq
Composite -34.00 points to about 2763.00. Oil sold off pretty good about -$2.30
around the $95.75 level.
Jobless Claims fell -22,000 to a seasonally adjusted 405,000 last week
and is the smallest amount of new applications since mid-April. The drop in
claims helped the market to start the day higher originally. Economists expected
new requests for jobless benefits to total 420,000. Claims in the prior week
were revised up to 427,000 from an original reading of 418,000. The four week
average meanwhile, dropped a lesser -3,750 to 423,250. The four-week average
is seen as a more accurate a barometer of labor trends because it smoothes out
week-to-week volatility in the data. The decline in last week’s claims
would have been even steeper if not for a government shutdown in Minnesota triggered
by a budget standoff. Minnesota said 11,500 state workers filed applications
for jobless benefits last week. Continuing Claims increased by +15,000, to 3.73
million and 3.83 million people received extended benefits.
The Producer-Price index fell a seasonally adjusted -0.4% last month,
marking the first decrease in one year and matched the forecast of economists.
Yet the core rate of wholesale inflation, which strips out the volatile food
and energy categories, rose a higher-than-expected +0.3%. About half the increase
stemmed from higher prices for light trucks. The core index is usually viewed
by investors and the Fed as a better gauge of inflationary pressure. Energy
costs sank -2.8% last month, mostly because of falling gasoline prices. The
wholesale cost of residential electric power also fell a record -2%. Still,
wholesale energy costs are up an unadjusted +20% over the past year. Until oil
prices eased in May, the surging cost of petroleum had fueled a sharp increase
in wholesale rates through last fall and this spring filtering into higher prices
for a variety of other products. As a result, wholesale prices have risen an
unadjusted +7% in the past 12 months. The core rate is up a much smaller +2.4%,
however. Wholesale food costs, meanwhile, rose +0.6% last month. The price of
fresh fruit and melons jumped almost +12% and accounted for more than half of
the increase in the food category. Over the past year wholesale food costs have
climbed +7.4%.
Retailers increased a slight +0.1% in June, better than economists
expected but also further evidence of the reluctance of consumers to spend.
The slight increase in June sales was unexpected. Economists expected sales
to fall -0.2%. Retail sales excluding autos, gas stations and the building-materials
segment, or what some economists call control-group sales rose +0.1% in June
and is the smallest gain in this category since last July. Excluding a +0.8%
rise in motor-vehicles sales, retail sales for the month were flat in June,
in line with expectations. Sales at gas stations fell -1.3% as pump prices decreased.
Excluding gasoline, sales rose +0.3%. Excluding autos and gasoline, sales rose
+0.2% in June. Retail sales account for about half of total consumer spending
and about a third of final sales in the economy. Economists don’t think
that inflation-adjusted consumer spending for the first quarter will match the
slow +2.2% rate in the first three months of the year.
Wednesday, July 13, 2011 4:03 p.m. est.
Here’s an interesting note: Did you know that last year Apple
accounted for 20% of all retail sales in the U.S! You would think that the stock
would be through the moon and if we didn’t have them what would the world
look like!!!
Well I never thought I would say it but the U.S can now call itself
Janarica! After hearing Ben Bernanke’s statement today about the strong
possibility of Q3 it is evident that we are following the same path that Japan
did a couple of decades ago! Since their housing bubble burst in 1988, they
have been stimulating and stimulating their economy but it continues to get
worse or remain flat. Just in the past year have their housing prices started
to increase again! Of course their market rallied after every cash input but
eventually it would move lower once again. Currently the Nikkei just moved below
the 10,000 level the other day from a high of 39,000 in 1990 so obviously it
doesn’t work!! Ron Paul actually said it best during the question/answer
time after Bernenkes speech when he pointed out blatantly that the last $5 Trillion
of stimulus or QE 1&2 hasn’t done anything for the economy and has
only helped the banks and supported the stock market!
Before his speech the market was already going to head higher but it
rallied more after it was announced that he would be providing more stimulus
with the Dow seeing +170.00 points, S&P 500 +18.00 points and the Nasdaq
+45.00 points. Rationality seemed to come into play though or likely more expiration
related adjustments so the market lost most of its gains by the close of the
day.
At the close the Dow was up +45.00 points to 12492.00, S&P 500
+4.00 points to about 1318.00, S&P 100 +2.00 points to 587.00 and the Nasdaq
Composite +13.00 points to about 2795.00. Oil rallied hard afterwards also but
ran out of steam only closing up about +$.50 around the $98.00 level.
While the Fed believes that the temporary shocks holding down economic
activity will pass, the central bank is examining several untested means to
stimulate growth if conditions deteriorate, including another round of asset
purchases, dubbed QE3, Fed chairman Ben Bernanke said in remarks prepared for
the House Financial Services Committee. Bernanke discussed three approaches
to further easing in his prepared remarks. One option, Bernanke said, would
be for the Fed to provide more "explicit guidance" to the pledge that
rates will stay low for "an extended period." Another approach would
be another round of asset purchases, or quantitative easing, or for the Fed
to "increase the average maturity of our holdings." Finally, the Fed
could also reduce the quarter percentage point rate of interest that it pays
to banks on their reserves, "thereby putting downward pressure on short-term
rates more generally." Bernanke was clear to stress that easing was not
the only option under consideration and that the next Fed move could well be
to tighten. At the moment, Fed officials see a recovery that "will likely
remain moderate," Bernanke said, with the unemployment rate falling "only
gradually." Inflation is expected to subside in coming months, he said.
Tuesday, July 12, 2011 4:03 p.m. est.
Overnight Globex futures were looking pretty poor as they were selling
off once again as worries about Greece, Italy, America and now Spain remain
in everyone's thoughts. By the open worries were kicked down the road so to
speak so the Dow only saw lows of -5.00 points, S&P 500 -2.00 points and
the Nasdaq Composite -5.00 points. From there the market became mixed and after
the Fed minutes were released revealing a slight hint that there may be more
stimulus highs were hit with the Dow seeing +70.00 points, S&P 500 +7.00
points and the Nasdaq +5.00 points. When Moody’s came out and downgraded
Ireland to junk status selling began once again with the market finishing the
day at new lows.
At the close the Dow was down -60.00 points to 12447.00, S&P 500
-6.00 points to about 1314.00, S&P 100 -3.00 points to 585.00 and the Nasdaq
Composite -21.00 points to about 2782.00. Oil rallied for no real reason up
+$2.25 around the $97.00 level.
The Trade Deficit jumped +15.1% in May to the highest level in almost
three years, largely because of the increased cost of oil imports. The trade
gap widened to a seasonally adjusted $50.2 billion from $43.6 billion in April
and the biggest monthly deficit since October 2008. Economists had forecasted
the trade deficit to rise to $44.5 billion. Imports increased +2.6% to $225.1
billion, while exports fell less than -1% to $174.9 billion. The bulk of the
increase in imports was tied to the higher cost of oil, whose price hit a recent
peak in May. Imports of crude oil and related petroleum products jumped to a
seasonally adjusted $34.9 billion in May from $30.6 billion in April. The trade
deficit in petroleum alone totaled $30.4 billion, the highest level since October
2008. Imports from China, meanwhile, climbed to $32.8 billion in May from $29.6
billion in April. As a result, the trade deficit with the rising Asian giant
increased $3.4 billion to $25 billion in May. Country data is not seasonally
adjusted. The U.S. also showed deficits of $11.3 billion with OPEC nations,
$8.8 billion with the European Union, $6.3 billion with Mexico, $2.7 billion
each with Canada and Saudi Arabia and $2.6 billion with Japan. Canada, Mexico
and Saudi Arabia are the three largest exporters of petroleum to the U.S.
Monday, July 11, 2011 4:03 p.m. est.
According to The Wall Street Journal: "Moody's warned of "red
flags" at 61 rated Chinese companies as it sought to provide transparency
on its approach to ratings amid rising investor concern about corporate governance
at such entities."
Government checks are about to run out. According to Reuters: "Close
to $2 of every $10 that went into Americans’ wallets last year were payments
like jobless benefits, food stamps, Social Security and disability, according
to an analysis by Moody’s Analytics." And what lies ahead could be
a major and very significant crisis as "By the end of this year, however,
many of those dollars are going to disappear, with the expiration of extended
benefits intended to help people cope with the lingering effects of the recession.
Moody’s Analytics estimates $37 billion will be drained from the nation’s
pocketbooks this year." This was one of the reasons the market started
the week solidly on the downside and then there was talk about traders worried
about the debt problem in America and that Italy is now starting to see signs
of default. Portugal saw their bonds hit 12% overnight and the EU is now saying
that Greece will have to “default on some of its bonds” so the the
Dow saw lows of -190.00 points, S&P 500 -27.00 points and the Nasdaq Composite
-70.00 points going into the final hour. The market came back a little before
the end of the day but still remained down pretty good.
At the close the Dow was down -150.00 points to 12506.00, S&P 500
-24.00 points to about 1319.00, S&P 100 -11.00 points to 587.00 and the
Nasdaq Composite -62.00 points to about 2800.00. Oil sold off closing down -$1.50
around the $95.00 level. As I mentioned on Friday we could see some selling
this expiration traded week and viola there it is. The market has been buying
time on all of this financial mess and its starting to build again so we could
see more volatility if earnings that start after the bell don’t support
the market!
Friday, July 8, 2011 4:03 p.m. est.
Sorry about that, I was out east this past week as my kids were at
a Leahy (Natalie Mcmaster) fiddle camp and so I was sending out the commentary
in-between flights but it never made its way out the door.
The market sold off today as the employment report out this morning
was absolutely abysmal! Not only does Canada have a stronger dollar now but
they are also creating amore jobs with +28,000 last month compared to only +18,000
here. What’s even more astronomical about that is Canada only has 10%
of the population of America! The Dow saw lows of -150.00 points, S&P 500
-18.00 points and the Nasdaq Composite -45.00 points in the morning but buying
in the final hour cut those losses.
At the close the Dow was down -62.00 points to 12657.00, S&P 500
-9.50 points to about 1344.00, S&P 100 -4.-0 points to 598.00 and the Nasdaq
Composite -13.00 points to about 2859.00. Oil sold off all day as it indicates
less spending closing down -$2.00 around the $96.50 level. The market was correcting
two weeks ago as it appeared that the economy was slowing and when we had some
“okay” data come out it rallied almost back to where it was so with
this incredibly poor data, the question is are we headed back down again. That
very well could be as this is an expiration traded week coming up and we have
moved pretty fast to the upside creating an overbought condition. This is also
the start of earnings season on Monday with Alcoa after the bell coming out.
Earnings are expected to be pretty good overall however so we could see support
there but if they’re bad and they’re outlooks are average it could
be a hard week down. One thing for sure is that volatility will likely be strong!
The economy added jobs at a slower pace in June than in May, suggesting
that the sudden slowdown in the economy might be longer-lasting and more severe
than feared. Employment rose by only +18,000 in June, well below the +125,000
gain expected by economists. Even worse was that job gains in May were revised
down to only +25,000 in May from the initial estimate of +54,000. Employment
rose by an average of +215,000 per month from February through April but now
has only averaged +22,000 over the past two months. The unemployment rate also
moved higher to 9.2% in June from 9.1% in the previous month and is the highest
level since December. Economists had expected the unemployment rate to remain
steady. Average hourly earnings were flat in June and up only +1.9% over the
past year. This is really dismal news as it means that the labor market remains
far away from healthy and steadily getting worse! A healthy pace of job creation
is loosely defined as somewhere over 250,000 jobs per month for several months
and with all of this stimulus you would think it would be growing faster! It’s
easy to say that it was because of the slowdown in Japan after its earthquake
however President Obama said it best when he acknowledged that the employment
data confirm policy makers have a “big hole” to fill on stimulating
job growth. The question is what is he going to fill it with???
Thursday, July 7, 2011 10:30 p.m. est.
This morning the market has popped higher on average economic gains
and even though the EU raised interest rates a quarter point this morning. Out
of the gate the Dow is seeing highs of +80.00 points, S&P 500 +12.00 points
and the Nasdaq Composite +30.00 points. Oil was up almost +$2.00 to be around
the $98.00 level. It will be interesting to see if this gain lasts throughout
the day as we have the big employment report out tomorrow and the market is
still very overbought.
Companies in the private sector added +157,000 jobs in June, according
to the Automatic Data Processing Inc's employment report. The gain follows a
revised gain of just +36,000 in May, down from the initial estimate of a +38,000
gain. The June reading was well above analysts' expectations of a gain near
+70,000. According to ADP, the goods-producing sector added +27,000 jobs in
June, including +24,000 in manufacturing. The service sector added +130,000
jobs.
Meanwhile Jobless Claims fell by -14,000 to a seasonally adjusted 418,000
while claims for the prior week were revised up to 432,000 from an original
reading of 428,000. Economists expected new requests for jobless benefits to
drop to 424,000. The average of new claims over the past four weeks fell by
-3,000 to 424,750. The four-week average is seen as a more accurate a barometer
of labor trends because it smoothes out week-to-week volatility in the data.
Continuing claims fell by -43,000 to 3.68 million.
Wednesday, July 6, 2011 12:00 p.m. est.
So far its been another quiet day so far with the Dow seeing lows of
-30.00 points, S&P 500 -7.00 points and the Nasdaq Composite -10.00 points
from a poor services report. Interestingly it seemed that traders decided to
ignore the fact that China raised rates again and it looks like Portugal is
now on the list for a default once again because it came back though going into
lunch hour with the Dow seeing highs of +45.00 points, S&P 500 +2.00 points
and the Nasdaq Composite going for its seventh up day in a row of +10.00 points.
Oil was basically flat for the day around the $97.00 level.
According to Reuters: "China raised interest rates for the third
time this year on Wednesday, making clear that taming inflation remains a top
priority even as its vast economy gently eases." The report added: "The
25-basis-point increase in lending and deposit rates underscores China's quiet
confidence that the world's second-biggest economy is resilient enough to take
tighter monetary policy in its stride, and is not threatened by a hard landing
that some investors fear." The real question, though, is whether the rising
problem of municipal debt in China will be affected by the steady climb in rates,
and what the repercussions may be in the next few months.
Its interesting how the market is just throwing this aside and is another example
of what low volume will do for you because the reason the market has been down
of late is due to Greek debt so you would think that another negative and Dollar
positive item is that private bond holders of Greek debt have decided to leave
in droves! Although they said they would participate in bond rollovers, they
are quietly dumping out of all their Greek paper, leaving the EU holding a much
bigger bag than they had anticipated. Looks like its time to start warming up
the third saving run, or should we say third out!!!
The number of planned job cuts announced by employers rose by +4,297,
or 11.6%, to 41,432 in June, according to the latest report from consultancy
Challenger, Gray & Christmas. Though up for the second month, the pace of
downsizing in the first half is at the lowest level since 2000. The Challenger
data tracks with the separate job openings and labor turnover survey from the
Labor Department, which says the number of layoffs and discharges as a percent
of total employment in April was at a five-year low.
The Institute for Supply Management's services-sector index for June
fell to 53.3% from 54.6% in May, the private group reported. Economists expected
the ISM services index to fall to 54% last month. Any reading over 50% indicates
that more firms are expanding than contracting.
Tuesday, July 5, 2011 4:03 p.m. est.
Not surprisingly the market started the shortened trading week lower
with the Dow seeing lows of -40.00 points, S&P 500 -5.00 points and the
Nasdaq Composite -10.00 points. Of course because of the strength we’ve
been seeing of late by midday the market actually turned slightly positive for
a bit. The final hour saw profit taking though so at the close the Dow was down
-13.00 points to 12,570.00, S&P 500 -2.00 points to about 1338.00, S&P
100 -.65 points to 595.00 and the Nasdaq Composite +10.00 points to about 2826.00.
Oil was higher again closing up about +$1.90 to close around the $97.00 level.
The market was up every day last week just +5% and the Nasdaq Composite
up +8% over the last ten days Of course the likelihood of continued gains falls
with each day that the market continues to go up. Its the law of averages and
trader exhaustion taking their effect. That means that sometime this week, the
odds of a pullback will likely occur and now reaching the point where traders
have to decide if this is a bull market rebound or just the end of a nice end
of the month move which is very cyclical every month or end of the quarter,
pre-fourth of July seasonal run. What could move the market this week though
is the employment report is out on Friday or even the Challenger job cut data,
the ADP employment report, Jobless claims data, and the ISM non manufacturing
report are all market moving.
One of the most reliable trading patterns in the market is based on
the tendency of money managers to buy stocks at the turn of the month, the period
that is the last trading day of the month and the first five calendar days of
a new month. That's because new money comes into their hands and they have to
put it to work. This pattern is a bit more reliable at the end of a quarter
when managers are pressured to show good results on their quarterly statements
and I’ll bet that's what happened in the last five days.
Some holidays, if they fall during a certain time can increase the
likelihood of the market moving up also. Two of the more reliable ones are Memorial
Day and the Fourth of July. This year, the period near Memorial Day gave us
a +2% gain on the S&P 500 and the last five days, have been excellent with
a move of +4% over five days. All in all this could easily be a down week with
the strength of this past move and the fact that the market is so overbought!
This should make for some interesting trading with the economic data coming
out!
Friday, July 1, 2011 3:52 p.m. est.
The market popped higher once again this morning because there was
basically no volume and no one trading as it is the last day of trading before
the long weekend and Canadians are already celebrating Canada Day! The Dow crawled
to highs of +170.00 points, S&P 500 +18.00 points and the Nasdaq Composite
+45.00 points going into the final hour. I’m sure we’ll hold gains
going into the close. Oil was actually down on the day closing with a loss of
-$.65 to close around the $95.00 level. It will be interesting to see if these
gains can hold next week when everyone gets back from vacation. I hope everyone
has a wonderful Canada Day and Independence Day celebration, a good day to be
thankful for incredible countries!!
Conditions for the nation's manufacturers picked up unexpectedly in
June, easing fears of a double-dip. The Institute for Supply Management's factory
index rose to 55.3% in June from 53.5% in May. The increase was a surprise as
estimates were for the index to fall to 52.3%. The ISM index had plunged to
53.5% in May from 60.4% in April. Below the headline, the report was also firm.
The key employment index improved to 59.9% in June from 58.2% in May. New orders
jumped to 51.6% in June from 51.0% in the prior month. The price index fell
to 68.0 from 76.5 in the prior month.
A gauge of consumer sentiment declined to 71.5% at the end of June
from 74.3% in May, according to the Thomson Reuters/University of Michigan survey.
Economists had expected a final reading of 72%. The sentiment reading, which
covers how consumers view their personal finances, as well as business and buying
conditions, averaged about 87% in the year before the start of the most recent
recession.
Construction spending fell -0.6% in May to a seasonally adjusted $753.5
billion, worse than the -0.1% fall that economists had anticipated, as residential
construction dropped -2.1%. That represents a -7.1% downturn from May 2010.
April's data was downwardly revised to show a -0.6% drop.
Thursday, June 30, 2011 4:03 p.m. est.
Yesterday the market continued to rally with the Dow closing with gains
of +73.00 points, S&P 500 +11.00 points and the Nasdaq Composite +11.00
points and it continued today with the Dow seeing highs of +170.00 points, S&P
500 +15.00 points and the Nasdaq Composite +40.00 points going into the final
hour before pulling back a bit just before the close. For the week so far the
market is up about +4%! This is quite remarkable but not surprising with volume
this low and it being so oversold. Today was the last day of trading for June
also and even though the rally has been strong the market is still down about
-1.5% for the month. With the market going into a long weekend it will be interesting
to see if those gains can be held as short term the market is quite overbought
now.
At the close the Dow was up +145.00 points to 12188.00, S&P 500
+17.00 points to about 1297.00, S&P 100 +6.90 points to 576.00 and the Nasdaq
Composite +41.00 points to about 2729.00. Oil has been rallying closing up around
the $95.00 level.
One of the reasons the market popped this morning was that it was
reported that the Chicago PMI unexpectedly increased in June, climbing to a
61.1% reading compared to a 56.6% reading in May. Economists had expected it
to fall to a 55% reading, as the indicator recedes from the strong 70.6% level
in March. ISM-Chicago said the June report "lacks decisive direction"
because three of the subindexes rose while four fell. Any reading over 50% indicates
expansion. The Chicago PMI is closely followed because the national Institute
for Supply Management manufacturing index is released on Friday.
Jobless Claims fell -1000 to 428,000 from the prior week. Economists
had expected initial claims to fall to a seasonally adjusted 425,000. Initial
claims from two weeks ago were unrevised at 429,000. The average of new claims
over the past four weeks, meanwhile, was essentially unchanged at 426,750. The
monthly average is considered a more accurate measure of employment trends.
Continuing Claims fell by -12,000 to a seasonally adjusted 3.7 million. A total
of 7.51 million people received some kind of state or federal benefits.
Yesterday it was reported that Pending Home Sales rose +8.2% in May,
partly bouncing back from a dismal April, the National Association of Realtors
said. The +13.4% gain from May 2010 levels marks the first time in 13 months
that contract activity was above year-ago levels. "Absorption of inventory
is the key to price improvement, and this solid gain in contract signings implies
that home values in many localities are or will soon be stabilizing as inventories
get absorbed at a faster pace," said NAR Chief Economist Lawrence Yun.
He said some markets including Hartford, Conn., Indianapolis, Minneapolis, Houston
and Seattle have seen a rapid turnaround, with signings up by as much as 30%
from year-earlier levels. The April decline was revised to an -11.3% fall from
the initial -11.6% decline. A sale is listed as pending when the contract has
been signed but the transaction has not closed, which normally occur with a
lag time of one or two months.
Tuesday, June 28, 2011 4:03 p.m. est.
The market continued to rally today but as I said yesterday it was
on anemic volume and was a very slow climb after the initial higher open. The
Dow saw highs just before the close of +150.00 points, S&P 500 +17.00 points
and the Nasdaq Composite +45.00 points.
At the close the Dow was up +145.00 points to 12188.00, S&P 500
+17.00 points to about 1297.00, S&P 100 +6.90 points to 576.00 and the Nasdaq
Composite +41.00 points to about 2729.00. Oil rallied as the U.S dollar rallied
because of the fake austerity plans for Greece so oil rallied pretty hard up
about +$2.50 to close around the $93.00 level.
Consumer confidence fell in June reaching the lowest level since November
on concerns about employment and income, the Conference Board reported. The
nonprofit organization said its consumer-confidence index fell to 58.5% from
an upwardly revised 61.7% in May. Economists had expected a June reading of
60.5%. Generally when the economy is growing at a good clip, confidence readings
are at 90% and above. The future-expectations barometer fell to 72.4% from 76.7%
in May, and the present-situation gauge fell to 37.6% from 39.3%. "Consumers
rated both current business and labor market conditions less favorably than
in May, and fewer consumers than last month foresee conditions improving over
the next six months," said Lynn Franco, director of the Conference Board's
consumer research center, in a statement.
Single-family home prices fell modestly in April, pointing to signs
of stabilization in the hurting housing market at the start of the spring buying
season, a closely watched. The S&P/Case-Shiller composite index of 20 metropolitan
areas fell to 0.1% on a seasonally adjusted basis. Economists had forecast a
decline of -0.2%. On a non-seasonally adjusted basis, however, the index rose
+0.7%, its first advance in eight months, the report said. "The seasonally
adjusted numbers show that much of the improvement reflects the beginning of
the spring-summer home buying season," David Blitzer, chairman of the index
committee at Standard & Poor's, said in a statement. "It is much too
early to tell if this is a turning point or simply due to some warmer weather."
The excess amount of houses for sale, ongoing foreclosures, tight credit and
weak demand have kept the housing market on the slide even as other areas of
the economy start to recover. Prices in the 20-city index fell -4% year over
year, slightly worse than expectations for a drop of -3.9%.
Monday, June 27, 2011 4:03 p.m. est.
It was interesting how the market was off so much on Friday with the
Dow closing near its lows of -115.00 points, S&P 500 -15.00 points and the
Nasdaq -34.00 points. Today it reversed those lows and rallied pretty good with
the Dow seeing highs of +165.00 points, S&P 500 +17.00 points and the Nasdaq
Composite +45.00 points. Volume was abysmal but it is summer. At the close the
Dow was up +109.00 points to 12043.00, S&P 500 +12.00 points to about 1280.00,
S&P 100 +6.50 points to 570.00 and the Nasdaq Composite +35.00 points to
about 2688.00. Oil was lower once again today closing down about -$.50 to close
around the $90.50 level.
This week will likely be similar to last weeks for volatility but going nowhere
fast in the end, especially because we are headed into the July 4th holiday
on Monday. Even though volume was pathetic today it will likely get even worse
and so the movement of the market may get slower and slower until its crawling
by Friday.
Considering that the market has rallied about 100% since its lows in
09, an -8% correction is quite something considering that economic data has
been very poor the past two months, along with the ongoing euro-zone debt issues
and with sentiment getting incredibly bearish its looking pretty resilient!
Today it was reported that Consumer spending was flat in May, the
weakest reading since June 2010. Personal income rose +0.3% and economists had
expected this number but a +0.1% gain in spending. The savings rate rose to
+5% from +4.9% in April. Excluding inflation, disposable incomes rose +0.1 after
falling -0.1% in April. Spending adjusted-for-inflation fell -0.1% for the second
straight month. The personal consumption expenditure price index rose +0.2%
in May and is up +2.5% in the past year. The core rate rose +0.3%, up from the
+0.2% gain forecast and the biggest gain since October 2009. Over the past year,
core inflation is running at a +1.2% rate, still below the Fed's implicit target
near +2%.
On Friday it was reported that economic growth was revised modestly
higher in the first quarter to account for a slightly faster pace of restocking
and a smaller increase in imports, but this still remains anemic. Gross domestic
product growth rose at annual rate of +1.9%, up from the previously estimated
+1.8%. The revision was in line with economists' expectations. The economy expanded
at a +3.1% rate in the fourth quarter. Growth has remained slow so far in the
second quarter, but economists are cautiously hopeful that activity will pick-up
in the third quarter. First-quarter growth was supported by stronger than previously
estimated accumulation of business inventories, slower imports and a smaller
decline in residential construction, while the increase in business spending
was revised lower. Business inventories increased $55.7 billion, above last
month's $52.2 billion estimate. The change in inventories added +1.31% percentage
points to GDP growth. Consumer spending which accounts for more than two-thirds
of U.S. economic activity grew at an unrevised +2.2% rate. Imports were revised
down to a +5.1% growth pace from +7.5%. It also showed inflation pressures a
little bit stronger, with the personal consumption expenditures price index
revised to up 3.9% from 3.8%. That compared to the fourth quarter's +1.7% increase.
Stronger orders for airplanes translated into a better-than-expected
+1.9% increase in durable-goods orders. Durable-goods orders have bounced up
and down for the past year and May was no exception, recovering from a steep
April decline. Orders have been alternating between gains and losses since last
June. The direction has been on an upward trend though as orders are up +9.7%
in the past year. Orders fell a revised -2.7% in April, the biggest decline
since October but lower than the prior estimate of a -3.6% drop.
Thursday, June 23, 2011 4:03 p.m est.
Here’s a couple things that you won’t hear about on your
local tv stations! It shouldn't come as much of a shock, but Saudi Arabia seems
to be picking up on its anti-Iran rhetoric, a fact that could cause problems
for the oil market except today of course! The strategic divisions in the Middle
East, and a real possibility of a fight between Sunni and Shiite Muslims could
create some problems though. According to The Wall Street Journal, in closed
door remarks, Saudi Prince Turki al-Faisal, told an audience that Saudi Arabia
could opt to "replace" Iran's oil exports, presumably within the framework
of OPEC, while "preparing to employ all of its economic, diplomatic and
security assets to confront Tehran's regional ambitions." This is in response
to Iran's increased activity in places such as Gaza, Syria, and according to
multiple sources in other areas of the Middle East where revolutions and governments
have been overthrown.
The Journal says that the rivalry between Saudi Arabia and Iran is
heating up, and describes the situation as a "Cold War, fueled by oil and
ideology, between Shiite Islamists who rule Iran and the Sunni Saudi royal family,
each of whom consider themselves leaders of the world's Muslim populations."
"U.S. and Arab diplomats said Saudi Arabia's monarchy often uses Prince
Turki to float ideas concerning the country's future policies," adding
that "Saudi Arabia has pursued an increasingly aggressive foreign policy
over the past year—sometimes at odds with the U.S. and driven by concerns
about Iran and the recent political turmoil in North Africa and the Middle East."
The dispute may also include Iraq. According to the Journal: "Saudi Arabia
has withheld sending an ambassador to Baghdad due to charges that Prime Minister
Nour al-Maliki's Shiite-majority government is too close to Iran. Indeed, Iraq
sided with Iran in the recent dispute over OPEC energy prices. And Prince Turki
alleged that Iranian military officers were directly involved in formulating
Iraqi security policy, a charge Baghdad has regularly denied."
Pimco predicts Greece, European defaults. According to Reuters: "The
head of PIMCO, the world's biggest bond fund, predicted that Greece and other
European economies would default on their debts to resolve their problems as
the euro area faces a debt crisis." Mohammed El-Erian added that he thought
it would take three years for global economic issues to work out and that for
Europe, the problems would be worked out "through default." El-Erian
added that it was "unlikely but not impossible" that a Greek default
would trigger another global financial crisis.This is turning out to be an exciting
week because after I reported on Monday the market rallied pretty hard on Tuesday
a little over +1% giving us fills on the upside and then yesterday and today
it is falling bringing the market back to about where it started the week. The
Dow saw lows today of -230.00 points, S&P 500 -23.00 and the Nasdaq -40.00
points. It came back and at one point the Nasdaq turned positive with a +20.00
point gain after it was announced that Greece likely has a deal with the IMF
and EU for Austerity measures in the next 5-years! Haven’t we heard this
tune before!!
At the close the Dow was down -60.00 points to 12050.00, S&P 500
-4.00 points to about 1284.00, S&P 100 -5.00 points to 568.00 and the Nasdaq
Composite +18.00 points to about 2687.00. Oil was clocked today moving below
the $90 level at one point after it was reported that the International Energy
Agency, IEA, would put out 60 million barrels of oil on the market. It closed
down about -$4.00 to close around the $91.00 level.
As part of the IEA move, the U.S. will release 30 million barrels of
oil from the Strategic Petroleum Reserve, which stands at 727 million barrels.
This is the third time in the history of the IEA that its members have decided
to release stocks. “We are taking this action in response to the ongoing
loss of crude oil due to supply disruptions in Libya and other countries and
their impact on the global economic recovery,” U.S. Energy Secretary Steven
Chu said in a statement. “As we move forward, we will continue to monitor
the situation and stand ready to take additional steps if necessary.”
Interestingly the number of oversold stocks has fallen rapidly as it only took
a few good up days in a row to change things. Less than a week ago, 63% of the
stocks in the S&P 500 were oversold and was the highest level since late
June 2010. Yesterday the number of oversold stocks has been more than cut in
half to 25.4%. Last week's spike in oversold stocks was only the fourth time
in a year that the percentage exceeded 50%. The previous three periods were
late June 2010, late August 2010, and mid-March of this year and all three periods
were preludes to market bottoms. The main thing is that as expected the market
is being volatile in this low volume period and will likely continue to be like
this for the rest of the summer. We are more on the oversold side but upside
resistance is holding the market back and now with oil under pressure the upside
may get tougher so a sideways we will go,,,,,for now......
Jobless Claims rose by +9,000 to a seasonally adjusted 429,000. Initial
claims from two weeks ago were revised up to 420,000 from an originally reported
414,000. Economists had expected initial claims for last week to total 415,000.
The average of new claims over the past four weeks, meanwhile, was flat at 426,250
after taking the latest revisions into account. The monthly average is considered
a more accurate measure of employment trends. Continuing claims moved down -1,000
to a seasonally adjusted 3.7 million. Continuing claims are reported with a
one-week lag. A total of 7.54 million people received some kind of state or
federal benefit.
Sales of new homes fell -2.1% to a seasonally-adjusted annual rate
of 319,000 in May. The new-home sales pace was higher than economists estimate
of a 310,000 rate and also +13.5% above May 2010 levels, and came as April figures
were modestly revised higher to a 326,000 rate from an initially reported 324,000
rate. This is a new all time low though!!! Activity is basically half of what
it was when the U.S. entered recession in December 2007. The supply of new homes
on the market fell -3.5% to an annual rate of 166,000, the lowest on record,
which represents 6.2 months of supply at the current sales rate and that is
good news! The median price of a new home, which isn't adjusted, fell -3.4%
from year-earlier levels to $222,600, though that was +2.6% above April levels.
Monday, June 20, 2011 4:03 p.m est.
The backlog of foreclosures seems to be keeping those under water in
homes longer. According to Reuters: "In New York State, it would take lenders
62 years at their current pace, the longest time frame in the nation, to repossess
the 213,000 houses now in severe default or foreclosure, according to calculations
by LPS Applied Analytics, a prominent real estate data firm." In New Jersey,
it would take 49 years, said the report. In contrast, in states where courts
don't play as prominent a role "the pace is much more brisk — three
years in California, two years in Nevada and Colorado — but the dynamic
is the same: the foreclosure system is bogged down by the volume of cases, borrowers
are fighting to keep their houses and many lenders seem to be in no hurry to
add repossessed houses to their books." The bottom line is that this will
go on for a very long time, probably much longer than anyone expected at any
time. In fact, it's to the point, where one foreclosure lawyer told Reuters
that “Banks aren’t even trying to win.”
The market started the week on the downside which was great for downside
fills and when it turned around and rallied pretty hard with the Dow seeing
highs of +100.00 points, S&P 500 +9.00 and the Nasdaq only +20.00 points
it made them look even better. Volume was atrocious as we are now in full on
summer trading so it barely budged after making highs. At the close the Dow
was up +76.00 points to 12080.00, S&P 500 +7.00 points to about 1278.00,
S&P 100 +2.00 points to 569.00 and the Nasdaq Composite +13.00 points to
about 2629.00. Oil was selling off once again at one point touching the $91
level but it came back to close up about +$.25 to close around the $93.00 level.
With the market so oversold and volume so weak I wouldn’t be
surprised if we see a slow upward trend the entire week and maybe for the summer
for that matter. Because we’re now in summer trading mode I think I will
also take a break and either report intraday or only here and there during the
week because it is so slow. Of course if there are some surprises or something
interesting to talk about you’ll hear about it.
Friday, June 17, 2011 4:03 p.m est.
The market shot up for expiration first thing in the morning as it
usually does on these days for the S&P 500 cash expiration. The difference
today was that it was a quarterly expiration where the June S&P 500 futures
contract expires also and so it follows the cash expiration number first thing
in the morning. All other months it is at the close of the day. The Dow saw
highs of +110.00 points, S&P 500 +12.00 and the Nasdaq only +25.00 points.
After that though it pulled back as traders awaited the S&P 100 expiration
and a rebalancing of the S&P 500. The Nasdaq once again turned negative
seeing lows of -15.00 points.
At the close the Dow was up +43.00 points to 12004.00, S&P 500
+4.00 points to about 1272.00, S&P 100 +1.00 points to 567.00 and the Nasdaq
Composite -7.00 points to about 2616.00. Oil sold off once again today closing
down about -$2.00 to close around the $93.00 level.
A gauge of consumer sentiment fell in early June on a decline in readings
of both current conditions and expectations, according to the Thomson Reuters/University
of Michigan gauge fell to 71.8% in early June from 74.3% in May. Economists
had expected the June reading to decline to 73.5% on concerns about stock volatility.
The sentiment reading, which covers how consumers view their personal finances,
as well as business and buying conditions, averaged about 87% in the year before
the start of the most recent recession. The gauge of current economic conditions
declined to 79.6% in June from 81.9% in May, while the expectations barometer
fell to 66.8% from 69.5%. Meanwhile, one-year inflation expectations declined
to 4% from 4.1%, while the inflation outlook for five to 10 years rose to 3%
from 2.9%.
The economy is likely to grow in a “choppy” manner through the summer
and autumn, the Conference Board said as it reported that its index of leading
economic indicators grew a surprisingly strong +0.8% in May. The reading for
May came in ahead of expectations, following a downwardly revised -0.4% drop
in April, from the initially reported -0.3% drop. Economists had forecast a
+0.5% improvement in May.
Thursday, June 16, 2011 4:03 p.m est.
The market was volatile today starting the day mixed but then rallying
pretty strong with the Dow seeing highs of +100.00 points, S&P 500 +9.00
and the Nasdaq only +15.00 points. It didn’t last though as selling took
hold and the market made new lows for the week with the Dow seeing lows of -25.00
points, S&P 500 -7.00 points and the Nasdaq Composite a strong -35.00 points.
Once again it came back though in the final hour to close mixed. As we move
into expiration tomorrow it looks like it will be another fully profitable cycle
on both sides!!
At the close the Dow was up +64.25 points to 11,962.00, S&P 500
+2.00 points to about 1268.00, S&P 100 +2.00 points to 566.00 and the Nasdaq
Composite -8.00 points to about 2624.00. Oil was pretty flat today closing up
about +$.15 to close around the $95.00 level.
One of the reasons the market turned lower after the open was that
the the Philadelphia Fed's manufacturing index fell from +3.9% in May to -7.7%
in June, which is the worst level in 31 months and now the second Fed district
to go negative! Economists had forecast a reading of +5.5%. The survey's indicators
for activity and new orders turned negative this month, while indicators for
shipments and employment fell but remained slightly positive, the Philly Fed
said.
Housing Starts recovered partially in May from a steep drop in April
with starts rising +3.5% in May to a seasonally adjusted 560,000 annualized
units, stronger than the 550,000 pace expected by economists. Starts remain
-5.6% below March and fell a revised -8.8% in April to 541,000 units compared
with the initial estimate of a -10.6% fall to 523,000 units. The sharp drop
was blamed on severe weather. Building permits, a leading indicator of housing
construction, rose +8.7% in May to a seasonally adjusted annual rate of 612,000
and is the highest level of permits this year which is good news.
Jobless Claims fell by -16,000 last week to a seasonally adjusted 414,000,
the Labor Department said. Claims from two weeks ago were revised up to 430,000
from an originally reported 427,000. Economists had expected them to edge down
to 425,000. The average of new claims over the past four weeks was unchanged
at 424,750. Continuing claims dropped -21,000 to a seasonally adjusted 3.68
million. A total of 7.4 million people received some kind of state or federal
benefit in the week of May 28th, down 209,116 from the prior week. Total claims
are reported with a two-week lag.
Wednesday, June 15, 2011 4:03 p.m est.
Thank you for all of the birthday wishes yesterday it was a nice day
off! As expected the market rallied pretty good, a little over +1% with the
Dow making +123.00 points, S&P 500 +17.00 and the Nasdaq +39.00 points.
Today however, it fell just about -2% on economic worries. Many people were
blaming the Greek austerity plans that were causing riots once again but I think
when the Fed’s New York region reports a negative manufacturing number
along with Home Builders having the worst sentiment ever and throw in oil falling
over -$4, it makes people want to sell. Lows were hit in the final hour with
the Dow seeing lows of -210.00 points, S&P 500 -26.00 points and the Nasdaq
Composite -55.00 points. The good news is that it was also on low volume so
a big part of this may just be expiration related as we are now starting to
move into it tomorrow as this is a quadruple witch expiration starting Friday
morning.
At the close the Dow was down -179.06 points to 11,897.00, S&P
500 -23.00 points to about 1265.00, S&P 100 -9.00 points to 565.00 and the
Nasdaq Composite -47.00 points to about 2631.00. Oil really sold off today most
likely because of worries about a slowdown coming down the pike with it closing
down about -$4.00 to close around the $95.00 level.
Manufacturing activity deteriorated sharply in the New York region
in June, according to the Empire State manufacturing survey released by the
New York Fed. The Empire State index fell below zero to -7.8% in June from +11.9%
in May. This is the first time the index has been below zero since last November.
The decline was unexpected as economists expected the index to move up to 13.3%.
The data is likely to raise concern that the slowdown seen in manufacturing
in May could be more than a temporary soft-patch. The details of the report
were weak. The Employment part of the index dropped -15%. The new orders and
shipments indexes also fell sharply into negative territory.
Add to that Consumer Prices rose a seasonally adjusted +0.2% in May
as the cost of food, clothing, autos and housing all climbed sharply. The consumer
price index advanced despite the first decline in energy prices in 11 months
and the core prices, which strip out volatile food and energy costs, increased
+0.3%, the largest one-month gain since July 2008. Economists had forecast CPI
to be unchanged, with a +0.2% increase in the core rate. Consumer prices have
risen +3.6% over the past year, the biggest 12-month increase since October
2008. Although this is bad it also indicates that the Fed is even more unlikely
to add QE3 and we may even see higher interest rates and that may have been
why the U.S dollar rallied so hard today.
The already-weak index of Builder Confidence for new single-family
homes fell -3% points in June to 13%, the lowest reading since September 2010,
according to the National Association of Home Builders/Wells Fargo Housing Market
Index. Economists had expected a 16% reading. "Builders are being squeezed
by the continuing weakness in existing-home prices - against which they must
compete -- as well as rising material costs," said NAHB Chairman Bob Nielsen,
a home builder from Reno, Nevada. The worst-ever reading was 8% in Jan. 2008,
and the gauge hasn't been above 50% since April 2006. The HMI is a seasonally
adjusted index where any number over 50% indicates that more builders view sales
conditions as good than poor.
Yesterday it was reported that Retail sales fell -0.2% in May to a
seasonally adjusted $387.1 billion. This is the first decline after ten months
of gains. Sales rose a downwardly revised +0.3% in April. Ahead of the report,
economists expected total sales to fall -0.7% in May. Excluding the -2.9% drop
in motor vehicle sales, retail sales rose +0.3%. Economists had expected sales
excluding autos to be unchanged. Core sales, excluding autos, gasoline and building
materials, rose +0.2% in May.
Wholesale prices rose +0.2% in May, the slowest pace in 10 months, as the cost
of food fell and the increase in energy prices tapered off. The more closely
followed core producer index also rose +0.2% in May. Economists had predicted
increases of +0.1% for overall producer prices and +0.2% for the core rate.
Food costs dropped -1.4% last month, owing mainly to lower vegetable prices,
to mark the biggest one-month decline in almost a year. Energy prices, meanwhile,
rose +1.5% in May, the slowest rate since September. The price index for intermediate
goods rose +0.9% and crude prices dropped -4.0%.
Monday, June 13, 2011 4:03 p.m est.
I won’t be writing a report tomorrow as its my birthday and I
never try to work that day unless of course there is a surprise out there, from
there we’ll see how the week goes...
The market made an attempt this morning to break its losing streak
with the Dow seeing highs of +60.00 points, S&P 500 +6.00 points and the
Nasdaq Composite +15.00 points. Of course when S&P lowered their rating
to CCC and high risk there was a sell off with the Dow seeing lows of -40.00
points, S&P 500 -5.00 points and the Nasdaq Composite -20.00 points. It
didn’t last though and the market turned around again going into the final
hour.
This being an expiration traded week I’m sure that it will break
the six week losing streak as they are usually up weeks and the market is quite
oversold so it wouldn’t be surprising to see a bit of a rally. Besides
all that every word that is being spoken is about doom and gloom so sentiment
is following suit. We’re also now headed hard into summer trading and
I’m willing to bet that this will be lowest volume year ever so we’re
likely to see mostly sideways action which is perfect for us!!!
At the close the Dow was up a whopping +1.06 points to 11,953.00, S&P
500 +.85 points to about 1272.00, S&P 100 +1.40 points to 568.00 and the
Nasdaq Composite -4.00 points to about 2639.00. Oil was down hard again because
of that Saudi increase with it closing down about -2.00 cents to close around
the $97.00 level.
Friday, June 10, 2011 4:03 p.m est.
Well after a one day rally the market sold off once again taking back
all of the gains it had made yesterday plus even though there were rumors flying
around about the Fed creating a QE3 program!!! The market slowly lost ground
till it hit bottom midday with the Dow seeing lows of -190.00 points, S&P
500 -21.00 points and the Nasdaq Composite -50.00 points. The market turned
around really quick after it was announced that the Fed would be buying $62
billion in Treasury debt this month in the last round of the program known as
quantitative easing or QE2. The Fed’s Bank of New York said the purchases
will include $12 billion of reinvestments from maturing mortgage-related securities,
which Fed officials have said will continue beyond the end of the month. The
buybacks will begin Monday. Interesting timing for that announcement wasn’t
it!! The final hour saw the market hold its little rally but in the end it sold
off again to close just above lows.
At the close the Dow was down -172.00 points to 11,952.00, S&P 500 -18.00
points to about 1271.00, S&P 100 -7.00 points to 567.00 and the Nasdaq Composite
-41.00 points to about 2644.00. Oil fell hard after Saudi announced it was gong
to increase oil production. It appears that OPEC may be ending soon as the fight
has now started. It closed down -2.65 cents to close around the $99.00 level.
A report out today said that recent housing and employment data suggests
the economy is at a tipping point where a double-dip recession is possible and
home prices could have much further to fall. Robert Shiller said the recent
move up in unemployment is not yet enough of a sign as to which way the recovery
is heading but if unemployment continues to rise in the coming months, it could
suggest another recession. “Whether we call it a double-dip or not, I
think there is a risk,” Shiller told Reuters Insider in an interview.
Data is showing home prices fell into a double dip in March could prove to be
either a seasonal effect over the winter months or part of a downward trend.
“My gut feeling is we might see a continuation of the decline” in
home prices, Shiller said earlier Thursday at a Standard & Poor’s
housing summit. He added that a -10% to -25% fall in real home prices “wouldn’t
surprise me at all,” though he cautioned that was not a forecast. Shiller
pointed to the huge amount of unsold homes on the market and the large amount
of homeowners under water on their mortgages as pressuring prices. As for when
home prices might bottom, Shiller told Insider that was unclear and it was possible
prices could slide for 20 more years. “We’ve seen five years of
decline already since the peak in 2006 and I don’t see evidence that we’re
coming out of it,” he said.
Shiller, known for warning about bubbles in the stock market and housing
market, is also the co-founder of the S&P/Case-Shiller home price index.
Last week the index showed single-family home prices in March move to lows not
seen since March 2003, falling below the previous crisis-era bottom set in April
2009. That report, along with other data, including grim jobs figures and a
slowdown in manufacturing, suggested that the economic soft patch seen in the
first quarter of the year could be more protracted.
Home prices had been supported a little last spring by a tax credit,
but the housing market has struggled since the credit expired. I could almost
see it dragging out for much longer as a 2002 a study showed that about 49%
of the country owned some type if mutual fund and individual stock holders were
only about 20%. I’m sure with all of the volatility we have seen the past
nine years that the numbers are now lower and even if they are the same those
people are likely quite frustrated as the value of these funds have gone down
or are flat. Its also a fact that a lot of people got out of stocks to move
into housing and we know what happened there...
It was reported today Import Prices rose +0.2% in May, a surprise increase
but the smallest gain of the year. Economists were looking for a -0.6% drop
following the revised +2.1% monthly growth in April. Import prices had gained
at least +1% each month since October and have not declined since June 2010.
Higher industrial supplies and materials and finished goods prices offset a
-0.2% dip for fuel, which was the first monthly decline since Sept. 2010. Prices
for overall imports advanced +12.5% over the past year, the largest 12-month
increase since Sept. 2008.
Thursday, June 9, 2011 4:03 p.m est.
And on the seventh day the bears rested! I saw that line somewhere
today and it made a lot of sense! So far June has proven to be true to the fact
that its the worst month of the year! Interestingly the June expiration cycle
has been one of the most up cycles of the year so it will be interesting to
see how this one turns out as would have to rally pretty hard to get positive
with only six trading days to go...
The market started higher as economic data didn’t have any real
surprised in and about midday the Dow saw highs of +130.00 points, S&P 500
+14.00 points and the Nasdaq Composite +20.00 points. The final hour saw profit
taking though so at the close the Dow was up +76.00 points to 12,125.00, S&P
500 +10.00 points to about 1289.00, S&P 100 +4.00 points to 574.00 and the
Nasdaq Composite +10.00 points to about 2685.00. Oil was up again closing up
about +$1.20 to close around the $102.00 level.
Jobless Claims rose slightly last week, reflecting little change in
the labor market. They were up by +1,000 to a seasonally adjusted 427,000. Claims
from two weeks ago were revised up by +4,000 from an originally reported 422,000.
Economists had expected initial claims to fall to 419,000. Claims fell to as
low as 375,000 in mid-February before bouncing higher. The average of new claims
over the past four weeks, meanwhile, dipped -2,750 to 424,000. Continuing claims
dropped -71,000 to a seasonally adjusted 3.68 million. Continuing claims are
reported with a one-week lag. Some 3.99 million people received extended benefits
and is down about -52,000 from the prior week. Many workers who have used up
state benefits are also eligible for extended relief from the U.S. government.
The total number of people receiving some kind of state or federal benefit declined
by -89,233 to 7.60 million. These are also reported with a two-week lag.
The Trade Deficit narrowed sharply in April as imports from Japan were
curtailed due to the earthquake. The nation’s trade deficit narrowed 6.7%
in April to $43.7 billion from a revised $46.8 billion in March. The government
said imports from Japan fell by a record amount in April to $8.8 billion, the
lowest level in a year, following the March 11th earthquake and tsunami. Imports
of autos and auto parts declined sharply. Analysts had expected the deficit
to narrow to $48.0 billion. In addition to the wild-card from the Japan tragedy,
annual revisions to the trade data painted a different picture of the trade
sector this year. Under the revised data, the deficit reached $47.9 billion
in January, its highest level in more than two years, and has been on a downward
trend over the past three months. The deficit in March was revised down to $46.8
billion from $48.2 billion. In real terms, which adjust for inflation, the improvement
in the trade picture in April was even greater, with the deficit narrowing by
almost 11%. These revisions may help brighten the somewhat poor picture of economic
growth in the first half of the year.
Wednesday, June 8, 2011 4:03 p.m est.
Guess what, another quiet day. The market made an attempt at the open
to be up as it is incredibly oversold in the short term as we have now been
down for six straight days. It didn’t hold however and fell slightly into
the red. A bit later on it made another try at a rally and the Dow saw highs
of +30.00 points, S&P 500 +3.00 points and the Nasdaq +1.00 points. Because
tech never really made a comeback, selling took hold and the Dow saw lows of
-40.00 points, S&P 500 -7.00 points and the Nasdaq Composite -35.00 points.
The final hour saw a rally start but it then fell again back to lows.
At the close the Dow was down -22.00 points to 12,049.00, S&P 500 -5.00
points to about 1280.00, S&P 100 -1.00 points to 570.00 and the Nasdaq Composite
-26.00 points to about 2675.00. Oil was lower early on as it looked like there
was going to be a quota increase for OPEC as Saudi Arabia was calling for one
but when a few of the smaller countries seemed to take hold and declare no additional
oil will be pumped, it started to rally closing up +1.65 cents to close around
the $101.00 level. This is the first time this has ever happened and many analysts
are wondering if this will be the end of OPEC.
It was reported at 2:00 p.m est, that the pace of economic growth is
slowing in four of the 12 Fed’s regions, according to the central bank’s
latest survey of economic conditions known as the Beige Book. The report is
more cautious than the past few reports, reflecting the weak pace of growth
in the first quarter that has continued into April and May. Yesterday Fed Chairman
Ben Bernanke said growth was uneven and “frustratingly slow.” The
survey found some slowing in the Philadelphia, New York, Atlanta, and Chicago
districts and there was only one region, Dallas, reported any accelerating growth.
The remaining seven districts said growth continued at a steady pace. The bad
news was that survey did not give any single reason for the slower growth. Consumers
had less money to spend in many regions because of higher prices for food and
energy and deadly storms took their toll on communities and agricultural sectors.
As expected, there was some slowing in the pace of manufacturing reported,
and factory owners were said to be less confident about the economic outlook.
The service sector, information technology and business and professional services
was expanding at a steady pace, the Fed said. Labor markets were seen as still
improving at a gradual pace. Firms in most regions were having trouble passing
along higher commodity prices to their customers. The market for rental properties
was the one bright spot in the housing sector. Agriculture was hit hard by recent
storms. There were some reports that banks were easing standards for loans.
The Fed Beige Book is a collection of anecdotal reports from business
contracts in all regions of the country. It is designed to give Fed officials
a feel for conditions as they prepare for their next Fed meeting on June 21st-22nd.
It is supplemented by more detailed reports that are not made public until five
years after the meeting.
Tuesday, June 7, 2011 4:03 p.m est.
Once again it was a quiet day in the market but it did pop higher with
the Dow seeing highs of +90.00 points, S&P 500 +10.00 points and the Nasdaq
+20.00 points. As the day went on it pulled back though until it fell into the
red after Ben Bernanke started speaking to an international bankers meeting
in Atlanta. Fed Chairman Ben Bernanke said that he is doesn’t agree with
economists worried about a double-dip recession as he defended the central bank
from accusations it’s fueled a boom in commodity prices.
Although he acknowledged the economy has been surprisingly weak so
far this year and there have been recent signs of a loss of momentum in the
labor market, Bernanke was steady on his outlook, saying that both jobs and
growth would pick up in the final six months of the year. “I expect hiring
to pick up from last month’s pace as growth strengthens in the second
half of the year,” Bernanke said.
Bernanke blamed the poor outlook for the April-to-June quarter on the
effects of the Japanese earthquake but this is likely to dissipate in coming
months, he said. At the same time, there is some prospect of lower gasoline
prices as they have pulled back except where I live! Basically he says that,
“growth seems likely to pick up somewhat in the second half of the year.”
The fact that Bernanke did not sound overly alarmed about a slowdown was taken
as a sign that the Fed would be in no hurry to launch another asset buying program,
or quantitative easing plan, once its current $600 billion program ends in June
and that may b e why the market started to fall closing at lows of the day in
the red. The thing that he did indicate though was that he was also in no hurry
to exit, saying that the zero-interest rates and bond purchase plan are still
needed. “Until we see a sustained period of stronger job creation, we
cannot consider the recovery to be truly established,” Bernanke said.
The Fed chairman spent a large portion of the speech trying to calm
market fears about inflation. The latest data show that inflation “should
moderate” assuming that commodity prices stabilize and inflation expectations
remain stable, he said.
Bernanke ended his remarks by stressing the central bank would remain
alert for signs that inflation may flare up. “Most Fed members see the
recent increase in inflation as transitory and expect inflation to remain subdued
in the medium term,” he said. “Should that forecast prove wrong,
however, and particularly if signs were to emerge that inflation was becoming
more broadly based or that longer-term inflation expectations were becoming
less well anchored, the Fed would respond as necessary,” he said.
At the close the Dow was down -19.00 points to 12,070.00, S&P 500
-1.00 points to about 1285.00, S&P 100 -2.00 points to 571.00 and the Nasdaq
Composite -1.00 points to about 2702.00. Oil was lower all day but turned around
midday to close up a mere +.08 cents to close up about $.10 to close around
the $99.00 level.
Monday, June 6, 2011 4:03 p.m est.
The market started the week quietly with slight gains but as the day
went on and volume was transparent it moved down with lows hit in the final
hour. The Dow saw lows of -75.00 points, S&P 500 -15.00 points and the Nasdaq
-25.00 points.
At the close the Dow was down -61.00 points to 12,090.00, S&P 500
-14.00 points to about 1286.00, S&P 100 -6.00 points to 573.00 and the Nasdaq
Composite -30.00 points to about 2703.00. Oil took a hit today as Saudi Arabia
is pushing for more production to lower the price so it will take pressure off
of developing new technologies. It closed down about -$1.50 to close around
the $99.00 level. The market has now been down for five weeks and working on
its sixth with today’s sell off and is starting to get quite oversold
even though it hasn’t pulled back very much. This indicates that were
in a rolling correction and so were likely to remain seeing mostly sideways
action this week. I wouldn’t be surprised to see a slight up week by the
end as we’ll then be moving in a quarterly expiration traded week!
Friday, June 3, 2011 4:03 p.m est.
Yesterday the market bounced which wasn’t surprising considering
how hard it went down the day before but it wasn’t all that much and by
the close it was near the unchanged level and mixed with the Dow and S&P
down and the Nasdaq up +4.00 points. Today the employment report was abysmal
finishing off a week of very poor economic data indicating that the economy
may be headed for a double dip! This caused selling to take hold and the market
cratered at the open with the Dow seeing lows of -150.00 points, S&P 500
-15.00 points and the Nasdaq -40.00 points.
The market almost worked its way back to positive as the day went on
and volume was low but selling in the final hour took it back near lows once
again. At the close the Dow made it five weeks in a row lower with today being
down -97.00 points to 12,151.00, S&P 500 -13.00 points to about 1300.00,
S&P 100 -5.00 points to 578.50 and the Nasdaq Composite -40.00 points to
about 2733.00. Yesterday oil was flat and it was again today although early
on it was down hard after the poor employment report moving under the $97.00
level but going into the weekend it rallied back to close up about +$.10 to
close around the $100.50 level.
Today it was reported that Job growth fell sharply in May with Employment
increasing by only +54,000, much lower than the +150,000 gain expected by economists.
This is the smallest increase since September. The unemployment rate also ticked
higher to 9.1% in May from 9% in the previous month. Economists forecast the
unemployment rate to fall to 8.9%. Average hourly earnings increased +6 cents,
or +0.3% to $22.98. Economists had been expecting a +0.2% gain. Earnings are
up only +1.8% in the past year. The average workweek was steady at 34.4 hours.
The factory workweek rose 12 minutes to 40.6 hours while factory overtime was
unchanged at 3.2 hours. Labor Department officials said they found no evidence
that tornadoes or floods in the Midwest and South affected the data which means
that the economy isn’t looking good at all, conditions should be getting
better not slowing down.
Growth in the Service Sector was little changed in May, according to
a survey of senior executives. The Institute for Supply Management said its
services index edged down to 53.6% last month from an upwardly revised 53.7%
in April. Readings over 50% indicate more firms are expanding than contracting.
Economists expected the services index to come in at 54%.
Yesterday it was reported that Jobless Claims fell slightly last week
to 422,000 from 428,000, the Labor Department. The prior week's number was revised
up from an originally reported 424,000. Economists had expected initial claims
to decline to a seasonally adjusted 418,000. The average of new claims over
the past four weeks, considered a more accurate measure of employment trends,
fell by -14,000 to 425,500, the lowest level in more than a month. Continuing
claims was barely changed, totaling a seasonally adjusted 3.71 million. The
total number of people receiving some kind of state or federal benefit, which
is reported with a two-week lag, fell by -56,742 to 7.68 million.
The productivity of businesses rose +1.8% in the first quarter, slightly
faster than previously reported. The government originally reported an increase
in first-quarter productivity of 1.6%. Real output was revised slightly higher
to 3.2% from 3.1%, while the increase in hours worked was unchanged at 1.4%.
Unit labor costs rose a smaller 0.7% in the first three months of the year,
compared to a prior estimate of a 1.0% increase.
Wednesday, June 1, 2011 4:03 p.m est.
Oh oh, its looking ugly on the economic front. China revealed that
things are slowing down with manufacturing activity expanding in May at its
weakest pace in three quarters and the economy is facing headwinds of high inflation.
The official China Federation of Logistics & Purchasing Managers Index eased
to 52% from 52.9% in April, marking the slowest pace of growth in nine months.
Then you have Greece still sitting on the fence about defaulting along with
a bunch of other European countries so markets overseas were hurting this morning.
Finally with economic data over here absolutely abysmal indicating that the
economy is actually slowing down again its understandable why the market was
down today. When Auto sales were released company by company today with just
about every one of them seeing double digit losses the market seemed to fall
even more. The Dow saw lows of -290.00 points, S&P 500 -32.00 points and
the Nasdaq Composite -70.00 points just before the close which may make for
a bad day tomorrow.
At the close the Dow was down -280.00 points to 12,290.00, S&P
500 -31.00 points to about 1315.00, S&P 100 -13.00 points to 584.00 and
the Nasdaq Composite -66.00 points to about 2769.00. Oil fell hard with everything
else closing down about -$2.60 to close around the $100.00 level.
The report that really started the selling today was just after the
open with the Institute for Supply Management said its gauge of manufacturing
activity fell to 53.5% last month from 60.4% in April. Any reading over 50 indicates
that more manufacturers are expanding instead of shrinking. The manufacturing
sector has expanded 22 straight months, though growth has slowed over the past
three months. Economists had forecast the index to fall to 57.1%, mirroring
a trend in regional manufacturing surveys.
Companies added fewer workers than forecast in May, a sign that job
growth is struggling to gain momentum, data from a private report based on payrolls
showed today. Employment increased by only +38,000 last month, the smallest
increase since September, from a revised +177,000 in April, according to figures
from ADP Employer Services. The estimate was for a +175,000 advance for May.
Such gains in employment are insufficient to help the world’s largest
economy accelerate after a surge in food and fuel costs earlier this year. Estimates
for the ADP data ranged from increases of +125,000 to +200,000. Over the previous
six reports, ADP’s initial figure was closest to the Labor Department’s
first estimate of private payrolls in February, when it understated the gain
in jobs by +5,000. The estimate was least accurate in December, when it overestimated
the increase in employment by +184,000.
Another report today showed employers announced fewer job cuts in May
than a year earlier, signaling the labor market is improving. Planned firings
dropped -4.3% to 37,135 last month from May 2010, according to figures from
Chicago-based Challenger, Gray & Christmas Inc. Government and nonprofit
agencies had the most cutbacks. Today’s ADP report showed a decrease of
-10,000 workers in goods-producing industries, which includes manufacturers
and construction companies.
Employment at factories fell by -9,000. The highly-anticipated Employment
report is out on Friday. The economy is expected to have added +190,000 jobs,
pushing the unemployment rate down to 8.9% for the month of May from 9% the
prior month.
Construction spending improved in April, rising +0.4% to $765 billion.
Construction spending was forecast to fall -0.3%. That said, spending is -9.3%
lower than the April 2010 level. The seasonally adjusted annual rate of private
construction rose +1.7% in April while the seasonally adjusted public construction
rate declined -1.9%.
Tuesday, May 31, 2011 4:03 p.m est.
The market rallied today on thin volume which wasn’t really surprising
as it usually does during this shortened trading week. Economic data was pathetic
however and it almost brought the market down but the thin volume saved the
day and the market closed near its highs! The Dow saw highs of +140.00 points,
S&P 500 +15.00 points and the Nasdaq Composite +45.00 points. At the close
the Dow was up +128.00 points to 12,570.00, S&P 500 +14.00 points to about
1345.00, S&P 100 +7.00 points to 597.00 and the Nasdaq Composite +38.00
points to about 2835.00. Oil rallied on a weak dollar closing up about +$2.00
to close around the $103.00 level.
It appears that were in that time of year where the period from May
27th to June 3rd may be a bit more upbeat as the Memorial Day period combines
with the turn of the month to give two reasons for short term traders looking
for gains. Low volume usually lowers computer driven trading volatility however
if there are some surprises out there economically or politically we could see
some big swings. Once the rally is done within the next few days we’re
likely to see a move lower if history continues to give us a guide. Looking
at the last twenty years of data in and around the Memorial Day holiday there
are some interesting facts, not the least of which is that the so called "Summer
Rally" has been volatile.
For this week according to the history, the market is likely to rise,
with the Nasdaq being the most likely to get the largest gains. Over the last
twenty years, the average gain on the Nasdaq has been +1.42%. Over the last
five years, the gain has been +1.37% on the index with the S&P up +.69%
and the Dow +.78% respectively. After this week though as I mentioned that there
could be volatility by the end of June as the gains are very likely to vanish,
with the Dow losing the most at -2.39% and the S&P losing an average -2.21%
in losses.
The prices of single-family homes in 20 major cities fell for the eighth
straight month and confirmed that there is a double-dip in the housing market,
according to the S&P/Case-Shiller home price index released by Standard
& Poor's. Home prices fell a non-seasonally adjusted -0.8% in March. Prices
have moved down -3.6% in the past year. Home prices declined in 18 of the 20
metropolitan areas tracked by Case-Shiller in March compared with February.
Washington D.C. and Seattle were the only markets where home prices increased
in March.
The Chicago PMI dropped sharply to a reading of 56.6% in May from April's
67.6%, a sign of a weakening recovery. Production, new orders and order backlogs
all dropped sharply. Economists had expected a reading of 60%. "Whether
by plan or by misfortune, the proportion of firms reporting buildup in inventories
increased in May, showing the broadest increase seen since September 2006,"
the survey said. The national Institute for Supply Management's manufacturing
gauge is due Wednesday.
Besides that even sentiment is turning as Consumer confidence fell
in May as Americans grew slightly more pessimistic about future job prospects
and business conditions, according to a closely followed survey. The Conference
Board said its consumer-confidence index fell to 60.8% in May, the lowest reading
in six months from a revised 66% in April. Economists had forecast an increase
to 67.5%. All of this is causing analysts to downgrade the prospects for economic
growth in Q2 by half a percent. The expectations index, which measures the view
of consumers six months out, fell to 75.2% from 83.2% last month, the lowest
reading since last October. A slightly higher percentage of consumers expect
business conditions to get worse over the next six months, 15.5% versus 14%
in April. 20.8% expect fewer jobs to be available, compared to 18.7% in April.
For the present, however, consumers did not appear quite as pessimistic as the
present situation index barely fell, at 39.3% last month from 40.2% in April.
The percentage of consumers who say jobs are plentiful increased to 5.6% from
5.1% in April, although the percentage who say they are hard to get also rose
slightly to 43.9%. The consumer-confidence index remains low by historical standards.
In a healthy economy, the index averages about 95%. The index has more than
doubled, however, since touching a record-low 25.3% in February 2009.
Friday, May 27, 2011 4:03 p.m est.
As you go about your weekend, please stop and take a few minutes to
contemplate the many men and women who made the ultimate sacrifice so that our
freedom and values could continue. I don't think words will ever really thank
them or the families who had to live with their loss, so let's be sure to honor
them first this long weekend.
The market started the day higher even though economic data was poor
and stayed there as volume was nonexistent with highs hit early on with the
Dow seeing +75.00 points, S&P 500 +9.00 points and the Nasdaq Composite
+20.00 points. At the close the Dow was up +39.00 points to 12,442.00, S&P
500 +5.50 points to about 1331.00, S&P 100 +2.50 points to 590.44 and the
Nasdaq Composite +14.00 points to about 2797.00. Oil was quiet closing up about
+$.36 to close around the $100.60 level.
Pending home sales fell -11.6% in April, the National Association of
Realtors reported. The pending home sales index reading of 81.9 in April came
after a downwardly revised 92.6 in March, from an initial reading of 94.1. The
big drop came after two monthly gains, and the NAR cited unusual weather and
economic softness. "The economy hit a soft patch in April from sharply
rising oil prices, widespread severe weather with the heaviest precipitation
in 20 years, and a sudden rise in unemployment claims," said NAR Chief
Economist Lawrence Yun. "Nonetheless, the magnitude of the fall in pending
home sales is larger than can be implied by broad economic factors, so we need
to see if it's just a one-month aberration." The index is -26.5% below
its April 2010 peak, when buyers were trying to beat a contract deadline for
the homebuyer tax credit. The data reflects contracts but not closings, which
normally occur with a lag time of one or two months.
Earlier in the week it was reported that sales of distressed homes
fell in the first quarter as demand remained weak, but they still made up about
28% of total sales which is bad and now that I see pending sales poor this is
bad news! RealtyTrac said it was the highest amount in a year, a report said.
The report added: "Distressed sales accounted for 27.5% of all residential
sales, ticking up from 27% in the fourth quarter of last year, the report said.
It was the highest percentage of sales since the first quarter of 2010."
Consumer spending rose by the smallest gain in three months in April,
a further sign of slower spending momentum due to higher prices at the pump.
Consumer spending rose +0.4% in April. Income rose +0.4% in April and has risen
for seven straight months. Both income and spending were revised lower in March.
The report was mixed in terms of market expectations. Spending rose less than
the +0.5% expected, while the gain in income matched forecasts of economists.
The core rate of inflation, as measured by the personal consumption expenditure
index, rose +0,2% in April, in line with forecasts. On a year-on-year basis,
the core rate is up +1.0% compared with a +0.9% rate in March.
Thursday, May 26, 2011 4:03 p.m est.
I know this sounds like a repeat but once again the market started
the day lower as economic data was poor with the Dow seeing lows of -80.00 points,
S&P 500 -6.00 points and the Nasdaq Composite -10.00 points. Of course the
market turned around as volume was abysmal and the Fed was heavily pumping money
into the system.
The final hour saw the Dow see highs of +50.00 points, S&P 500
+9.00 points and the Nasdaq Composite +30.00 points. At the close the Dow was
up +8.00 points to12,402.00, S&P 500 +5.00 points to about 1326.00, S&P
100 +2.00 points to 588.00 and the Nasdaq Composite +22.00 points to about 2783.00.
Oil pushed back to the $100 level closing down about -$1.00 to close around
the $100.23 level.
The economy only grew at a +1.8% annual rate in the first quarter,
the same growth rate as estimated a month ago. The first quarter growth rate
was much weaker than expected as economists were predicting a revision to a
+2.2% rate. The major surprise was a downward estimate to consumer spending,
only a +2.2% annual rate from the initial estimate of a +2.7% rate. Offsetting
this weakness was an expected faster pace of inventory accumulation. The core
personal consumption expenditure price index rose a revised +1.4%, compared
with the initial estimate of a +1.5% gain. In its first estimate, the government
said Q1 corporate profits before tax increased $113.8 billion or +6.3% to $1.91
trillion.
Jobless Claims rose by +10,000 to 424,000 while the prior week's total
was revised up to 414,000 from an originally reported 409,000. Economists had
expected claims to decline to a seasonally adjusted 405,000. The average of
new claims over the past four weeks, meanwhile, fell by +1,750 to 438,500. The
four-week average is considered a more accurate gauge of employment trends because
it reduces week-to-week volatility in the data. The number of people who continued
to receive unemployment checks declined by -46,000 to a seasonally adjusted
3.69 million. The total number of people receiving some kind of state or federal
benefit, which is reported with a two-week lag, dropped -196,976 to 7.74 million,
the lowest level in more than two years.
Wednesday, May 25, 2011 4:03 p.m est.
Today is a very sad day in the financial news world as Mark Haines
of CNBC unexpectedly died last night. I never knew him but after seeing him
every morning for the past 20-years I feel like I have lost a co-worker. He
was one of a few people I would take the mute button off for as he always stuck
to real facts and never gave up until his question was answered. Besides that
he showed his professionalism in covering 9/11 and making all things relevant
in dire periods of stock market history. He will be sorely missed....
The market started the day lower as economic data was poor with the
Dow seeing lows of -50.00 points, S&P 500 -5.00 points and the Nasdaq Composite
-10.00 points.
As the dollar started to sell off and oil rallied the market turned
higher with the Dow seeing highs of +50.00 points, S&P 500 +6.00 points
and the Nasdaq Composite+20.00 points. At the close the Dow was up +39.00 points
to 12,395.00, S&P 500 +4.00 points to about 1320.00, S&P 100 +2.00 points
to 586.00 and the Nasdaq Composite +15.00 points to about 2761.00. Oil moved
over the $100 level closing up about +$2.00 to close around the $101.30 level.
Orders for Durable Goods fell sharply in April, mainly because of lower
demand for cars and planes. The Commerce Department said new orders for U.S.made
products designed to last three years or more, such as autos or appliances,
dropped -3.6% last month. Economists had expected orders to fall -3%, owing
to fewer bookings for aircraft from Boeing and to parts-supply disruptions in
the auto business related to Japan’s March 11 earthquake. Orders also
have a pattern of declining in the first month of a new quarter. Another category
of orders closely watched by economists, known as core capital goods, dropped
-2.6%, a reversal after having being up +5.4% in March. That category excludes
defense and aircraft and gives a better indication of longer-term trends in
the private sector. Inventories of durable goods climbed +0.9% last month, the
16th consecutive increase.
Tuesday, May 24, 2011 4:03 p.m est.
Yesterday the market was down over -1% but with volume non existent
it actually seemed like a quiet day. There was a lot of economic pressure on
the market as an early reading of China’s manufacturing activity indicated
that it slowed to a 10-month low in May. Then first thing in the morning Sony
cut its net profit estimate for the just-ended business year through March 2011
to a loss of 260 billion yen ($3.2 billion), compared to its previous expectation
of a ¥70 billion net profit. S&P also cut its outlook on Italian debt
and was making comments about Spain and Greece defaulting once again over the
weekend. The market remains on high alert about losses on Greek government debt
and the likely impact on the balance sheets of the euro zone banks and the European
Central Bank. Since the bailout of Portugal though, the euro zone’s major
economies have avoided trouble from the ratings agencies or short sellers. It
looks like the summer may be what everyone is talking about as there are other
weak euro zone areas to watch out for also such as Belgium and France, with
both facing some mild downgrade pressures. Add in Italy, Spain, Portugal and
Greece and lookout below!
The Dow finished down -131.00 points to 12,381.00, S&P 500 -16.00
points to about 1317.00, S&P 100 -7.00 points to 585.00 and the Nasdaq Composite
-44.00 points to about 2803.00.
Today the market started the day slightly to the upside with the Dow
seeing highs of +30.00 points, S&P 500 +5.00 points and the Nasdaq Composite
+10.00 points but when the Richmond Fed joined the Chicago and Philly Fed in
releasing its area figures revealing another marked slowdown, the market started
to sell off with the Dow seeing lows of -40.00 points, S&P 500 -4.00 points
and the Nasdaq Composite -20.00 points. The market almost made a comeback going
into the final hour but selling came once again by the close.
At the close the Dow was down -25.00 points to 12,356.00, S&P 500
-1.00 points to about 1316.00, S&P 100 -.06 points to 585.00 and the Nasdaq
Composite -13.00 points to about 2746.00. Oil has remained below the $100 level
closing up about +$1.90 to close around the $99.60 level.
Today it was reported that New Home sales rose +7.3% in April. The
increase in new-home sales to a seasonally adjusted annual rate of 323,000 was
well above the 295,000 pace expected by economists but doesn’t help much
as inventories for existing homes continues to build due to bank foreclosures.
New-home sales in March rose a revised +8.3% to a 301,000 level compared with
the previous estimate of an +11.1% rise to 300,000. New-home sales are down
-23.1% compared with a year ago. The supply of new homes fell -2.8% to a record
low 175,000. The supply in relation to sales fell to 6.5 months in April from
7.2 months in March. Median sales prices have risen +4.6% in the past year to
$217,900.
Friday, May 20, 2011 4:03 p.m est.
There was nothing out to move the market today and it turned out to
be one of the quietest expirations in quite a while. It appears that traders
are already in vacation mode so this may truly be a “sell in May and go
away” scenario this year. The best news though is we were fully profitable
on both sides of our trades for this expiration cycle! The Dow sold off pretty
strong fist thing this morning as the dollar was strong seeing lows of -130.00
points, S&P 500 -13.00 points and the Nasdaq Composite -30.00 points. The
market almost made a comeback midday but the final hour saw selling once again.
At the close the Dow was down -93.00 points to 12,512.00, S&P 500
-10.00 points to about 1333.00, S&P 100 -5.00 points to 591.00 and the Nasdaq
Composite -20.00 points to about 2803.00. Interestingly oil was higher today
even with the dollar up strongly so we may be seeing a bottom being put in around
the $100 level which means we could continue to see gas move lower except of
course where I live where it has actually gone up because of the dreaded summer
luxury tax. Oil closed up about +$1.00 to close around the $99.50 level.
Thursday, May 19, 2011 4:03 p.m est.
Yesterday the market bounced back about just about 1% with oil surging
back over the $100 level but the bounce was on lower volume indicating people
not wanting to participate in the move. That seemed to be true as we started
higher this morning with the Dow up +70.00 points, S&P 500 +6.00 points
and the Nasdaq Composite +15.00 points early on. When some incredibly poor economic
reports came out with Existing Home sales falling again and prices down another
-5% selling took hold and the Dow saw lows of -20.00 points, S&P 500 -4.00
points and the Nasdaq Composite -10.00 points. Oil also pulled back almost -$2.00
at one point but of course as selling quieted down a low volume bounce occurred
taking the market back into the green that held in the final hour.
At the close the Dow was up +45.00 points to 12,605.00, S&P 500
+3.00 points to about 1344.00, S&P 100 +1.15 points to 596.00 and the Nasdaq
Composite +8.00 points to about 2823.00. Oil was lower today, down over a dollar
at one point but came back with losses of about -$2.00 to close around the $98.00
level. Tomorrow is the last day of this expiration cycle and its looking like
it will be fully profitable as the market isn’t moving much and volume
is very low so its likely to be a quiet day to end the week.
Here are some interesting facts about the price of oil right now:
$112 million was basically stolen from consumers yesterday. It will happen again
today and probably tomorrow and that is on top of the $800 Million PER DAY that
is being overcharged by oil companies in America alone, according to Exxon’s
CEO Rex Tillerson. He testified before Congress last week because they are looking
at the price of oil and of course it didn’t make the main stream news
but it should have! He said; "based purely on supply and demand oil should
be in the $60 to $70 a barrel range." The reason it’s above $100
a barrel, Tillerson explained, is due to the oil majors using futures contracts
to lock in current high prices, and speculation that is engineered by the high-frequency
trading of quantitative hedge funds.
Other disclosures were made in last week’s testimony that is
interesting:
The average cost of producing 1 barrel of oil was $11!!!! The average price
of the oil in the marketplace at $100 is about 9 times the cost of getting the
oil out of the ground. I believe that every company is free to make a profit
but gouging is ridiculous.
Oil jumped yesterday by +$3.00 over the $100 level once again because
of a supposed draw-down in oil inventories which the media proclaimed was because
demand is picking up. This is so untrue because if you really take a look you
see that the net drawdown of -100,000 barrels was because net Imports shipped
is -1.2 Million barrels per day less than last year or -8.4 million barrels
a week less oil.
Clearly there is also no shortage of oil, the U.S has 1.75 billion
barrels of oil in storage, enough to offset 186 days of imports (9.4Mbd) and
60% of those imports come from Canada and Mexico, not OPEC so our 1,750 million
barrels of storage would offset over 500 days worth of imports from the Middle
East and Africa even if it was cut off. Existing homes and condos sale fell
-0.8% in April to a seasonally adjusted annual rate of 5.05 million, the National
Association of Realtors reported. The decline was a surprise as economists expected
sales to rise to 5.25 million units in April, based on a surge in pending home
sales in March. Sales rose a revised +3.5% in March to 5.09 million units, down
from the initial estimate of a +3.7% rise to 5.1 million units. The median price
of homes sold was down another -5% in April from last year at $163,700. Inventories
of existing homes for sale also rose to 9.9% to 3.87 million units in April,
representing a huge 9.2 months supply, up from 8.3 months in March.
Jobless Claims fell to 409,000 last week from an upwardly revised 438,000
in the prior week. Economists expected claims to decline to a seasonally adjusted
424,000. The average of new claims over the past four weeks, meanwhile, climbed
+1,250 to 439,000, remaining at the highest level since November. The four-week
average is considered a more accurate gauge of employment trends because it
lessens week-to-week volatility in the data. Also, the number of people who
continue to receive unemployment checks forever it seems, fell by -81,000 to
a seasonally adjusted 3.71 million. The total number of people receiving some
kind of state or federal benefit, which is reported with a two-week lag, dropped
-47,124 to 7.94 million.
Business activity at manufacturing firms in the Philadelphia region
grew in May but at a much slower pace compared to a few months ago, according
to the survey issued by the Fed’s Bank of Philadelphia. The Philly Fed
index sank to 3.9% in May from 18.5% in April, well below expectations of an
increase to 20.1%! Any reading over zero in the diffusion index indicates growth
but this is bad! Higher readings mean that more firms are reporting better conditions
instead of worse conditions.
The pace of economic growth may be "choppy" in the summer
and fall, the Conference Board said Thursday as it reported that its leading
economic index fell -0.3% in April, the first monthly decline since June. Four
of the 10 indicators included in the LEI made positive contributions in April,
led by the interest rate spread. The largest negative contribution came from
average weekly initial claims for unemployment-insurance benefits. Economists
had expected the index to show no growth in April. The gauge for March was revised
higher to +0.7% from a prior estimate of +0.4%. The LEI is a weighted gauge
of 10 indicators that are designed to signal business cycle peaks and troughs.
For the six months through April, the LEI gained +3.5%, up from +1.4% in the
prior six months.
Tuesday, May 17, 2011 4:03 p.m est.
The market was lower once again today as economic data was pretty bad
with the Dow seeing lows of -160.00 points, S&P 500 -10.00 points and the
Nasdaq Composite -25.00 points. As the day went on the market came back with
the Nasdaq Composite actually moving back into positive territory. In the short
term the market is getting oversold as we move into the final three days of
expiration so we may have seen the bottom for the week here.
At the close the Dow was down -70.00 points to 12,480.00, S&P 500
-.50 points to about 1329.00, S&P 100 +.25 points to 590.50 and the Nasdaq
Composite +1.00 points to about 2783.00. Oil was lower today, down over a dollar
at one point but came back with losses of about -$.50 to close around the $97.00
level.
Housing Starts fell -10.6% in April to an annual rate of 523,000, while
permits declined -4%. Housing starts in March were revised up to 585,000 from
an original reading of 549,000. Economists had expected housing starts in April
to climb to an annual rate of 575,000 on a seasonally adjusted basis. Permits
for new construction, viewed as a gauge of future demand, fell to an annual
rate of 551,000 from March's upwardly revised level of 574,000. Permits for
single-family homes, which account for three-quarters of the housing market,
dropped -1.8% to an annual rate of 385,000 last month.
The output of the nation's factories, mines and utilities was weaker-than-expected
in April as a parts shortage due to the Japanese earthquake led to a drop in
auto assemblies, the Fed said. Industrial production was flat in April, well
below the +0.3% increase expected by economists. Adding to a sense of weakness
in the report, industrial output in February and March was also revised lower.
Factory activity alone fell -0.4% in April, which was the first decline after
nine straight monthly gains. Total motor vehicle assemblies dropped to a 7.9
million unit annual rate in April from a 9% million rate in March. Excluding
motor vehicles and parts, factory production rose +0.2% in April. Capacity utilization,
a gauge of slack in the economy - slipped to 76.9% in April from 77% in March.
Monday, May 16, 2011 4:03 p.m est.
Selling remained strong today with the Dow seeing lows of -70.00 points,
S&P 500 -7.00 points and the Nasdaq Composite -20.00 points in the first
few minutes of trading. With volume low the market came back to see the Dow
up +55.00 points, S&P 500 +6.00 points but the Nasdaq was only able to make
it up +5.00 points. Selling took hold once again in the final hour with new
lows made in the S&P 500 of -10.00 points and the Nasdaq Composite -50.00
points.
Earnings are now basically finished and even though they came in well
above expectations overall, the market is always looking forward and the reason
for the selling of late may have something to do with what the future is holding
because of high gas prices and a lackluster housing sector. We are also in a
poor seasonal time of year and the market does need a rest from its gains of
late so with this being an expiration traded week we could see a bit more downside.
At the close the Dow was down -47.00 points to 12,548.00, S&P 500
-8.00 points to about 1330.00, S&P 100 -4.00 points to 590.00 and the Nasdaq
Composite -46.00 points to about 2782.00. Oil was lower all day with losses
of about -$2.30 to close around the $97.40 level.
An index that measures the confidence of home builders was unchanged
in May, suggesting virtually no improvement in the sideways housing market.
The National Association of Home Builders said its Housing Market Index, produced
in tandem with Well Fargo, remained "at the low level of 16." Economists
had expected the HMI to rise to 17. It is seasonally adjusted index in which
any number over 50 indicates more builders view sales conditions as good. The
last time the index topped 50 was in April 2006.
Friday, May 13, 2011 4:03 p.m est.
The market bounced out of the gate after consumer sentiment seemed
better than expected but it wasn’t by much and as oil slipped with the
dollar gaining strength the market started to fall with lows hit midday with
the Dow seeing lows of -160.00 points, S&P 500 -16.00 points and the Nasdaq
Composite -40.00 points. The final hour saw an attempt at a rally as oil came
all the way back to close higher because a couple of pipelines in Louisiana
but selling remained so the market closed lower.
At the close the Dow was down -100.00 points to 12,596.00, S&P
500 -11.00 points to about 1338.00, S&P 100 -5.00 points to 594.00 and the
Nasdaq Composite -35.00 points to about 2829.00. Oil was lower all day but came
back to close with gains of about +.70 to close around the $99.70 level.
Consumer prices rose a seasonally adjusted +0.4% in April, led by higher
gas costs. Core prices rose only +0.2% because it takes out that unneeded volatile
food and energy costs. Remember its all about how much your plane costs every
year!! Economists had forecast CPI to rise +0.4% overall, with a +0.2% increase
in the core rate. Consumer prices have jumped an unadjusted +3.2% over the past
year, the largest 12-month increase since October 2008. Average hourly earnings
of workers, meanwhile, fell -0.3% last month after taking inflation into account.
Inflation-adjusted hourly wages are down -1.2% over the past 12 months.
The University of Michigan-Thomson Reuters preliminary Consumer Sentiment
Index climbed to a reading of 72.4% from a reading of 69.8% in April. Economists
expected a 71% reading. The gauge hasn't been above 100% since January 2004
and was at 76.1% on the eve of the last recession.
Thursday, May 12, 2011 4:03 p.m est.
Interesting;
Hedge funds are rethinking strategies and future after the conviction of Raj
Rajaratnam on 14 counts of insider trading "sent a chill down Wall Street,
causing hedge funds to rethink their use of so-called expert analyst networks
and also ponder the impact of the historic decision on the implementation of
the Dodd-Frank regulatory bill," reported CNBC.com. The decision is expected
to lead to, among other things, the possibility of lower stock trading volume
on Wall Street as well as possibly influencing "billionaire" hedge
fund managers with regard to deciding how to trade or whether to stay in the
business at all.
The market started the day down again as the dollar was stronger and
oil was almost another -$2.00. Lows were hit in the first half of trading with
the Dow seeing lows of -100.00 points, S&P 500 -10.00 points and the Nasdaq
Composite -25.00 points but when the dollar turned around and started moving
lower the market and oil turned higher with the Dow seeing highs of +80.00 points,
S&P 500 +8.00 points and the Nasdaq Composite +20.00 points. The final hour
saw some profit taking once again but in the end the market came back once again.
At the close the Dow was up -66.00 points to 12,695.00, S&P 500
+7.00 points to about 1349.00, S&P 100 +2.00 points to 599.00 and the Nasdaq
Composite +18.00 points to about 2863.00. Oil was lower by almost -$2.00 early
on but when traders decided to pump it up it rallied at one point over the $100
level but fell back in the end to close up about +.76 to close around the $99.00
level.
Retail sales increased +0.5% in April to a seasonally adjusted $389.4
billion and is the 10th straight month of sales gains. Economists expected total
sales to rise +0.7% in April. Details of the April increase were mixed. On the
positive side, retail sales were revised higher in March and February but the
gain in April was due in large part to higher gas prices. Sales excluding autos
and gasoline rose +0.2% in April, which was the smallest gain since December.
Excluding the +0.2% rise in car sales, retail sales rose +0.6%. Economists had
expected a +0.7% increase.
Wholesale prices rose a seasonally adjusted +0.8% in April, once again
driven by surging fuel costs. Wholesale prices have jumped an unadjusted 6.8%
in the past year, the largest 12-month increase since September 2008. The more
closely followed core producer index rose +0.3% in April. The core index is
usually viewed by investors and the Fed as a better gauge of inflationary pressure
because it excludes the volatile food and energy categories. Economists had
predicted a +0.8% increase in overall producer prices and a +0.2% increase in
the core rate. Wholesale energy prices climbed +2.5% in April while wholesale
food prices rose +0.3%.
Jobless Claims fell by -44,000 last week to 434,000, partly reversing
a large spike earlier in April. Economists had expected applications for jobless
benefits to decline to seasonally adjusted 428,000 from an upwardly revised
478,000 in the prior week. The average of new claims over the past four weeks
rose by +4,500 to 436,750, the highest level since November. The four-week average
is considered more accurate a gauge of employment trends because it lessens
week-to-week volatility in the data. Meanwhile, continuing claims increased
by +5,000 to a seasonally adjusted 3.76 million. Altogether, 7.98 million people
received some kind of state or federal benefits, down -31,247 from the prior
week. It's the first time in several years the number has fallen below 8 million.
Wednesday, May 11, 2011 4:03 p.m est.
The market was down pretty hard today as commodities overall were sold
once again and the dollar was strong. Oil trading was actually halted once as
prices fell so fast. The Dow saw losses of -185.00 points, S&P 500 -21.00
points and the Nasdaq Composite -40.00 points but a little buying at the close
saw losses cut a bit. Cisco’s earnings just after the close were worse
then expected and they continue to see a lot of slack in the economy so it looks
like trading may be rough tomorrow morning.
At the close the Dow was down -130.00 points to 12,630.00, S&P 500 -15.00
points to about 1342.00, S&P 100 -7.00 points to 597.00 and the Nasdaq Composite
-27.00 points to about 2845.00. Oil closed down pretty hard about -6.00 to close
around the $98.00 level.
The trade deficit widened by +6% in March to $48.2 billion. The trade
deficit was above the forecast of economists for a deficit of $47.0 billion
and is the largest deficit in nine months. Imports rose faster than exports
in March even though as exports rose to the highest level on record while imports
were the strongest since August 2008. The deficit is quite close to government
estimates in the advance first quarter gross domestic product report suggesting
little revision to GDP from trade. The trade sector subtracted slightly from
Q1 GDP after adding 3.3 percentage points to growth in the fourth quarter.
Tuesday, May 10, 2011 4:03 p.m est.
Yesterday the market ended the day up a little less than half a percent
on one of the most abysmal volume days of the year even though it looked like
Greece Part 2 could be around the corner and it was reported that House prices
fell -3% last quarter alone and for all of 2011, it could fall -10%.
According to The Wall Street Journal: "Europe's debt crisis has
returned full circle to the problem that started it over a year ago: How to
save the malfunctioning Greek state from running out of money. Greece has been
slipping farther behind its targets for cutting its budget deficit and is expected
to need nearly €30 billion ($43 billion) of extra financing for 2012, according
to euro-zone officials." Because of this Standards and Poor’s cut
Greece's credit rating to B from BB- because euro-zone officials are looking
to extend the debt payment maturities of the European Commission's portion of
the nation's 110 billion euro bailout.
If you thought the housing crisis was bad, think again as its actually
worse then you think. New data just out from Zillow, the real-estate information
company, show house prices are falling at their fastest rate since the Lehman
collapse.
Average home prices are down -8% from a year ago and -3% over the quarter,
and are falling at about -1% every month, according to Zillow. The percentage
of homeowners in negative-equity positions with a home worth less than its mortgage
has rocketed to +28%, a new crisis high! Zillow now predicts prices will fall
about -8% this year and says it no longer expects the market to bottom before
2012. “There’s no way we can get to flat, from these depreciation
levels, in the last nine months of the year,” says Zillow economist Stan
Humphries. “Demand is a lot more anemic than we had previously thought.”
When in 2012 does Zillow see the market bottoming out even though the
government spent an estimated $22 billion between 2008 and 2010 on tax breaks
to prop up the housing market. They think that all it achieved was a brief suckers
rally that ended last summer. “As we said at the time, it was a giant
waste of money,” says Mark Calabria, economist at the conservative Cato
Institute. “None of these things really turned the housing market around.
They just put off the adjustment for awhile.” It’s hard to overestimate
the scale of the carnage in the housing market. Zillow found prices fell in
all but four U.S. metro areas. Falling real-estate prices mean spiraling hidden
losses throughout the economy, from banks to homeowners. This is very similar
to Japan’s “zombie banks” that were the financial institutions
that stuck around during that country’s economic recovery after the 1990
crash. They continue even to this day with huge losses they can never repay.
To read more about this go to;
http://curiouscapitalist.blogs.time.com/2011/05/09/will-home-prices-continue-to-fall/
Today there wasn’t much out to move the market and highs were
hit in the first few minutes of trading before the market settled into a grind.
Just before the final hour new highs were hit on even lower volume with the
Dow seeing +100.00 points, S&P 500 +13.0
0 points and the Nasdaq Composite +35.00 points. At the close the Dow
was up +76.00 points to 12,760.00, S&P 500 +11.00 points to about 1357.00,
S&P 100 +4.00points to 603.00 and the Nasdaq Composite +29.00 points to
about 2871.00.
Oil was volatile after closing up almost +$6.00 yesterday and by the
close today it was much higher closing up about +1.30 closing around the $104.00
level. Jumping markedly for the second straight month, import
prices shot up +2.2% in April, the Labor Department reported, as fuel prices
surged +6.7%. That's above the +1.6% that economists had anticipated and is
the first time import prices increased by more than +2% in consecutive months
since June 2008. Export prices meanwhile rose +1.1%.
Friday, May 6, 2011 4:03 p.m est.
Now I know why volume has been so slow. . .Generation Xers are staying
away from stocks.
According to The Smart Money.com: "Financial advisers generally
recommend that Gen Xers – those 50 million or so Americans now in their
30s and early 40s – have at least 70% of their retirement portfolios in
stocks. But according to data from several investment and research firms, many
Gen Xers are playing it far safer than their parents, and are growing increasingly
conservative over time. On average, individuals aged 30 through 44 had just
48% of their 401(k)s in equities at the end of 2009, down from 55% in 2007,
according to an analysis by the nonprofit Employee Benefit Research Institute
for SmartMoney.com. By comparison, boomers had about 41% in stocks, down from
more than 48% in 2007, EBRI reported." Why so scared? It's pretty simple,
they've seen too many booms and busts. And unlike their parents they are more
likely to see the corruption and fraud that surrounds them.
This morning it was reported that Employment was up +244,000 jobs in
April, the biggest increase in almost a year, but the nation's unemployment
rate rose to 9.0%, according to government data. Economists predicted a net
gain of +175,000 jobs. Payrolls for March and February, based on a survey of
business establishments, were also revised up by a combined +41,000. The separate
survey of households found that the labor force actually fell in April by -190,000
to 139.7 million however which was why jobless rate moved up to 9.0% from 8.8%
in March. This was the first increase since last November. Average hourly earnings
rose +0.1% to $22.95 and the average workweek remained unchanged.
Jobless Claims have been up nearly +100,000 in the past two months
however which isn’t good for the long run for growth. The drop in the
size of the labor force, however, might raise a cautionary flag. One of the
biggest contributors to hiring was Mcdonalds with +62,000 however and the Birth/Death
adjustment was 175,000 so the gains may not be that great after all and the
pay scale is way down which isn’t good. All in all though at least they
aren’t down so its good! The biggest increase in jobs occurred in the
retail sector: Retailers hired +57,000 workers last month while professional
and business services created +51,000 jobs, health-care companies hired +37,000
employees and the leisure and hospitality sector added +46,000 positions. Manufacturers
also increased employment, by +29,000. The biggest decline took place in government,
continuing a recent trend as they fell fell by -24,000.
The good news in the employment report helped the market to pop today
with the Dow seeing +170.00 points, S&P 500 +20.00 points and the Nasdaq
Composite +45.00 points. When it was announced that Greece may be considering
leaving the EU the American dollar started to rally and that took the wind out
of oil and the market.
Lows were hit in the final hour with the Dow seeing -10.00 points,
S&P 500 -1.00 point and the Nasdaq Composite basically unchanged. The market
bounced back in the final hour to cut losses but it was still quite disappointing
to end the week.
At the close the Dow was up +55.00 points to 12,638.00, S&P 500
+5.00 points to about 1340.00, S&P 100 +2.00 points to 597.00 and the Nasdaq
Composite +13.00 points to about 2828.00. Oil was higher earlier on by +$2 but
gave it all back plus as the dollar rallied once again to close with good gains.
It finished the day down about -3.00 closing around the $97.00 level.
Thursday, May 5, 2011 4:03 p.m est.
Today had an ugly start of the day to it with some pretty sad looking
headlines:
Jobless Claims rise an unexpected +43,000 to 474,000...
Mexican Central Bank Quietly Buys 100 Tons of Gold...
Food Prices Rise to Near-Record as Inflation Accelerates...
DOLLAR HITS 3 YEAR LOW...
1 IN 7 PEOPLE ON FOOD STAMPS!
Cash-Strapped School Districts Considering 4-Day Weeks...
Treasury suggests $2 trillion debt cap raise...
The market started the day down pretty good but as the day went on
money seemed to be coming out of commodities and into technology because at
one point the S&P 500 was up +1.00 point and the Nasdaq Composite +20.00
points. When oil doubled its losses in the final hour, stocks really sold off
with the Dow seeing lows of -200.00 points, S&P 500 -19.00 and the Nasdaq
Composite -25.00 points however. Another reason for all of the selling today
was that Jobless Claims were terrible indicating that the employment report
that is coming out tomorrow morning could be much worse than expected. It will
be a report that is watched carefully for sure.
At the close the Dow was down -139.00 points to 12,584.50, S&P
500 -12.00 points to about 1335.00, S&P 100 -7.00 points to 595.00 and the
Nasdaq Composite -14.00 points to about 2815.00. Oil basically collapsed today
down about -11.00 at one point settling at the close with a loss of -$9.44 around
the $99.080 level.
Jobless claims jumped a huge +43,000 to 474,000, the highest level
in almost nine months. A Labor official attributed much of the increase to temporary
layoffs in the auto sector and in the state of New York, where workers in the
educational field such as bus drivers are eligible for compensation during the
week of spring break. They had other excuses also so it seemed like they were
making things up to make it not look so bad. Economists had expected claims
to fall to seasonally adjusted 412,000 from the prior week's revised level of
431,000 however so they were way off. The average of new claims over the past
four weeks, meanwhile, climbed by +22,250 to 431,250, the highest level since
November. The four-week average is considered more accurate a gauge of employment
trends because it lessens week-to-week volatility in the data. Continuing claims
increased by +74,000 to a seasonally adjusted 3.73 million. Altogether, 8.01
million people received some kind of state or federal benefits last week.
The productivity of American businesses rose +1.6% in the first quarter,
but hourly wages of workers adjusted for inflation fell by largest amount in
almost three years, the government reported. Economists expected productivity
to increase by a seasonally adjusted +1.5% in the first quarter from an upwardly
revised +2.9% in the final three months of 2010. The quantity of goods and services
produced, known as real output, grew at an annual rate of +3.1%. Hours worked
rose +1.4%. The unit cost of labor, meanwhile, rose by a +1.0% annual rate in
the first quarter. Compensation per hour rose +2.6%, but real compensation per
hour, which adjusts for inflation, fell by -2.5%, the biggest decline since
the third quarter of 2008.
This is interesting as we have approximately $9 Trillion (6% of $150T)
in annual debt payments that must be absorbed annually by increased productivity
of working people. Consider that the economy at approximately $15 Trillion is
25% of the global economy. Therefore the global economy approximates $60 Trillion
($62T officially, but we will use round numbers so we don’t lose anyone
in the arithmetic). The working class therefore has to increase productivity
by $9T divided by $60T or 15% annually to absorb the current global use charges.
In the last few years of explosive debt growth we have passed the point of the
global economy being able to grow and improve productivity at a fast enough
rate, not to be…
Wednesday, May 4, 2011 4:03 p.m est.
Whoops, this is what happens when you don’t do your final read!
It was pointed out to me that I made an error in my statement about America
looking toward Canada for help in getting back on track economically. What I
meant to say was that; The American government may also want to take note that
last night Canada saw the Conservatives get a majority government and the Liberals
who were expected to win were decimated! All of the left based media pundits
had been declaring that the Liberals were going to win easily but obviously
the people have spoken, they like lower taxes and spending cuts, thus the reason
why the Canadian economy is holding up so much better than the U.S, just look
at how strong the Canadian dollar is now....
Did you know that in Hana Maui gas is now $6.03 per gallon. There has
also been another huge setback for al qaeda as it was just announced this morning
that osama bin laden was the only person who knew the organizations iTunes password!
As oil and commodities sold off again this morning the market was lower
with the Dow seeing lows -140.00 points, S&P 500 -15.00 and the Nasdaq Composite
-35.00 points. It came back a bit midday but still ended the day lower. At the
close the Dow was down -85.00 points to 12,723.50, S&P 500 -9.00 points
to about 1347.00, S&P 100 -4.00 points to 602.00 and the Nasdaq Composite
-13.00 points to about 2828.00. Oil sold off strongly once again off -$2.00
plus and closed just a little off of that level around the $109.00 level now.
There seems to be a big shift moving now as it was reported today that
the fall in commodity prices may just be the start of other markets falling
along with it. Hedge funds, including some run by George Soros are at least
partially responsible for the decline in silver prices over the last few days,
according to reports. The Wall Street Journal noted: "George Soros's big
hedge fund, a firm operated by high-profile investor John Burbank and some other
leading firms have been selling gold and silver, according to people close to
the matter, after furiously accumulating precious metals for much of the past
two years." This makes sense as the public have joined in the frenzy and
of course this is when the professionals usually start to sell so at the least
the rally may be capped now. Precious metals have been helped of late by commercials
on cable and talk radio, people clearing the attic and heading for the pawn
shop and the meltdown middle man and even salesman coming to your door with
portable test kits to buy your gold and silver!
According to Reuters: "As investors send prices soaring for not
only gold, but now also silver, consumers have been unearthing ancient stashes
of silverware, teapots and jewelry from long-discarded beaus, and trading them
in at pawn shops or selling them on eBay for cash." Indeed, thanks to silver's
recent record prices, the marketplace has changed. Reuters reported that soaring
silver prices have had "an effect across the spectrum of retailers dealing
with precious metals. Plain old silver enjoys new cachet among jewelers moving
away from gold.
Silver, though, is a totally different than gold because of its lower
price and it actually has a use in computers etc so it attracts a wider audience,
but its volatility has always been a bit extreme. That means that the recent
decline could reverse at any moment, even if for a short period of time, creating
an environment where poorly timed entry and exit points could lead to big losses
in a hurry. Silver is now trading close to the $40 per ounce price, an area
that could lead to significant amounts of volatility as hedge funds make decisions
about what to do next with their current positions. Employment in the private
sector increased by +179,000 in April on a seasonally adjusted basis, according
to payroll data compiled by Automatic Data Processing Inc. The drop from March's
increase of +201,000 which was revised upward to +207,000. In a separate report,
the outplacement firm Challenger Gray said announced company layoffs fell to
-36,490 in April, the third lowest level in 16 months. The government sector
accounted for more than one-quarter of the planned job cuts. Private-sector
payrolls have risen an average of +196,000 a month in the first four months
of 2011 on a seasonally adjusted basis, according to ADP data but the economy
needs to add jobs at a much faster rate, something like 300,000 a month to get
the nation’s +8.8% unemployment rate back down to pre-recession levels.
ADP and Challenger reports come out before the Labor Department’s release
of April’s employment data on Friday. Economists are forecasting that
there will be +175,000 jobs added last month, down from an originally reported
+216,000 in February.
Tuesday, May 3, 2011 4:03 p.m est.
I’m still thinking about how well those Navy Seals did taking
out bin laden giving everyone a new respect for America however we have to get
back to reality and things just don’t look great within the big picture
of the economy. The London Telegraph ran a headline over the weekend saying
that “America’s reckless money printing could put the world back
into crisis,” pointing out that, despite Bernanke's rosy assessment of
the economy: "In the real world, U.S growth is slowing sharply.
Annualized GDP rose just +1.8% during the first three months of 2011,
down from +3.1% the quarter before. America remains mired in sovereign, commercial
and household debt." They basically sum it up quite nicely, saying: "So
the Fed will keep on "printing" virtual money, at least for now. By
the end of June, it will have purchased $600bn (£363bn) of longer-term
Treasuries, with the US government effectively buying its own debt from funds
created ex nihilo. That's on top of the original $1,750bn (£1,048bn) QE
scheme, launched in late 2008." It’s funny how they call it a "scheme,"
so it does get to the facts, doesn't it? The whole article is a good read;
America's Reckless Money-Printing Could Put the World Back into Crisis.
The American government may also want to take note that last night
Canada saw the conservatives get a majority government with the Conservatives
and Liberals were decimated! All of the left based media pundits had been declaring
that the Liberals were going to win but obviously the people have spoken, they
like lower taxes and spending cuts, thus the reason why the Canadian economy
is holding up so much better than the U.S, just look at how strong the Canadian
dollar is now....
Today the market started the day lower once again but it became mixed with the
Dow moving to +30.00 points but heavy selling in tech held back the S&P
and Nasdaq.
At their lows the Dow was off -60.00 points, S&P 500 -12.00 and
the Nasdaq Composite -45.00 points going into the final hour as oil was being
sold off strongly.
At the close the Dow was able to make it back into positive territory
up a whole +.15 points to 12,807.50, S&P 500 -5.00 points to about 1357.00,
S&P 100 -1.00 points to 606.00 and the Nasdaq Composite -22.00 points to
about 2842.00. Oil sold off strongly at one point off -$3.00 and closed just
a little off of that level around the $111.00 level.
Factory orders rose in March for the fifth consecutive month, rising
+3% to $462.9 billion. Economists had expected a +2.2% increase. Shipments increased
for the seventh straight month, rising +2.7% to $461.4 billion. Inventories
were up fourteen of the last fifteen months, increasing +1.1%. Durable goods
orders rose +2.9%, up from the previously published +2.5%.
Monday, May 2, 2011 4:03 p.m est.
Well I must say, people must be proud to be American today as it was
released last night that bin laden was killed in an attack done by Navy Seals
in Pakistan with incredible precision and timing. Supposedly it was just like
you see in the movies which you think would be impossible in real life but it
was all done in 40-minutes! Another surprise that you wouldn’t think would
happen is that they didn’t even inform Pakistani government leaders but
instead snuck in and out even though there was a police station right across
the street and only a few blocks away from the Pakistan version of West Point!
This gives a huge boost to the American Army that they are still the mightiest
force in the world and you don’t want to screw with them when they get
serious about taking action!
Of course just like when saddam hussein was captured the market started
the day strongly higher as Globex futures ramped up after President Obama made
the announcement. The Dow made highs of +70.00 points, S&P 500 +7.00 points
and the Nasdaq saw +15.00 points. The jubilation didn’t last though as
concerns about the upcoming date with the debt ceiling crept in and the market
turned lower with the Dow off -25.00 points, S&P 500 -4.00 and the Nasdaq
Composite -15.00 points.
At the close the Dow was down by -3.00 points to 12,807.00, S&P
500 -2.40 points to about 1361.00, S&P 100 -1.00 points to 607.00 and the
Nasdaq Composite up -10.00 points to about 2864.00. Oil was lower -$1.50 early
on but then rallied before closing down a little by about -.40 to be around
the $113.50 level.
Another week, and more highs across the board for the market. It sure
seems like it was a long time ago that just two weeks ago Standard & Poor's
downgraded American debt to negative! We’re now in May so its time to
“sell in May and go away” and interestingly on April 26th, 2010
the peaked and then fell -17% into early July before a strong end-of-year rally.
Part of this was because of the “Fashcrash” that occurred! There
are some major warning signs happening right now that warrant a pullback like
the upcoming debt ceiling being increased and possibly some retaliation after
the death of bin laden but I think it would just be a normal pullback or even
just a digestion of the gains.
The reason is because the current rally seems to be completely dollar
induced as it has fallen off the board last week falling over -1% now getting
near its all time low of 72 set in April of 2008, down 14 of the last 16 days.
Commodities are also now at highs that were hit in 2006, just before they roared
to their high in 2008 led by $140 oil and when it cracks we’ll likely
see a large correction occur which would also likely be followed with the dollar
rallying and stocks headed lower! I guess the question is will "they"
really allow energy prices to go back to all-time highs, the dollar to go below
72, the euro to head toward 1.60, etc? Are "they" really that dumb
to paint themselves into an obvious corner once more?
Manufacturing activity grew at a slightly slower pace in April, the
second straight month of slowing. The Institute for Supply Management said its
manufacturing gauge fell to 60.4% from 61.2% in March, mostly because of slower
growth in production and new orders. Economists had forecast the index to move
to 59.5% so this was actually good news. Despite the decline, the manufacturing
sector has expanded 21 straight months, and ISM index is coming off a seven-year
high just two months ago. Any reading over 50% indicates more manufacturers
are expanding instead of shrinking. Seventeen of the 18 industries tracked by
Tempe, Ariz.-based ISM expanded in April, led by wood, plastic and rubber products.
The furniture industry was the only one to report contraction. Although manufacturers
are hiring more workers to keep up with higher demand, they also continue to
express alarm about the cost of raw materials. “While the manufacturing
sector is definitely performing above most expectations so far in 2011, manufacturers
are experiencing significant cost pressures from commodities and other inputs,”
said Norbert Ore, who heads the ISM survey committee. The ISM’s price
index rose +0.5% to 85.5%, a nearly three-year high. Some 72% of respondents
said they paid more for raw materials vs. only 1% who paid less. Five months
ago, only 48% said they paid more for raw materials. “Rapidly rising raw
material costs are putting extreme pressure on profits,” one food company’
purchasing manager said.
The ISM’s employment index, meanwhile, fell to 62.7% from 63%
in March, but the readings for the first four months of 2011 are the highest
in 38 years. The backlog of orders index posted the biggest increase, jumping
to 61% from 52.5% in March. Also, the inventories index rose to 53.6% from 47.4%,
as companies seek to restock to meet a high level of orders. The production
index experienced the biggest drop, falling -5.2% to 63.8%. The new orders index,
a strong indicator of future sales, fell a smaller -1.6% still-high 61.7%. The
ISM asks about 350 purchasing managers if their business got better or worse
over the past month.
Construction Spending rose +1.4% in March, the Commerce Department
reported. Economists were expecting an increase of about +0.8%. They are still
down -6.8% compared with a year earlier. Spending on public-sector and private
projects increased in March. Spending on private housing projects rose +2.2%.
Spending on public projects rose +0.1%. By itself, the data suggests an upward
revision to first quarter GDP. The government estimated no change in construction
spending in its initial estimate of first quarter growth. The economy only grew
at a +1.8% pace in the first quarter. Spending on nonresidential buildings was
one of the weakest sectors in the report, falling at a -21.7% rate.
Friday, April 29, 2011 4:03 p.m est.
The market continued its climb into an extreme overbought condition
this morning as it has been up strongly this week with the Nasdaq gunning for
its eighth straight up day! The Dow made highs of +70.00 points, S&P 500
+4.00 points but once again the Nasdaq only saw +5.00 points. The final hour
was a bit different as profit taking set in a bit but with volume this low it
was no wonder! This isn’t June is it, did I miss spring,,,, volume is
even lower than it was the day after Christmas yet the market keeps climbing!!
I guess the question will be if the old adage of “sell in May and go away”
will come into play considering how overbought the market is and how fast it
has gone up. April saw an average of +3% for the month and up to now its up
about +8% for the year. With a gain of +3% in one month you can see how straight
up this past month has been so a correction/consolidation should be at hand.
At the close the Dow was up by +47.00 points to 12,810.00, S&P
500 +3.00 points to about 1364.00, S&P 100 +2.00 points to 608.00 and the
Nasdaq Composite up +1.00 points to about 2874.00. Oil rallied again today up
by about +.80 to be around the $114.00 level.
Consumer spending looked healthier than had earlier been feared despite
the higher costs of gas it was reported today. The March data showed consumer
spending in current dollar terms rose +0.6%. roughly in line with expectations
and consumer spending in January and February was revised higher. Spending in
February rose a revised +0.9% compared with the prior estimate of a +0.7% gain.
Consumer spending in January rose a revised +0.5%, compared with a +0.3% increase.
Personal income rose +0.5% in March, above expectations of a +0.3% gain.
The Chicago purchasing managers index, a barometer of business trends,
fell to 67.6% in April from 70.6% in March. Economists had forecast a reading
of 68%. Two months ago the index reached a 22-year high. The prices paid component
fell to 81.8% from 83.4%, while new orders dropped to 66.3% from 74.5%. Any
reading above 50% means that more companies are expanding than contracting.
The Chicago PMI is the last major regional index released before the national
Institute for Supply Management's manufacturing index.
A gauge of Consumer Sentiment rose in April to 69.8% from 67.5% in
March, according to the Thomson Reuters/University of Michigan survey. Economists
had expected a final April reading of 70%, while a preliminary monthly estimate
for sentiment had pegged the level at 69.6%. Sentiment had really fallen in
March on concern about gas and food prices. Meanwhile, one-year inflation expectations
remained at 4.6%, the survey showed. The current-conditions gauge in the final
sentiment report for April remained at 82.5%, while the expectations component
increased to 61.6% from 57.9%.
Thursday, April 28, 2011 4:03 p.m est.
The market started the day flat but turned around early on because
the new watch word “transitory” lit up the stage with everyone calling
everything “transitory”! I think this word is going to be bigger
than Allan Greenspan’s “irrational exuberance” statement.
The Dow made highs of +50.00 points, S&P 500 +4.00 points but the Nasdaq
saw only +5.00 points and turned down for most of the day. As the day wore on
volume became lower and lower but the market remained about the same. Although
I can’t confirm it something isn’t feeling right about this whole
move. The market has the feel that the ladder is getting shakier and shakier
the higher it goes and one day its going fall with a thud! Of course the final
hour saw some more buying and new highs were made with the Dow up +80.00 points,
S&P 500 +6.00 points and the Nasdaq +5.00 points in the final hour. Another
reason we may be seeing the market rally this week is that we’re moving
into month end and tomorrow is the last day of the month so we may not see much
downside.
At the close the Dow was up by +72.00 points to 12,763.00, S&P
500 +5.00 points to about 1360.00, S&P 100 +2.00 points to 607.00 and the
Nasdaq Composite up +3.00 points to about 2873.00. Oil rallied hard early on
almost hitting $115 per barrel but then it sold off after it was announced that
a few fund managers were reducing their exposure. In the end it closed up by
about +.10 to be around the $113.00 level.
We may actually be nearing a top in oil as it was up strongly today
but lost all of its gains in the end and yesterday was mixed. Supply rose, according
to the inventory report I talked about yesterday and originally that moved prices
lower but after Fed Chief, Ben Bernanke held his press conference, oil prices
rose, as traders interpreted his remarks about China and emerging markets driving
up oil demand as bullish. However, this morning, Exxon missed its revenue expectations
even though gas is selling at $5 at the pump in some places. Oil service stocks
are headed lower for some reason and one of them that is really taking a hit
is the breakdown in shares of Transocean shares, with no real news reason. So
now you have Exxon missing its revenue target and the oil sector headed lower
which is generally an early warning sign. Then today as I mentioned above fund
managers are starting to reduce their exposure to oil, what's next?
There are other signs that could be headwinds also as the Drudge Report
is blaring dramatic headlines about the price of oil. One that is interesting
is that gas prices, at the pump, have risen for 35 straight days and then there’s
the fact that the Justice Department is going to investigate oil prices is another
sign that things may be getting a bit much for the crude rally. The Justice
Department almost never investigates anything proactively. These are the guys
that began investigating Ponzi schemes on Wall Street after Bernard Madoff confessed.
Madoff and others like him had been cheating the public for years while the
Justice Department ignored the warnings of would be whistle blowers. Crude is
having trouble rising above $113.00 with $115 becoming an important price point.
That range, somewhere between $110-$115 likely holds the key. Maybe Bernanke
was right, it is time for transitory, err I mean transition to lower prices!
The economy really slowed down in the first quarter with Real Gross
Domestic Product rose at a +1.8% annualized rate in the first quarter, down
from a +3.1% increase in the fourth quarter. The big story for the first quarter
was the slowdown in consumer spending. Real estate and government sectors also
hurt growth. At the same time as the economy slowed, inflation accelerated with
the personal consumption expenditure index rose +3.8% in the fourth quarter,
the fastest pace since the third quarter of 2008. The core personal consumption
index rose +1.5%, the fastest since the fourth quarter of 2009. Don’t
forget though this is just transitory the economy is really picking up! Fed
chief Ben Bernanke said it himself yesterday when he stated that all of the
stimulus he is pumping in has helped the stockmarket to go up and that helps
everyone. Hmmmm, let me think about that one.....
Jobless claims were up by +25,000 last week now to 429,000, the highest
level in three months. Economists had expected claims to decline to seasonally
adjusted 395,000 from the prior week's revised level of 404,000. The average
of new claims over the past four weeks, meanwhile, rose by +9,250 to 408,500,
the highest level since mid-February. Continuing claims fell by -68,000 to a
seasonally adjusted 3.64 million and 8.19 million people received some kind
of state or federal benefits, down -112,578 from the prior week. This to is
transitory but it seems to be going in the wrong direction again after it transitoried
back down for awhile! See I can create trick words too!
Wednesday, April 27, 2011 4:03 p.m est.
The market opened a little higher this morning with the Nasdaq Composite
gunning for its sixth day up in a row. After an oil inventories reported revealed
a huge increase, oil fell -$1.40 pretty quick and this pulled the rest of the
market down, with the Dow seeing -10.00 points, S&P 500 -4.00 points and
the Nasdaq Composite -10.00 points. Of course when the Fed released its decision
on interest rates with nothing new to say except that inflation actually is
picking up, the market turned around and the Dow made highs of +50.00 points,
S&P 500 +4.00 points and the Nasdaq +10.00 points.
At noon today the Fed announced it would keep rates at a target range
of 0% to 0.25% and said its $600 billion bond-buying program would end as scheduled
on June 30th. The Fed made only a few changes to the language of the policy
statement it issued in March and did not give guidance on the outlook of policy
after the end of quantitative easing. They repeated that rates are likely to
stay low for an “extended period.”
The Fed gave itself flexibility by adding that it would “adjust”
its holdings of treasuries and mortgage-backed securities as needed.
After Fed chief Bernanke did his first ever question and answer with reporters,
the market rallied more as he dodged around every question. For that matter
even the questions were weak in my view anyhow! The Dow made highs of +120.00
points, S&P 500 +11.00 points and the Nasdaq +25.00 points in the final
hour. His favorite word was “transitory” so as long as you think
inflation is transitory, recession's are transitory, gas price's transitory,
job losses transitory, weight loss transitory, weather changes transitory, even
aging transitory, everything will work out fine!!! Basically don't worry about
the future its likely transitory anyhow! In other words why worry about it now
when you can figure it out in the future. I mean come on, was the internet bubble
implosion a crisis that could have been avoided, or that little housing bubble
implosion, there’s no way that could have been avoided! Besides, wasn’t
it President Obama that said everyone should have the right to own a house!
Commodities and oil are only up almost +50% in less than a year and only +85%
in the past two, even though that's a long “transitory” time, its
still only “transitory”!! And,,,,,its only a coincidence that commodities
and oil have been going up since QE1 and 2 started!! My question is what will
the next bubble be after this one implodes, what will we “transitory”
into it!
At the close the Dow was up by +96.00 points to 12,692.00, S&P
500 +8.00 points to about 1357.00, S&P 100 +4.00 points to 605.00 and the
Nasdaq Composite up +22.00 points to about 2870.00. Oil was down early on but
came back to close up by about +.50 to 113.00.
Orders for Durable Goods rose +2.5% in March, marking the third straight
increase, led by higher demand for transportation equipment, computers and defense-related
products. Orders for February were also revised to show a +0.7% increase instead
of an originally reported decline. Economists had expected orders to rise by
+3.0%. Factoring out the volatile transportation sector, orders rose a smaller
+1.3%. Shipments of core capital equipment goods, which the government uses
to help calculate gross domestic product were up +2.2% in March after just a
+0.4% gain in February and a -2.5% decline in January.
Tuesday, April 26, 2011 4:03 p.m est.
Interesting notes:
According to Rasmussen: "Ten percent (10%) of adults rate the economy as
good or excellent while 57% say poor." Although this is a daily poll, it
does give a "right now" picture of what people are thinking. Rasmussen.com
added: "The Rasmussen Consumer Index, which measures the economic confidence
of consumers on a daily basis, fell four points on Sunday to 73.7%. Consumer
confidence is down six points from a week ago, down eight points from a month
ago, and down seventeen points from three months ago."
The Fed is expected to "wind down" QE2. According to The
Wall Street Journal: "Federal Reserve officials on Wednesday are expected
to signal that in June they plan to end their controversial strategy of buying
$600 billion in U.S. Treasury bonds to spur the economy. That would mark a milestone
in the historic efforts by the central bank to stimulate economic growth."
One analyst describes the event as not the "start" of policy tightening
but more like the "end" of easy policy.
Yesterday the market was pretty flat and closed down a little for the
day. Today it made up for it because of decent earnings reports but volume continues
to get worse than better. The Dow made highs around lunch and then drifted for
the rest of the day up +130.00 points, S&P 500 +15.00 points and the Nasdaq
+35.00 points.
At the close the Dow was up by +115.00 points to 12,595.00, S&P
500 +12.00 points to about 1347.00, S&P 100 +5.00 points to 601.00 and the
Nasdaq Composite up +22.00 points to about 2848.00. Oil has mostly been flat
the past couple of days closing down by about -.40 to 112.00.
Since 1975, when the market was positive through the Easter holiday,
it continued higher for the rest of the year an incredible 20 out of 21 times,
or 95%. The only time it fell was in 1987, the year of the Black Monday stock
market crash. Also interesting is the fact that the market averages a 10% return
for the rest of the year. Looking at the shorter term buyers seem to take an
extra day off as the following Monday is usually down and this year was no exception
as it was down. The day after Easter is positive only 39% of the time. Generally
the month after Easter tends to be only slightly bullish though which is good
for us.
The prices of single-family homes in 20 major cities fell again -1.1%
in February, according to the S&P/Case-Shiller home price index released
by Standard & Poor's and is the seventh straight monthly decline. Prices
have moved down -3.3% in the past year. Home prices fell in 19 of the 20 metropolitan
areas tracked by Case-Shiller in February compared with January. Detroit was
the only market where home prices rose in February. Over the past year, only
Washington, D.C., has seen prices advance. The 20-city index is slightly above
its April 2009 trough, meaning that home prices have almost completely retreated
from the gains they posted from May 2009 through June 2010. Falling below the
April 2009 level would put housing in a double-dip downturn.
From its peak, the index has dropped -32.5%, S&P said. “There
is very little, if any, good news about housing. Prices continue to weaken;
trends in sales and construction are disappointing,” said David Blitzer,
chairman of the index committee at Standard & Poor’s.
Housing has had lots of problems that have created alot of problems
for the sector. On the supply side, an oversupply of distressed properties is
pushing prices down. There are also worries of a so-called “shadow inventory”
of homes that sellers and banks want to list, but are waiting for the right
moment to do so. On the demand side, many consumers are still having difficulty
qualifying for mortgages even though rates are low. Economists have said that
a healthy labor market could help, but the labor market has been struggling
as well. Some economists believe that sales may pick up in the spring if buyers
become convinced that mortgage rates are likely to rise, given talk of the Fed’s
exit from its ultra-easy monetary policy. The S&P/Case-Shiller index is
based on a three-month moving average of home prices. So the February data reflect
price data for December, January and February. This makes the index less volatile
than other house price gauges, notably from Corelogic and the Federal Housing
Finance Agency.
Consumer confidence rose in April, after a large drop in March, as
inflation expectations somewhat eased, according to data released by the Conference
Board. The confidence index hit 65.4% in April, compared with an upwardly revised
63.8% in March. Consumers 12-month inflation expectations declined to 6.3% in
April from 6.7% in March however. "Consumers' short-term outlook improved
slightly," said Lynn Franco, director of the Conference Board's consumer
research center. " Although confidence remains weak, consumers' assessment
of current conditions gained ground for the seventh straight month, a sign that
the economic recovery continues. " Economists polled by MarketWatch had
expected an April reading of 65. The Conference Board's index helps analysts
compare fluctuations in confidence, with a reading of 100% for the base year
of 1985. Generally when the economy is growing at a good clip, confidence readings
are at 90% and above.
Yesterday it was reported that Sales of new homes jumped +11.1% in
March to a seasonally adjusted annual rate of 300,000. Economists had expected
a 290,000 sales rate in March. The still poor reading, a decrease of -21.9%
from March 2010 levels came as sales in the Northeast rebounded particularly
strongly, which may reflect that February's worst-ever showing was in part caused
by winter storms. The February data also was revised higher, to 270,000 from
an initial 250,000, though that is still a record low. Median sales prices rose
+2.9% to $213,800.
Thursday, April 21, 2011 4:03 p.m est.
It has just been reported that gas pumping levels are now down -2%
and is the first time in a quite a while that this has occurred and is an indication
that spending changes are on the way. Along with that casual dining is also
pretty much flat. These are always the first to go and indicate the first real
change in the behavior of consumers.
The market started the day higher after Apple came out with great earnings
last night on great sales of Iphones. Interestingly Ipad sales were much less
then expected but analysts quickly said that it was due to supply problems but
that didn’t seem to be the case with the phone. Some however are saying
that people just quit buying the old one as they waited for the new one to come
out. The Dow made highs midday of +55.00 points, S&P 500 +8.00 points and
the Nasdaq +20.00 points.
Volume was the worst of the day but it is a holiday shortened week.
At the close the Dow was up by +52.00 points to 12,505.00, S&P 500 +7.00
points to about 1337.00, S&P 100 +3.00 points to 596.00 and the Nasdaq Composite
up +18.00 points to about 2820.00. Oil moved in both directions today but little
changed in either direction but finished the week up by almost +1.00 to 112.25.
Jobless claims fell in the latest week still remaining above the key
400,000 level for the second straight week suggesting that improvement in the
labor market has stalled.
The number of people filing for state unemployment benefits for the
first time fell -13,000 to a seasonally adjusted 403,000 last week. This is
the first time that claims have been above 400,000 for two weeks since late
January and the decline only partially reverses the big jump in claims in the
prior week. Claims in the previous week were revised to an increase of +31,000
to 416,000, compared with the initial estimate of an increase of +27,000 to
412,000 which is even worse. If the economy is creating so many new jobs, you
would think applications for unemployment benefits would be well below 400,000
for a long time. Initial claims are below the 448,000 per week average in the
second half of 2010 but not by that much and especially in recent weeks. The
average of new claims over the past four weeks, meanwhile, rose by +2,250 to
399,000. and is the highest level since the week ended February 19th. Continuing
claims fell by -7,000 to a seasonally adjusted 3.70 million, the lowest number
since September 2008 which is good but analysts say it is because people are
running out of insurance not getting new jobs. The four-week average of continuing
claims dropped -17,500 to stand at 3.72 million, the lowest level since October
2008. Before the recession, the employed were 146.6 million people. As of March,
there were 139.9 million workers in the economy. The jobless rate stood at 8.8%
in March, almost double the rate before the 2007-2009 recession, despite a big
drop over the past six months.
The Philadelphia Fed's index of current activity fell to 18.5% in April
after the March reading of 43.4%, which was the highest since January 1984.
Economists had expected the gauge to fall to only move to 35.5%. Nearly all
of the survey's indicators remained positive but fell from their readings in
the previous month, the Philly Fed said.
The Leading Economic index rose +0.4% in March, signaling that business
conditions will strengthen in the near term, with "sustained" growth
through the end of the year, the Conference Board reported. Six of the 10 indicators
included in the leading economic index made positive contributions in March,
led by the interest rate spread. The largest negative contribution came from
an index of consumer expectations. Unrest in the Middle East, rising oil prices
and the Japan earthquake, may have been the reason for this though. Economists
had expected the gauge to rise +0.2% in March. February's result was revised
to a gain of +1% from a prior estimate of +0.8% growth. The LEI is a weighted
gauge of 10 indicators that are designed to signal business cycle peaks and
troughs.
Wednesday, April 20, 2011 4:03 p.m est.
The market was up strongly today after Intel reported pretty decent
earnings overnight. popped back up today because why worry about something when
you can worry about it later. The Dow made highs midday seeing +200.00 points,
S&P 500 +20.00 points and the Nasdaq +65.00 points. Volume however continues
to get worse but it may be due to the holiday on Friday so we may need to wait
to see if this is a valid rally or not. Its hard to believe that one day America
is going down the tubes due to debt and the next everything is fine and rosy.
At the close the Dow was up by +187.00 points to 12,454.00, S&P
500 +18.00 points to about 1330.00, S&P 100 +7.00 points to 593.00 and the
Nasdaq Composite up +58.00 points to about 2803.00. Oil rallied hard today up
by almost +4.00 to 111.50.
Sales of existing single-family homes and condos rebounded by +3.7%
in March to a seasonally adjusted annual rate of 5.1 million, the National Association
of Realtors reported. Economists expected sales to rebound to 5.0 million units.
Sales fell a revised -8.9% in February to 4.92 million units, up from the initial
estimate of a -9.6% drop to 4.8 million units. The median price of homes sold
was down -5.9% from last year at $159,600. Inventories of existing homes for
sale rose +1.5% to 3.55 million, representing 8.4 months supply, down from 8.5
months in February, still far to high.
Tuesday, April 19, 2011 4:03 p.m est.
The market popped back up today because why worry about something when
you can worry about it later. The Dow made higher highs each hour until the
last with the Dow seeing +80.00 points, S&P 500 +8.00 points and the Nasdaq
+15.00 points. Volume however was pathetic but that may be because it is a shortened
trading week. Intel had some pretty good earnings after the bell so we’ll
likely see an upward bias tomorrow also.
At the close the Dow was up by +65.00 points to 12,267.00, S&P
500 -+8.00 points to about 1313.00, S&P 100 +3.00 points to 586.00 and the
Nasdaq Composite up +10.00 points to about 2745.00. Oil had started the day
down about -$1.50 but it came back to close higher by +.60 to 107.78.
The start of construction on New homes rose 7.2% in March to an annual
rate of 549,000, while permits rose +11.2%. Housing starts in February were
revised up to 512,000 from an original reading of 479,000. Economists had expected
housing starts in March to climb to an annual rate of 520,000 on a seasonally
adjusted basis. Permits for new construction, viewed as a gauge of future demand,
increased to an annual rate of 594,000 from February's upwardly revised level
of 534,000. Permits for single-family homes, which account for three-quarters
of the housing market, rose +5.7% to an annual rate of 405,000 last month.
Monday, April 18, 2011 4:03 p.m est.
The market started the day on the downside after Globex futures started
falling with more talk from China that they were tightening their money supplies
and possibly raising interest rates again to curb its inflation problem. When
it was announced that S&P was downgrading America it started selling pretty
hard. Standard & Poor's cut its ratings outlook on the U.S. to negative
from stable while keeping its Triple-A rating on the world's largest economy.
"More than two years after the beginning of the recent crisis, U.S. policymakers
have still not agreed on how to reverse recent fiscal deterioration or address
longer-term fiscal pressures," said Standard & Poor's credit analyst
Nikola G. Swann. The Dow made lows early on seeing -250.00 points, S&P 500
-24.00 points and the Nasdaq -60.00 points in the first hour of trading. Of
course as the day went on it reversed and in the final hour made up half of
the losses because the Whitehouse came out and denounced it and that it means
nothing anyhow, its just political strategizing! Of course they were also able
to get Moody’s to back up them up but its still something to be looking
at considering that the Obama administration has almost doubled debt since he
took office because of his spending habits and S&P has been warning them
for about a year now.
At the close the Dow was down by -140.00 points to 12,202.00, S&P
500 -15.00 points to about 1305.00, S&P 100 -6.00 points to 582.00 and the
Nasdaq Composite down -29.00 points to about 2735.00.
It was interesting today that oil fell even though Saudi Arabia, the
world’s largest oil exporter, said it cut output on the belief that the
market is oversupplied! Saudi Arabia’s oil minister reportedly said the
nation slashed its oil output by about -800,000 barrels a day in March, due
to oversupply. Saudi Oil Minister Ali al-Naimi said that April production was
expected to rise slightly from March levels, according to the reports. Last
month, Saudi Arabia’s output reached 8.292 million barrels a day, down
from 9.125 million in February, the reports said. Some major oil-consuming nations
had hoped Saudi output could help send oil prices lower. What’s interesting
though is that oil was down hard today after this news came out. It seems that
traders only listen to OPEC as its no secret that there is a lot of oil sitting
out there right now and with new drilling techniques it will be around for quite
awhile. From a traders viewpoint the reason its down is that its been pushed
higher because of the hope that there would be more people driving this summer
but that is obviously not the case when you see the economy limping along. A
top rated analyst said that oil is very near a top and that by the July 4th
long weekend gas could be down -.30 to -.40 cents a gallon as oil moves back
below $100 per barrel. Oil finished the day down -$2.50 to about $107.00.
The National Association of Home Builders/Wells Fargo Housing Market
Index fell by a point to 16% in April, the level it's been at for five of the
last six months. Economists had expected it to stay at 17%. "While builders
in some areas are starting to see a pickup in traffic of prospective home buyers,
many consumers remain skittish about the health of the housing market and overall
economy, particularly in view of recent legislative and regulatory proposals
that could make it much harder to get a mortgage," noted NAHB Chairman
Bob Nielsen. The seasonally adjusted index is calculated so any number over
50% indicates that more builders view sales conditions as good than poor, which
hasn't been the case in five years.
Friday, April 15, 2011 4:03 p.m est.
Today the market was up because it generally is on expiration which
you could see as economic data revealed inflation continues to rise which isn’t
good news. Either way we finished this expiration with full profits which always
feels good going into the weekend! The Dow made highs of +85.00 points, S&P
500 +8.00 points and the Nasdaq +10.00 points. At the close the Dow was up by
+57.00 points to 12,341.00, S&P 500 +5.00 points to about 1320.00, S&P
100 +1.00 points to 589.00 and the Nasdaq Composite +5.00 points to about 2765.00.
Oil was up again approaching recent highs about +$1.40 to about $110.00.
Prices paid by consumers rose sharply again in March, mainly because
of higher gas and food prices, according to the latest data. The consumer price
index rose +0.5% last month, while the core rate rose a lesser +0.1% because
the Fed says that food and energy are volatile but that seems false because
when you look at the prices the past 10-years all I see is them rising! Economists
had expected CPI, which tracks inflation at the retail level, to rise by +0.5%
overall and +0.2% on a core basis. Prices have climbed +2.7% over the past 12
months, the biggest increase since December 2009. As recently as November the
12-month inflation rate was just +1.1%. Prices in the 17-nation euro zone also
have climbed 2.7% over the past 12 months while China reported a +5.4% jump,
separate reports over the last 12 hours have showed, demonstrating the global
nature of the rising prices. Rising consumer costs have more than offset wage
increases and a one-year reduction in the worker payroll tax. Since consumers
have to pay more for basic necessities, they have less money to spend on variety
of other non-essential goods and services which means they cut back on discretionary
spending, which could hurt the recovery or move it back into a recession given
the primary role consumption plays in the growth of the economy. The only positive
thing is that the price of most goods other than food and energy, such as electronics
or motor vehicles, have not risen much.
Industrial production rose a solid +0.8% in March, with broad-based
gains across sectors, the Fed reported and was the fifth straight gain in factory
output, as manufacturing continues to lead the economy.
The increase was a modest upside surprise as economists were expecting
a +0.6% gain. In the first quarter, industrial output rose at a +6% annual rate,
faster than the +3.2% rate in the final three months of 2010. Most indicators
of the manufacturing economy are at high levels. Mid-week, the Fed’s own
Beige Book survey found that manufacturing was leading the economic expansion.
Capacity utilization, a gauge of slack in the economy – jumped to 77.4%
in March from 76.9% in February and is the highest level since July 2008 but
still below the average rate of 80.4% from 1972 through 2010. Because of this
the Fed likely thinks that this space capacity is going to keep inflation subdued.
Consumer sentiment rose in April as worries about the impact of surging
gasoline prices receded slightly. The Thomson Reuters/University of Michigan
survey of consumers sentiment hit 69.6% in its preliminary reading for April,
up from 67.5% for March. The current-conditions index for April was 82.7%, up
from 82.5% in the prior month, while the future-expectations gauge was at 61.2%,
up from 57.9%. Meanwhile, inflation expectations for one year remained at 4.6%.
Business conditions for New York state-based manufacturers in April
were the best in a year as new orders surged, according to a survey of executives
released Friday.
The Empire State manufacturing survey rose for a fifth consecutive month in
April, with general business conditions increasing over four points to a reading
of 21.7%, the Fed’s Bank of New York said. Economists had expected the
number to fall to 15.5%, down from 17.5%. The new orders index for April jumped
17 points, to 22.3%, and the shipments index shot up 27 points to 28.3%, the
New York Fed said. The indexes for both prices paid and prices received rose
to their highest levels in more than a year, indicating that price increases
continued to accelerate. The report should, but probably won’t, change
the dovish view of the Fed overall.
Thursday, April 14, 2011 4:03 p.m est.
Yesterday the market was pretty boring closing mixed in the end barely
changed from the unchanged level. Today there was a bit more volatility as the
market started down pretty strongly due to poor economic data. The Dow made
lows of -110.00 points, S&P 500 -12.00 points and the Nasdaq -25.00 points
in the first few minutes of trading. It reversed midday and saw highs in the
final hour with the Dow up about +40.00 points, S&P 500 +3.00 and the Nasdaq
Composite +5.00 points.
At the close the Dow was up by +14.00 points to 12,285.00, S&P
500 +.10 points to about 1315.00, S&P 100 -.40 points to 587.00 and the
Nasdaq Composite down -1.30 points to about 2760.00. Oil has been taking some
big hits this week but was up again today with a gain of about +$1.30 to about
$108.45.
Tomorrow is expiration and its looking like we’ll see full profits
on both sides which is always nice. The way things are shaping up it looks like
we may see more volatility for the May expiration cycle for sure as were one
more month closer to QE2 ending, oil is continuing higher, driving gas prices
up for the past 23 days, now nearing the $4 mark for average prices and it appears
that the “recovery” is starting to drag its heals! If earnings don’t
beat on the upside we’ll see volatility for sure. Google just released
theirs and the stock is off -$25 in after hours as it didn’t make estimates.
So now we have Alcoa and Google disappointing and bank earnings so far average
so things could get interesting if they don’t starting upping expectations
for future revenues!
Wholesale prices rose a seasonally adjusted +0.7% in March, continuing
an upward move. The core rate, which isn’t nearly as good for pointing
out inflation because it excludes food and energy, something no one really needs,
rose a smaller +0.3%. Economists had predicted a +0.8 % increase in overall
producer prices and a +0.2% rise in the core rate. Wholesale prices have risen
a measly +5.8% over the past year so why are so many people up in arms. Energy
costs rose +2.6%, but wholesale food prices fell -0.2%, the first decline in
seven months. Core intermediate prices, viewed as a leading indicator of inflation,
jumped +0.9% last month. Jobless Claims were up by +27,000 to a seasonally adjusted
412,000 last week. Economists had expected new applications for jobless benefits
to drop to 380,000. The average of new claims over the past four weeks, meanwhile,
rose by +5,500 to 395,750. Continuing Claims fell by -58,000 to 3.68 million.
Altogether, 8.52 million people received some kind of state or federal benefits
last week, little changed from the prior week.
Yesterday it was reported that Sales at Retailers increased +0.4% in
March to a seasonally adjusted $396.3 billion and is the ninth straight increase
in retail sales but the smallest gain since the string started last July. Sales
rose an upwardly revised +1.1% in February. Details of the March report were
weak as much of the sales gain came from by higher gas prices. Excluding gasoline,
retail sales rose only +0.1%. Ahead of the report, economists expected total
sales to rise +0.5%. Excluding the -1.7% drop in motor vehicle sales, retail
sales rose +0.8%. Economists had expected a +0.7% increase. Core sales, excluding
autos, gasoline and building materials, rose +0.4% in March after a +1.1% gain
in Feb.
Tuesday, April 12, 2011 4:03 p.m est.
The market started the day under pressure as Alcoa’s earnings
report came in a little worse than expected although they beat per share estimates.
What seemed to hurt the market the worst was the downgrades of the overall quarter
after poor trade data came out lower than expected. The Dow saw lows of -150.00
points, S&P 500 -15.00 points and the Nasdaq Composite -40.00 points. It
came back a bit at the close but was still down at the close.
At the close the Dow was down by -118.00 points to 12,264.00, S&P
500 -10.00 points to about 1314.00, S&P 100 -5.00 points to 588.00 and the
Nasdaq Composite down -27.00 points to about 2745.00. Oil took another huge
hit today as it appeared that the economy was slowing even more than expected.
It closed down another -$3.70 to about $106.25. Another factor may have been
that there was no new news about the Middle east over the weekend.
As were now entering earnings season it is interesting to look at some
statistically proven methods of evaluating where the market is according to
its price/earnings ratio as the old standards seem to not work as well anymore
because analysts have p/e ratios much less then they really are. One way that
has been very accurate is a method professor Robert Shiller invented in his
book, “Irrational Exuberance” that reveals that there have been
only four other occasions over the last century when equity valuations were
as high as they are now. According to the Yale University professor, this modified
P/E has a different denominator than the current earnings per share. It is now
based on the average inflation-adjusted earnings over the trailing 10 years.
This modified ratio which is sometimes called P/E10, or CAPE (for Cyclically
Adjusted Price Earnings ratio) has a much better forecasting record than the
simple P/E.
According to Shiller, the CAPE currently is at 23.5, or some 43% higher
than the CAPE’s long-term historical average. The four previous occasions
over the last 100 years that saw the CAPE as high as they are now were in:
1. The late 1920s, right before the 1929 stock market crash.
2. The mid-1960s, prior to the 16-year period in which the Dow went nowhere
in nominal terms and was decimated in inflation-adjusted terms.
3. The late 1990s, just prior to the popping of the internet bubble.
4. The period leading up to the October 2007 stock market high, just prior to
the supposed “great recession” and associated credit crunch. Of
course these are only four events but it seems to be very well timed!! One thing
for sure, the market has to currently be fairly valued, not undervalued as many
analysts think because of low interest rates. Valuations can remain high for
some time before they come back down though. The CAPE at the height of the Internet
bubble in early 2000 was above 40, for example and above 30 just prior to the
1929 stock market crash. Compared to those two lofty levels, the current CAPE
might suggest that the bull market still has room to go but its also likely
that it means were going to see more volatility occur the higher we go which
is perfect for our trading methods!
The prices paid for stuff imported jumped +2.7% in March, the biggest
increase in nearly two years, as fuel and food costs accelerated. Economists
had expected import prices to climb +2% last month. The increase in import prices
in February was left unchanged at +1.4%. Import prices have risen more than
+1% in each of the past six months and they have climbed +9.7% from March 2010
to March 2011, marking the largest 12-month increase since April 2010. Excluding
fuel, import prices still rose a sharp +0.6% in March, spurred by the biggest
increase in the cost of food, beverages and feedstuffs in nearly 17 years! The
price of goods exported by the U.S, meanwhile, rose +1.5% in March, but heh
don’t forget there isn’t any inflation out there according to Fed
chief Bernanke!
The trade deficit narrowed by -2.6% in February to $45.8 billion and
was above the forecast of economists of a deficit of $42.9 billion. Both imports
and exports declined in February. The deficit with China widened to $18.8 billion
in compared with $16.5 billion in the same month last year. The government also
revised the deficit in January to $47 billion from $46.3 billion. This caused
several economists to mark down their already-battered estimates for first-quarter
growth. Morgan Stanley slashed their estimate to +1.5% from +1.9% after what
they called "a very weak report." RBS Securities cut their estimates
to +1.7% from +2%, and adding that while some of the cooling reflects special
factors, "the combination of slowing growth and rising prices puts the
Fed in an increasingly uncomfortable position." RDQ Economics, which is
waiting until Wednesday's retail sales report to adjust their numbers, said
"the quarter is looking very soft from the expenditure side."
Monday, April 11, 2011 4:03 p.m est.
Once again the market started the day higher with the Dow seeing highs
of +65.00 points, S&P 500 +6.00 points and the Nasdaq Composite +15.00 points
but weak volume, dollar and oil reversals seemed to get people taking profits
and the final hour saw the Dow make lows of -30.00 points, S&P 500 -7.00
points and the Nasdaq -25.00 points. It reversed before the close and the market
ended up mixed.
At the close the Dow was up by +1.00 points to 12,381.00, S&P 500
-4.00 points to about 1324.00, S&P 100 -2.00 points to 593.00 and the Nasdaq
Composite down -9.00 points to about 2771.00. Oil got clobbered today down a
strong -$3.40 to about $109.45 because there was no new news about the Middle
east over the weekend.
This is an expiration traded week and so far its looking like we’ll see
full profits all around but there are still four trading left so we’ll
be watching closely. Volatility is likely to be stronger this week as we have
seen a pretty good rally since March’s expiration.
Friday, April 8, 2011 4:03 p.m est.
It was an interesting day in the market as oil was rallying hard and
the government was still fighting about the budget yet it started the day higher
with the Dow up by +45.00 points, S&P 500 +7.00 points and the Nasdaq Composite
+15.00 points. It didn’t seem quite right though and when oil really took
off over +$2.00 and it looked like the government was going to shut down, selling
started and the Dow made lows of -100.00 points, S&P 500 -11.00 points and
the Nasdaq -30.00 points going into the final hour. Of course it bounced back
in the final hour to cut losses but was unable to make it back into the green.
At the close the Dow was down by -29.00 points to 12,380.00, S&P
500 -5.00 points to about 1328.00, S&P 100 -2.00 points to 594.00 and the
Nasdaq Composite down -16.00 points to about 2780.00. Oil rallied strongly today
up about +$2.30 to about $112.60 so we can say that were in blowoff mode now
as it has moved so quickly higher from the $90 level just a few weeks ago and
is now incredibly overbought. This is going to be very interesting as there
is so much oil out there and Libya only accounts for 2% of world supply and
it was just reported this morning that even with all of the fighting amongst
the oil wells, the rebel fighters have actually just sold 1 million barrels
to help with arms!
Inventories at Wholesalers rose +1% in February, matching the downwardly
revised +1% gain in January. Sales of wholesalers fell -0.8% in February, while
the inventory-to-sales ratio was 1.16.
Thursday, April 7, 2011 4:03 p.m est.
Interesting news; According to The Wall Street Journal: Portugal is
"Running out of money and paralyzed by a political crisis, Portugal said
it would ask the European Union for a financial bailout—setting up a crucial
test of the bloc's emboldened efforts to contain its sovereign-debt crisis."
The bailout figure is set at 129.8 billion Euros. The Wall Street Journal added;
"A European Union and International Monetary Fund bailout package for Portugal
could total as much as $128.98 billion, said a senior minister from a euro-zone
country."
The market opened flat but as it seems to be walking a tightrope lately
the mere mention that Japan had a 7.1 earthquake saw the Dow make quick lows
of -100.00 points, S&P 500 -9.00 points and the Nasdaq -20.00 points. When
it was confirmed that it was just a “normal” quake and the tsunami
was only 3 feet high the market came back again. It almost came all the way
back before falling back again.
At the close the Dow was up by -19.00 points to 12,407.00, S&P
500 -2.00 points to about 1333.00, S&P 100 -.70 points to 596.00 and the
Nasdaq Composite down -4.00 points to about 2796.00. Oil was down early on but
speculation took it up pretty hard closing up about +$1.50 to about $110.30.
The interesting thing about that is that oil service stocks have fallen two
days in a row now possibly indicating the top may be nearing. This could make
sense because according to the Energy Information Administration, gas consumption
in the United States last January was at its lowest levels since January of
2001!
You would think that the Portugal problem, the European Union raising
rates again, Middle East problems pushing oil near $110 and the government less
than two days away from shutting down,,,,,again,,,, would be affecting the market
but it continues its slow upward movement on dwindling volume but maybe there
is something happening that might create some volatility. According to CNBC:
"the bears are simply done fighting the tape." The conclusion is based
on the numbers out of the sentiment survey produced weekly by Investors Intelligence,
which polls newsletter writers. According to CNBC the figures "collapsed
to just 15.7% of those surveyed from a 23.1% part of the pie just one week ago"
and "That -32% drop is the biggest in a single week since a -37% switchover
in 2003." There are now 57% bulls and 15.7% bears and if you take those
figures and work the formula of Bulls/Bulls + Bears, it comes out to 78.4% bulls,
which means there is a bit too much bullishness. The ratio of Bulls/Bulls +
Bears was introduced by Martin Zweig in his book "Winning on Wall Street."
Any time that ratio rose above 70% Zweig called it a "sell signal."
It was great in the 80’s and still is interesting information considering
how it seems the market is ignoring all of the bad news out there.
Jobless Claims fell by -10,000 to a seasonally adjusted 382,000. Economists
had expected benefits to drop to 385,000. The average of new claims over the
past four weeks, meanwhile, declined by -5,750 to 389,500. Continuing claims
fell by -9,000 to 3.72 million, the lowest level since October 2008. Altogether,
8.52 million people received some kind of state or federal benefit, down nearly
246,000 from the prior week.
Tuesday, April 5, 2011 4:03 p.m est.
Another boring day, I think that I won’t even report tomorrow
unless we have some decent movement! This is great for our profits but incredibly
tiring! The Dow saw early lows of -50.00 points, S&P 500 -3.00 points and
the Nasdaq -5.00 points but it turned around midday to see the Dow at highs
of +40.00 points, S&P 500 +5.00 points and the Nasdaq up +20.00 points.
In the end the market sold off the last hour to be almost unchanged on the day.
The Dow was down by -6.00 points to 12,394.00, S&P 500 -.25 points
to about 1332.60, S&P 100 -.25 points to 595.00 and the Nasdaq Composite
down +2.40 points to about 2791.00. Oil was also mostly flat closing down about
-$.13 to about $108.34.
The Fed began its March 15th meeting debating the possible course of
monetary policy after the $600 billion bond-buying program ends in June, according
to the minutes of the meeting released at 2:00 p.m est. A few Fed members said
that economic conditions might unfold in a way that would warrant the launch
of an exit plan this year but a few others noted that the Fed's ultra-low monetary
policy may be appropriate "beyond 2011." There was a lengthy discussion
of the prospects of inflation in the wake of the sharp increase in oil and food
prices. In the end, several Fed officials said that their forecasts of inflation
had "shifted somewhat to the upside." Economic growth appeared to
be on "firmer footing," the Fed officials said which indicates that
maybe QE2 will end in June after all.
Service industries in the U.S. grew less than forecast in March, showing
higher fuel costs are raising concern sales will slow. The Institute for Supply
Management index of non- manufacturing companies fell to 57.3% from 59.7% in
February, lower than the 59.5% forecast of economists. Readings greater than
50% still signal growth though.
Unrest in the Arab world has caused gasoline prices to climb to the
highest level in more than two years, representing a problem for consumers buying,
while the aftermath of the disaster in Japan may disrupt supplies to American
factories. The group’s index of the industry, which accounts for about
90% of the economy, averaged 56.1% in the five years to December 2007, when
the last recession began. Last month’s drop in the services index was
led by a 7- point drop in the business activity component, that measure’s
biggest decrease since November 2008. The gauge is a reflection of sentiment
among purchasers, according to economists. The ISM’s measure of new orders
at service providers decreased to 64.1% from 64.4% in February. The group’s
employment gauge dropped to 53.7% from 55.6% a month earlier which is bad news
but the index of prices paid declined to 72.1% from 73.3%.
Monday, April 4, 2011 4:03 p.m est.
It was a pretty quiet start to the week with volume being incredibly
low. The Dow saw early highs of +30.00 points, S&P 500 +4.00 points and
the Nasdaq up +15.00 points but as the day went on it ran out of steam with
the Dow seeing lows of -10.00 points, S&P 500 -4.00 points and the Nasdaq
-15.00.
In the end it came back once again so at the close the Dow was up by
+23.00 points to 12,400.00, S&P 500 +.50 points to about 1333.00, S&P
100 +.30 points to 595.00 and the Nasdaq Composite down -.40 points to about
2789.00. Oil was also mostly flat closing up about +$.34 to about $108.28.
The flatness that we saw today may be what we see for a few more months
as the market consolidates its recent strong gains. Last Thursday was the final
day of the 1st quarter. The market had the best first quarter in over 10 years
with it up about +5.5% and that was despite March being flat. Spring trading
or April tends to be one of the most up months of the year anyway with the last
five all being up and history indicates that after a +5% or more first-quarter
gain the year overall has seen double digit gains. The 11 previous times when
the first quarter was up +5% or more, there was only one time the market lost
ground over the rest of the year and that was because of the 1987 October market
crash. Of course that doesn’t mean we won’t see corrections like
the recent one or one that may occur sooner than later as the market is getting
quite overbought, but unless there is some surprise sitting out there it should
be a decent year of trading for our style of trading to year end as we slowly
chop higher and higher to year end!
Friday, April 1, 2011 4:03 p.m est.
The rally today was interesting but it wasn’t because of the
employment report this morning as it looked good but underneath the numbers
you see that employment is barely making ground. The thing that started the
rally was that Globex futures moved up on news that the Nasdaq said it is putting
in a bid to buy the NYSE taking it away from Germany. The offer is the latest
development in the global battle for dominance of the exchange industry going
on between the world’s top stock exchanges. It is also a determined attempt
to keep the NYSE the worlds top financial destination at a time of “historic
change,” as Nasdaq Chief Executive Robert Greifeld said in a statement.
The Dow saw highs of +110.00 points, S&P 500 +13.00 points and the Nasdaq
+25.00 points. The final hour saw the market pull back closing well off of its
highs.
At the close the Dow was up by +57.00 points to the 12377.00 level,
S&P 500 +7.00 points to about 1332.00, S&P 100 +2.00 points to 595.00
and the Nasdaq Composite +9.00 points to about 2790.00. Oil was up again to
finish the day up strongly about +$1.22 to close around the $108.00 level.
Oil also continued its rally today but heh hey we don’t need
to worry about that! I just came from a trip to the Oregon coast where I saw
the average price of gas about $3.70 which is high but when your paying an average
$5.72 cents in Canada and the Canadian dollar is now on par or even stronger
than the American, it still seems cheap. Analysts say that little will change
until gas is over $4.00 but I personally think it won’t make a difference
till it hits $5.00! Anyhow, inflation is on the rise, the weekly national average
gas price showed the highest price ever during the month of March and the seventh
consecutive increase this week, according to the Department of Energy. The funny
thing is that the price of oil is so overblown its unbelievable. Analysts say
that the past $20 rally is all because of Libya who is only 2% of the world
supply and other Saudi countries have picked up the slack. Besides that since
the recession began America has moved from using 11 million barrels a day down
to 9.3 so they say this move is all about speculation and fear that never seems
to materialize. Analysts say with the amount of oil out there the price should
be $30 to $50!
Nonetheless this is going to make for an interesting summer in trading
as gas usually rises in the summer for drivers and retail is also showing signs
of increasing prices or lowering amounts as I pointed out yesterday. Then when
you hear that Walmart is saying that consumers face "serious" inflation
in the months ahead for clothing, food and other products, it makes you nervous.
Inflation is "going to be serious," Wal-Mart U.S. CEO Bill Simon said.
"We're seeing cost increases starting to come through at a pretty rapid
rate." With the Fed ending QE2 in June and a few Fed officials making comments
interest rates may be on the rise sooner than later, we could be approaching
the end of this rally! As we approach old highs the question will be if we see
a new high or just a retest.
Employment came in stronger than the +185,000 increase expected by
economists today hitting the +216,000 level while the unemployment rate fell
to a seasonally adjusted 8.8% from 8.9% in February, according to a separate
survey of 60,000 households. This is the lowest unemployment rate since March
2009. According to the survey of 400,000 business establishments, private-sector
payrolls increased by 230,000 jobs after rising by 240,000 in February, marking
the first time that private-sector job gains have been over 200,000 for two
straight months in five years. Economists had been expecting the jobless rate
to inch higher to 9%. There was only a small cumulative +7,000 upward revision
to payrolls count in January and February.
The rate has declined sharply from 9.8% last November. Unemployment
dropped by -131,000 to 13.5 million for March but these were mostly people that
fell off the board, while employment rose by +291,000 to 139.9 million. An alternate
measure of employment, which includes discouraged workers and those forced to
work part-time because of the weak economy, fell to 15.7% from 15.9% but is
still incredibly high indicating that this months gains aren’t really
that great after all. Thankfully we saw an increase in employment this month
but at this pace we won’t see full employment until 2019!
Government employment fell by -14,000 in March and was the fifth straight
monthly decline. Local governments have been especially hard hit, losing -416,000
jobs since the peak in September 2008. Average hourly earnings were flat at
$22.87. On a year-over-year basis, earnings were up +1.7% and is below the +2.2%
year-over-year increase in the consumer price index in February. The average
workweek was unchanged at 34.3 hours. Job growth in March was concentrated in
the service sector. Gains occurred in health care and leisure while temporary-help
services rose by +29,000. Payrolls in goods-producing industries rose by +31,000
last month, including +17,000 in manufacturing, the fifth straight increase
but manufacturing hours fell to 40.5 hours from 40.6. Factory overtime was unchanged
at 3.3 hours.
Expansion in the fast-growing manufacturing sector slowed slightly in March,
according to the Institute for Supply Management saying its manufacturing gauge
fell to 61.2% last month from 61.4% in February, which was the highest level
since May 2004. Any reading over 50 indicates more manufacturers are expanding
instead of shrinking. The manufacturing sector has now expanded 20 straight
months. Economists had forecast the index to dip to 61.3% in March. Although
the manufacturing sector remains strong, companies continue to warn about inflation
via the rising cost of raw materials. The ISM’s price index jumped 3 percentage
points to 85%, the highest level since July 2008. What’s more, 72% of
respondents said they paid more for raw materials vs. only 2% who paid less.
Four months ago, only 48% said they paid more for raw materials.
Some manufacturers said the fear of future price increases even spurred
some customers to increase orders. “While manufacturers are benefiting
from strength in new orders and production, there is significant concern with
regard to commodity prices,” said Norbert Ore, who heads the ISM survey
committee. “Many manufacturers indicate the prices they have to pay for
inputs are rising, and there is concern about the impact of higher prices on
their margins.”
The institute asks about 350 purchasing managers if their business
got better or worse over the past month. These senior executives are involved
in all sorts of decisions, including hiring, the purchase of raw materials,
the delivery of supplies, and the management of inventories. Fifteen of 18 industries
tracked by Tempe, Ariz.-based ISM expanded, led by apparel, transportation and
fabricated metals. Manufacturers of wood and basic metal products were the only
ones to contract. The decline in the March ISM largely stemmed from a drop in
new orders. That index, which is a strong indicator of future sales, fell to
63% in March from 68% the prior month. February’s reading marked the highest
level since 2004. Production, however, rose to 69.0% from 66.3%. The inventories
index, meanwhile, dropped to 47.4% from 48.8%, which is often a sign of improved
sales. Companies tend to draw down inventory in a recovery when demand for their
products is higher than they expect. Yet the backlog of orders declined to 52.5%
from 59%. Sometimes backlogs fall because companies get orders out the door
faster, but other times it’s because future demand starts to slow. Also,
the employment index slipped to 63% from 64.5% in February, when the index reached
its highest level since 1973. It’s only the fourth time in the past 10
years that the employment index has been above 60%.
Thursday, March 31, 2011 4:03 p.m est.
Yesterday the market broke with tradition and was up for the day about
+.75% instead of moving down but volume was incredibly low. Today the market
started up with the Dow seeing highs of +30.00 points, S&P 500 +2.00 points
and the Nasdaq +10.00 points. As the day went on it got quite volatile and started
selling off after Minneapolis Fed President Narayana Kocherlakota signaled the
Fed could raise interest rates, which are now close to zero, by three-quarters
of a percentage point by the end of the year and even possibly end QE2 early!
This caused the market to turn lower and the final hour saw the Dow off -40.00
points, S&P 500 -4.00 points and the Nasdaq -10.00 points.
At the close the Dow was down by -31.00 points to the 12320.00 level,
S&P 500 -2.50 points to about 1326.00, S&P 100 -2.00 points to 593.00
and the Nasdaq Composite -+5.00 points to about 2781.00. Oil was up to finish
the day pretty strong up about +$2.50 to close around the $107.00 level.
Everyone has been seeing the rising prices for food but they’re
still not anywhere near where commodity prices have been and now we may know
why: According to the New York Times, companies are essentially tricking customers
by keeping prices stable but giving them less quantity of their products. The
Times reports: "For Lisa Stauber, stretching her budget to feed her nine
children in Houston often requires careful monitoring at the store. Recently,
when she cooked her usual three boxes of pasta for a big family dinner, she
was surprised by a smaller yield, and she began to suspect something was up."
The report added: "Ms. Stauber, 33, said she began inspecting her other
purchases, aisle by aisle. Many canned vegetables dropped to 13 or 14 ounces
from 16; boxes of baby wipes went to 72 from 80; and sugar was stacked in 4-pound,
not 5-pound, bags, she said." Furthermore, The Times wrote: 'Five or so
years ago, Ms. Stauber bought 16-ounce cans of corn. Then they were 15.5 ounces,
then 14.5 ounces, and the size is still dropping. “The first time I’ve
ever seen an 11-ounce can of corn at the store was about three weeks ago, and
I was just floored,” she said. “It’s sneaky, because they
figure people won’t know.'
Jobless Claims fell by -6,000 to a seasonally-adjusted 388,000, yet
that decline occurred after claims in the prior week were revised up to 394,000
from an originally reported 382,000. Economists expected claims for last week
to end up around 380,000. The average of new claims over the past four weeks,
meanwhile, rose by +3,250 to 394,250. Claims have fallen slightly below 400,000
in six of the past eight weeks. When the economy creates lots of new jobs, applications
for jobless benefits usually, though not always, fall well below 400,000 for
an extended period. Even though claims have dropped -20% since last August,
hiring still hasn’t occurred at a pace that the decline in jobless applications
would suggest. The economy did add 192,000 jobs in February, the biggest increase
in eight months but hiring would have to increase much faster over many months
to return the unemployment rate to pre-recession levels. The jobless rate was
8.9% in February and tomorrow we will see the report on employment growth for
March. Economists forecast that there will be +185,000 jobs, with the unemployment
rate ticking up to 9.0%. Also in the latest weekly claims report, the government
said the number of workers who continue to receive state compensation decreased
by -51,000 to a seasonally adjusted 3.71 million and is the lowest level since
October 2008. Most workers who have exhausted state benefits are also eligible
for extended relief from the federal government. Altogether, 8.77 million people
received some kind of state or federal benefit last week.
New orders for Factory Goods fell by -0.1% in February. Economists
were expecting overall factory orders to rise by +0.5% in February. Shipments
of manufactured goods rose by 0.3%.
The Chicago PMI decelerated slightly to a reading of 70.6% in March
from 71.2% in February, a level still well above the 50% no-change line. Economists
had forecast a reading of 68.9%. The prices paid component climbed to 83.4%
from 81.2%, while new orders edged slightly lower to 74.5% from 75.9%. The Chicago
PMI takes on added importance as the last major regional purchasing managers
index released before the national Institute for Supply Management's manufacturing
index, though economists say the Philadelphia Fed index typically tracks more
closely with the national gauge than the Chicago reading.
Yesterday it was reported that Private-sector employment climbed +201,000
in March, according to Automatic Data Processing Inc.’s employment report
in a preview of the more closely-followed government release tomorrow. The gain
was roughly in line with economist forecasts. In February, private payrolls
rose by +208,000 jobs, down slightly from the initial estimate of a +217,000
increase.
The average monthly increase in employment over the last four months has been
211,000, which is consistent with a gradual decline in the unemployment rate.
Economists estimate the economy has to add about +125,000 jobs a month to keep
pace with population growth. Employment in the service-producing sector rose
+164,000 in March, according to ADP. Employment in the goods-producing sector
rose +37,000. The factory sector added +37,000 jobs. In March, employment gained
+102,000 among small businesses, +82,000 among medium-sized businesses and +17,000
among large businesses, according to ADP. The ADP report does not include the
government sector, where the outlook for jobs remains grim. Cities and states
are struggling with budget deficits. Many analysts are cautious about making
too much about the ADP data. Although the rise in ADP in February was close
to the overall payroll gain in February, ADP over-predicted private payroll
gains in both December and January and has also frequently underestimated the
government’s report.
Outplacement consultancy firm Challenger Gray & Christmas Inc.
also reported that planned layoffs reached just over +41,528 in March, down
39% from the prior year. The public sector accounted for 46% of all March layoffs,
Challenger said.
Tuesday, March 29, 2011 4:03 p.m est.
Here’s some interesting news that makes you understand maybe
why the housing market continues to sink in America! Banks are getting set to
fight the Dodd-Franks risk provision under the new regulations. Don’t
forget it was Barney Frank who pushed to have regulation standards lowered years
ago because “everyone should have the right to own a house!” According
to CNBC: "Bank regulators are set to hold an open meeting on Tuesday to
discuss a controversial risk-retention rule for mortgages—and its even
more controversial carve-out. Under the Dodd-Frank financial reforms, banks
are required to retain at least five percent of the risk on mortgages they securitize."
What does this mean? Banks don't want to have to make loans to qualified
buyers only they want to go after more people because there's more money in
volume. According to the report: "But now financial companies are trying
to get around the law by manipulating a carve-out for "qualified residential
mortgages." “Lawmakers punted on the definition of a qualified residential
mortgage when the law was written, charging regulators with deciding what mortgages
are safe enough to avoid the risk-retention rules. Obviously, many financial
firms would like to see an expansive definition that would reduce their need
to retain risk."
As we move into the final days of the month and quarter history has
been interesting as 8 out of the past 10 years has seen the final 4 days of
March down. Today broke that pattern so we’ll see what happens tomorrow.
It is interesting as our usually strong Mondays were interrupted yesterday.
After a strong start with the Dow seeing highs of +60.00 points, S&P 500
+7.00 points and the Nasdaq only seeing +10.00 points it turned lower and sold
off strongly in the final hour closing at the lows of the day with the Dow off
-23.00 points, S&P 500 -4.00 points and the Nasdaq -13.00 points.
Today the market was lower again to start the day as S&P lowered
its rating on Greece once again with the Dow seeing lows of -30.00 points, S&P
500 -6.00 points and the Nasdaq Composite -15.00 points. It turned up though
after some disappointing Consumer Confidence numbers but possibly because oil
service stocks turned higher along with oil. The Dow saw highs of +90.00 points,
S&P 500 +10.00 points and the Nasdaq Composite +30.00 points but once again
on lower volume.
At the close the Dow was up by +81.00 points to the 12279.00 level,
S&P 500 +9.00 points to about 1319.00, S&P 100 +4.00 points to 591.00
and the Nasdaq Composite +26.00 points to about 2757.00. Oil was also lower
yesterday and today remained under pressure as the rebels in Libya continue
to take control so oil may start flowing there once again but it turned higher
near the close to finish up about +$.80 to close around the $105.00 level.
Today it was reported that Home prices in 20 major cities fell -1%
in January, the sixth straight monthly decline, according to the Case-Shiller
home-price index released by Standard & Poor’s. Prices rose in only
one of 20 cities in January on a monthly basis: Washington, D.C. Over 12 months,
only Washington, D.C., and San Diego have seen prices advance. “The housing-market
recession is not yet over, and none of the statistics are indicating any form
of sustained recovery,” said David Blitzer, chairman of the S&P index
committee. Prices fell -3.1% year over year in January, down from a -2.4% year-over-year
drop in December. Compared with a year ago, prices were lower in 18 of the 20
cities. The 20-city index is only +1.1% above its April 2009 trough. Falling
below that level would put housing in a double-dip downturn. "At this point,
we are not too far off [from a double-dip], and that is what many analysts are
seeing with sales, starts and inventory data, too,” Blitzer said. Analysts
don’t see any near-term shift in the downward momentum in home prices.
Housing-market data continued to be terrible in February, as both existing-
and new-home sales plunged.
Economists said an enormous oversupply of distressed properties is
pushing prices down. There are also worries of a so-called “shadow inventory”
of homes that sellers and banks want to list, but are waiting for the right
moment.
Falling home prices can damage the overall economy by making Americans
cautious about spending. The S&P/Case-Shiller index is based on a three-month
moving average of home prices. So the January data reflect price data for November,
December and January. This makes the index less volatile than other government
housing-price data. Some economists see a light at the end of the tunnel. They
believe that sales may pick up in the spring if buyers become convinced that
mortgage rates are likely to rise, given talk of a Fed exit from its ultra-easy
monetary policy.
In ascending order, here’s how each of the 20 cities fared over
the past year: Phoenix, down -9.1%; Detroit, down -8.1%; Portland, down -7.8%;
Minneapolis, down -7.6%; Chicago, down -7.5%; Tampa, Fla., down -7%; Atlanta,
down -7%; Seattle, down -6.7%; Charlotte, N.C., down -4.8%; Miami, down -4.7%;
Las Vegas, down -4.4%; Cleveland, down -3.8%; New York, down -3%; Dallas, down
-2.8%; Denver, down -2.3%; Los Angeles, down -1.8%; San Francisco, down -1.7%;
Boston, down -0.6%; San Diego, up +0.1%; and Washington, D.C., up +3.6%.
Consumer confidence experienced its biggest one-month drop in over
a year, falling sharply in March with worries about rising prices and stagnant
incomes, according to the latest survey by the nonprofit Conference Board. The
board's index dropped to 63.4% last month from a downwardly revised 72% in February.
Economists expect the index to fall to 62.2% from February's initially reported
level of 70.4%. Consumer spending accounts for about two-thirds of economic
growth.
Yesterday it was reported that Real Disposable Income declined in February
as consumer prices jumped by the largest amount in 2 1/2 years. Economists said
the data show that higher prices for gasoline is starting to take some of the
steam out of the economy. The personal consumption expenditure index, which
Fed officials say is a more accurate gauge of inflation than the better-known
consumer price index, increased +0.4% on the month, the largest monthly gain
since July 2008. The core rate of inflation, which excludes food and energy
prices, rose +0.2% for the second straight month, as January’s reading
was revised higher. The last time the core rate rose by more was an +0.3% gain
in October 2009. Adjusted for inflation, after-tax incomes fell -0.1% in February,
the first drop since last September. Meanwhile, inflation-adjusted consumer
spending rose +0.3% in February after having remained unchanged in January.
Without strong income gains, workers are not going to run out and spend. A slower
pace of consumer spending is one reason that economists are cutting estimates
for growth in first-quarter gross domestic product. Many see spending rising
around a +2% annual rate in the first three months of the year, after a strong
+4% gain in the fourth quarter.
Real spending on durable goods increased +1.4% after rising +0.2% in
January. Spending on non-durable goods also increased, up +0.4%, after falling
+0.1% in January. Spending on services, which has been weak, came in flat for
February following a -0.1% decline in the previous month. Personal consumer
spending increased +0.7% last month, slightly stronger than the +0.6% gain expected
by economists. The Commerce Department’s data also showed personal income
rose +0.3%, slowing after a +1.2% jump in January. Reduced social security contributions,
a key measure in the tax pact reached by President Obama and Congressional Republicans
at the end of last year, helped spark January’s jump in personal income.
The savings rate fell to 5.8% in February from +6.1% in the prior month.
On a year-over-year basis, the PCE price index is up +1.6%, the biggest gain
since May 2010.
The comparable core rate was up +0.9%, still well below the Fed’s implicit
target of just below 2% Income from wages and salaries increased +0.3% in February.
This is the third straight month of a +0.3% increase. Income from assets, such
as dividends and interest, rose +0.4%. Income from transfer payments was flat
for the second straight month. Personal taxes increased +0.2% after jumping
+4.6% in January.
Pending home sales rose in February in all parts of the U.S. except
for the Northeast, a real estate trade group reported. The National Association
of Realtors said its index of pending home sales rose +2.1% to 90.8% in February,
the first increase in three months. Yet the index still stands 8.2% below the
year-ago level of 98.9%, when a now-expired federal tax credit boosted sales.
Pending sales fell -10.9% in the Northeast, which NAR said might be attributable
to poor weather. Pending sales rose +2.7% in the South, +4% in the Midwest and
+7% in the West. The index is based on sales contracts on existing homes. The
NAR also reports on sales of existing homes once the sales close, usually six
to eight weeks later. After today’s report from Case Shiller revealing
poor sales these numbers may change next month.
Friday, March 25, 2011 4:03 p.m est.
The market started higher once again today making it one of the strongest
weeks since November being up six of the last seven days! This has placed it
in a precarious overbought situation and with the decline in volume it makes
it look even worse. But does that matter when the Dow was straight up out of
the gate with highs of +100.00 points, S&P 500 +10.00 points and the Nasdaq
+40.00 points but as the day wore on it lost more and more steam closing with
about half of its gains.
At the close the Dow was up by +50.00 points to the 12220.00 level,
S&P 500 +4.00 points to about 1314.00, S&P 100 +2.00 points to 588.00
and the Nasdaq Composite +6.00 points to about 2743.00. Oil closed little changed
with it down about -$.20 to close around the $105.50 level.
This morning GDP growth was upwardly revised in the final quarter of
last year, still not far from before but in new territory of +3.1% but inflation
made a new all time high which isn’t good. GDP is growing in the current
quarter at a 3.0% rate, which is the consensus of economists and means that
as of the end of March, next Thursday, real GDP will be +5.5% higher than its
pre-recession peak. These data points don’t mean that all is well in the
economy, of course, or that all sectors have participated equally in the recovery.
With this revision, the government is now calculating that inflation-adjusted
GDP was, as of the end of 2010, +2.4% higher than where it stood in late 2007,
prior to the Great Recession.
Consumer sentiment fell in March to the lowest level in five months,
largely because of higher gas and food prices, according to a survey released
this morning. The consumer-sentiment index produced by Thomson Reuters and the
University of Michigan fell to 67.5% in March, from an initial reading of 68.2%
earlier in the month. Food fears ripple around the world and as more countries
put restrictions on food imports from Japan and bottled water in Tokyo is still
in short supply after a radiation scare it doesn’t make people feel to
confident. March’s decline is the 10th largest one-month drop recorded
since the index was created in the late 1970s. The index totaled 77.5% in February.
Aside from higher gas and food prices, fewer consumers expect their incomes
to rise, especially after taking inflation into account, Just one in four consumers
expect their financial position to improve in 2011. Only 38% of households,
the lowest ever recorded expect their incomes to increase this year, the survey
found. The result is likely to be lower consumer spending, with households focused
on finding discounts. A big slowdown in spending could hurt the already fragile
recovery because consumer spending accounts for about two-thirds of economic
growth. Consumers are less worried about their situation now than they are about
the near future. The current-conditions index dropped to 82.5% from 86.9% last
month, but the future-expectations component sank to 57.9% from 71.6% and was
the fifth largest drop in the index’s history.
Thursday, March 24, 2011 1:00 p.m est.
The market shot out of the gate this morning but since then has basically
remained flat with a slight upward incline so far with the Dow seeing highs
of +110.00 points, S&P 500 +14.00 points and the Nasdaq +45.00 points, but
has basically been flat. The banking sector is little changed which is interesting
though so I can't see the market making much more progress. The problem is that
there are more threatening financial problems in Portugal with financing almost
daily and the EU is also seeing rumours brew which isn't good so if you add
in Libya and Japan which is getting old now but still out there, its likely
to be held back a bit and this just may be month and quarter end adjusting.
Technically the market has also become overbought pretty quick here but hasn't
made that much headway so we'll see what happens to end the week on this pathetically
low volume way.
At the close the Dow was up by +85.00 points to the 12171.00 level,
S&P 500 +12.00 points to about 1310.00, S&P 100 +5.00 points to 586.00
and the Nasdaq Composite +38.00 points to about 2736.00. Oil was lower all day
closing down about -$.20 to close around the $105.50 level.
Orders for Durable Goods in February posted the biggest drop in fourth
months, falling -0.9% largely because of lower sales of machinery and defense-related
products. Orders without the transportation sector also fell, down -0.6%. Economists
had expected orders to rise +1.5% overall, or an even stronger +2.5% minus transportation.
Orders for January, meanwhile, were revised up to a +3.6% increase. The government
originally reported that total orders rose +3.2% in January.
Jobless Claims fell -5,000 to 382,000, with the four-week moving average
of 385,250 reaching the lowest level since July 2008 which is good news. The
claims were very close to economists estimates of 380,000, and last week's levels
were revised higher by +2,000 to 387,000. Continuing claims fell -2,000 to 3.72
million, the lowest level since Sept. 2008.
Wednesday, March 23, 2011 4:03 p.m est.
Yesterday the market was pretty flat closing a little lower as it seemed
that traders just walked away from the market as volume was non-existent. Today
it started rough with the Dow off -50.00 points, S&P 500 -10.00 points and
the Nasdaq Composite -25.00 points but that didn’t hold it back and the
final hour saw a push higher with the Dow seeing +110.00 points, S&P 500
+7.00 points and the Nasdaq +20.00 points even though oil continued its climb
now over the $105.00 level. The rally is nice to see from the outside but once
again were climbing a wall with little grip as volume continues to fall instead
of rise and provides an indication that the main reason for this move is purely
stimulus. I don’t think we’ll see either a big rally or a big fall
though as both sides of the bull and bear have significant problems to deal
with so we may be treading for awhile to come until someone decides to take
a risk.
At the close the Dow was up by +67.00 points to the 12086.00 level,
S&P 500 +4.00 points to about 1298.00, S&P 100 +2.00 points to 582.00
and the Nasdaq Composite +15.00 points to about 2700.00. Oil was higher all
day closing up about +$.40 to close around the $105.00 level.
Sales of new single-family homes fell another -16.9% to a record-low
seasonally-adjusted annual rate of 250,000. The figure was far below the 290,000
that economists had expected, though January's sales were revised a little higher
to 301,000 from 284,000. Compared to February 2010, sales were down -28%. Every
region but the West saw record lows, and in the Northeast, sales dropped by
-57% compared to January levels. The median sales price dove -13.9% to $202,100,
the biggest one-month percentage fall on record. The less-volatile three-month
average to February was 295,000, compared to 307,000 in January. It’s
becoming obvious that everything that people have been doing to get out of this
slump isn’t working and the only thing that can happen is that prices
will have to fall to come more in line with wages that still haven’t caught
up with the prices of homes. To do this prices could easily fall another -20%
and if jobs don’t start picking up they may go even lower...
Monday, March 21, 2011 4:03 p.m est.
The market rallied first thing this morning as the west coast didn’t
fall into the ocean although I hear that could still happen up till Thursday
if your firm believer of those types of things. Japan’s reactors seemed
to be getting under control or in this fast paced world we live in, its old
news now! There were also a bunch of missiles lobbed into Libya’s ghadafi’s
compound and I guess that’s a good thing. This is one war that I’m
thankful the U.S isn’t really involved in, maybe Obama is smarter than
we think! Now if he was really smart he would boost drilling and import all
of his oil from Canada and let the middle east deal with their own problems
at least until they can choose ether democratic or dictator types of leaders.
I don’t think things will change until they do it themselves. The Dow
saw early highs of +220.00 points, S&P 500 +22.00 points and the Nasdaq
up +55.00 points. As the day went on volume incredibly died but gains were held.
At the close the Dow was up by +178.00 points to 12,037.00, S&P
500 +19.00 points to about 1298.00, S&P 100 +9.00 points to 582.00 and the
Nasdaq Composite +48.00 points to about 2692.00. Oil was higher all day as tension
remains in the middle east closing up about +$1.10 to about $103.00. The bounce
today may just be an oversold bounce as volume was pathetic but if we can hold
up for the week we may have seen an intermediate bottom, time will tell. Commentaries
may be limited or erratic this week as it is spring break...
Sales of previously owned homes dropped -9.6% in February and prices
fell to their lowest level since 2002, reflecting a continued slump in the real
estate market.
The National Association of Realtors on said sales of existing homes dropped
to a seasonally-adjusted annual rate of 4.88 million from an upwardly revised
5.4 million in January. Economists expected sales to drop to a rate of 5.1 million.
The median price of homes sold fell -5.2% from last year to $156,100, the lowest
since April 2002. Price retreated in all four major regions of the U.S. Inventories
of existing homes for sale rose +3.5% to 3.49 million, representing an 8.6 months
supply. That was up from 7.6 months last month. Sales of new and used homes
have been beaten down since a housing market bubble burst after the onset of
the 2007-2009 recession. A high unemployment rate, combined with stricter lending
standards, have made it harder for people to buy homes despite low interest
rates. Many families have also lost their homes because they couldn’t
keep up with mortgage payments, putting more properties onto the market. The
raft of foreclosures has helped to drive down prices and some buyers appear
to be holding out for even better deals. At the same time it was reported last
week that were hitting a record high of people getting poorer and 25% of all
kids are needing support so this is almost understandable why things continue
to get worse.
Friday, March 18, 2011 4:03 p.m est.
The market popped this morning as there was news out that all of the
pressure being put on Libya’s ghadafi to stop attacking rebels seemed
to work as he pulled back all of his forces! There was also news out that Japan
was getting a power line to their reactors to restart the cooling pumps. The
Dow saw early highs of +150.00 points, S&P 500 +16.00 points and the Nasdaq
up +30.00 points. As the day went on the market faded but was still able to
hold decent gains too finish the day. At the close the Dow was up by +84.00
points to 11,858.00, S&P 500 +5.00 points to about 1279.00, S&P 100
+.00 points to 563.00 and the Nasdaq Composite -50.00 points to about 2617.00.
Oil was down a bit to close the day about -$.40 to about $101.60.
This past expiration cycle was an exciting one and the volatility provided
nice profits on both sides. The market may be nearing an intermediate bottom
as new details about Japan’s reactors come out and the Middle East cools
down. One concern out there at the moment though is that the moon will be at
its closest to earth tomorrow and won’t do that again for 16-years. The
magnetic pull will make high tides extreme and can cause other disruptions environmentally.
The biggest concern is that it may cause an earthquake in the Pacific “ring
of fire” which would put the west coast up next for a disruption. Other
analysts have also said that large fish kills along the California coast and
confused whale and dolphin movements also indicate that an earthquake could
occur. After a 9.0 shake in Japan this could be very interesting!
Thursday, March 17, 2011 4:03 p.m est.
As expected the market popped this morning as it was very oversold
in the shortest of times and it was the start of expiration related trading.
The Dow saw highs of +180.00 points, S&P 500 +23.00 points and the Nasdaq
down +45.00 points midday.
At the close the Dow was up by +161.00 points to 11,774.00, S&P
500 +17.00 points to about 1274.00, S&P 100 +8.00 points to 571.00 and the
Nasdaq Composite +19.00 points to about 2636.00. Oil rallied of course and closed
up about +$3.40 to about $101.40.
Consumer prices rose +0.5% in February, of course from higher gas costs.
So-called core prices, which strip out the volatile food and energy categories,
rose a lesser +0.2% because I’ve heard that Apple is going to now make
the Ipad out of dried fruit so you can actually eat it if you want. Economists
had forecast CPI to rise +0.5% overall, with a +0.1% increase in the core rate.
Consumer prices have risen an unadjusted +2.1% over the last 12 months, though
a smaller +1.1% on a core basis. Still, the 12-month core rate has almost doubled
from October's level of+ 0.6%.
Jobless Claims fell by -16,000 to 385,000. Claims in the prior week
were revised up by +4,000 to 401,000. Economists had expected first-time claims
to fall to a seasonally adjusted 389,000. The four-week average of claims dropped
-7,000 to 386,250. The four-week average is considered more accurate barometer
of employment trends because it lessens week-to-week volatility in the data.
Continuing claims decreased by -80,000 to 3.71 million. Altogether, 8.95 million
people received some kind of state or federal benefit, up almost +181,000 from
the prior week.
Wednesday, March 16, 2011 4:03 p.m est.
The market was lower once again to start the day even though the Nikkei
bounced back by just about +6% overnight. Economic data was pretty poor but
the market seemed to ignore it at least at the start of the day. The Dow saw
lows of -300.00 points, S&P 500 -33.00 points and the Nasdaq down -65.00
points going into the final hour. Tech stocks weren’t helped with a downgrade
of Apple from JMP Securities as it was down over -$18.00 at one point and IBM
was also downgraded on valuation concerns.
At the close the Dow was down by -242.00 points to 11,613.00, S&P
500 -25.00 points to about 1257.00, S&P 100 -13.00 points to 563.00 and
the Nasdaq Composite -50.00 points to about 2617.00. Oil was up a bit to close
the day about +$.80 to about $98.00.
I must say I find this whole thing about the radiation levels in Japan
ridiculous and is just another push from left to blow it up to something it
isn’t! They should be concentrating on the devastation from the earthquake
and tsunami! I always get a kick about how they like to say the reactors are
melting down!!! Did you know that the professionals that work on these things
never say that! There were reports that radiation levels are up 300% right at
the reactors which sounds awful but did you know that that still won’t
affect you physically!! Did you also know that if your wearing clothes and are
exposed to a moderate amount of radiation that if you wash the clothes and your
hands and head that it will be gone!!! Did you know that there were no deaths
in the 3-mile island reactor blow up and that even Chernobyl had less than 1000
deaths and most of those were from the actual explosion, not the 4000 reported
by the UN! The problem with it was that there was zero containment around the
site. Anyhow the point is that I’m sure there are more deaths using coal
for fuel than what has ever occurred with nuclear. If there is a problem people
are moved until things are cleared up but the main point to make about this
crisis is that these reactors are completely contained and even if there was
a “melt down” as so many people like to say all that would happen
is that all of the little beads in each of the rods would pool at the bottom
of the containment tank which is about eight feet deep and sit there, it wouldn’t
explode like an atomic bomb like people are thinking!!! Believe me, in about
a month this supposed “worst crisis in history” is going to make
those people look stupid! This is why when the market finally gets it, it will
light up like a fire cracker, well actually remain volatile but at least have
some rationality again!
As we move into the final two days of this expiration cycle its looking
like it will be an exciting one and I’m sure we’ll start to see
the buying come in tomorrow after an initial dip to start the actual expiration
for Friday. Should be interesting!
New construction of Homes and apartments plunged in February, erasing
a sharp gain in the prior month, with starts falling -22.5% to a seasonally
adjusted 479,000 annualized units, much weaker than the 570,000 pace expected
by economist. This is the biggest one-month drop in starts since March 1984.
Starts are at their lowest level since the record low of 477,000 hit in April
2009. They had jumped +18.4% in January on a surge in multifamily starts. Starts
of new single-family homes fell by -11.8% to 375,000 in February, while starts
of large apartment units fell -46.1% to 104,000. Building permits, a leading
indicator of housing construction, fell -8.2% to a seasonally adjusted annual
rate of 517,000 and is the lowest level of permits on record. All of this doesn’t
look good as we’re now in our third year of declines!
Wholesale prices jumped a seasonally adjusted +1.6% in February as
food costs experienced the biggest one-month rise since 1974! Core producer
prices, which exclude the volatile food and energy categories, rose a smaller
+0.2% so it doesn’t matter. Then again maybe it does as a congressman
was telling people that there was no inflation the other day, and a person yelled
out; “you can’t eat an Ipad!” Economists had predicted a +0.7
% increase in overall producer prices and a +0.2% increase in the core rate.
Overall producer prices have risen an unadjusted +5.6% over the past 12 months,
although the core rate has gone up at a much slower pace of +1.8%. The wholesale
food index shot up +3.9% and the wholesale energy index rose +3.3% last month.
Prices for intermediate goods, meanwhile, rose +2% in February and the crude
index climbed +3.4%.
Tuesday, March 15, 2011 4:03 p.m est.
The market started the day pretty roughly as the Japanese market finally
decided to react to the devastation over there. What mainly set it off was that
there were more dire warnings about the nuclear situation. This caused selling
to start and it grew as investors worried about production in Japan as their
economy is heavily based on exports! Basically the Nikkei closed down about
-11%. The Dow saw lows in the first few minutes of trading of -300.00 points,
S&P 500 -36.00 points and the Nasdaq down -85.00 points. When senses started
to prevail and there was an announcement that radiation levels had actually
fallen the market started to come back. When the Fed came out and basically
said nothing but that they would continue to basically support the market, the
Dow actually moved to only double digit losses but in the final hour it fell
back once again but still closed well off of lows! It is expiration and all!
At the close the Dow was down by -138.00 points to 11,855.00, S&P
500 -15.00 points to about 1282.00, S&P 100 -7.00 points to 575.00 and the
Nasdaq Composite -34.00 points to about 2667.00. Oil sold off pretty hard once
again and after bouncing a bit midday closed near its lows once again down about
-$4.00 to about $97.00.
The Fed said a run-up in commodity prices is unlikely to result in a sustained
inflation increase as it left its key short-term interest rate unchanged at
a record low and continued its plan to buy government bonds and the vote was
unanimous. In a statement, the Fed said it would "pay close attention to
the evolution of inflation and inflation expectations" and that the inflation
increase from the rise in commodity prices would be transitory. The Fed was
more upbeat about the economic outlook, saying the economy was on firmer footing
and conditions in the labor market "appear to be improving gradually."
The National Association of Home Builders/Wells Fargo Housing Market
Index edged up a point to 17% in March, marking the highest reading since May
2010, when the survey period corresponded with the final days of the federal
home buyer tax credit program. Economists expected a 16% reading. "While
many home buyers are still holding off on making a purchase, builders did indicate
slightly increased optimism about the future with a two-point gain in the HMI
component gauging sales expectations for the next six months," added NAHB
Chief Economist David Crowe. The HMI is a seasonally-adjusted index where any
number over 50% indicates that more builders view sales conditions as good than
poor, which hasn't been the case since April 2006.
Import prices climbed +1.4% in February owing to +3.7% increase in
petroleum costs. Prices for non-fuel imports rose a lesser +0.6%. Economists
had expected import prices to rise +1.1% in February following a downwardly
revised +1.3% increase in January.
A gauge of manufacturing in New York state rose in March to a nine-month
high, helped by a rise in unfilled orders, the New York Fed said. The New York
Fed's "Empire State" general business conditions index rose to 17.5%
from 15.43% the month before and topped a forecast of 17%. This was the highest
level since June 2010. Employment gauges showed expansion as the index for the
number of employees rose to 9.09% from 3.61% in February. The average employee
workweek index was up at 15.58% from 6.02%.
Monday, March 14, 2011 4:03 p.m est.
Not surprisingly the market started the day lower as the Nikkei was
down -6.2% overnight as people had their first chance to react to the devastation.
Auto makers there are keeping plants closed due to power outages so it makes
you wonder what else is going on. Down only that much is pretty good considering.
It was interesting reading over the weekend how the devastation there is actually
a good thing because it will create so many jobs because of rebuilding. This
could be the case because after Hiroshima with American help Japan prospered
or years! The only problem is that little debt problem they have. It will be
interesting to see how it all turns out...
The Dow saw lows midday of -150.00 points, S&P 500 -18.00 points
and the Nasdaq down -35.00 points. The final hour saw buying come in and losses
were cut substantially. One has to realize that the Fed put our their new calendar
schedule for purchases for the coming month and this week is heavy with buying
so its nice to know there is some cushion there for the downside. Interestingly
it seems they buy more during expiration trading weeks so maybe that’s
why they have been generally up in the past year so in the end this could also
be an up week!
At the close the Dow was down by -51.00 points to 11,993.00, S&P
500 -8.00 points to about 1269.00, S&P 100 -3.00 points to 582.00 and the
Nasdaq Composite -15.00 points to about 2701.00. Oil was off pretty good to
start the day but closed well off of its lows down about -$.30 to about $101.00.
Friday, March 11, 2011 4:03 p.m est.
Our prayers go out to those who lost loved ones in Japan’s earthquake
and tsunami!
The market reacted negatively at first to Japan’s earthquake
even though once again oil was down because the “day of rage” that
was expected in Saudi Arabia ending up being nothing as expected so at one point
it was below $100 per barrel once again. The Dow saw lows early on of -55.00
points, S&P 500 -4.00 points and the Nasdaq down -15.00 points as the dollar
was also strong. After the dollar started turning lower and tsunami waves that
were expected to hit the Pacific coast ended up being small, the market turned
around and the Dow saw highs of +110.00 points, S&P 500 +13.00 points and
the Nasdaq Composite +30.00 points in the final hour.
At the close the Dow was up by +60.00 points to 12,044.00, S&P
500 +9.00 points to about 1304.00, S&P 100 +4.00 points to 585.00 and the
Nasdaq Composite +15.00 points to about 2715.00. Oil closed off of its lows
down about -$2.00 to about $100.50.
Here’s an interesting point:
Oil has now doubled in just two years and there have been only five times in
the past 70 years when this has happened within a two-year time frame: January
1974, November 1979, September 1990, June 2000, and August 2005. And now, December
2010. . . .
Of the five times above, all but one involved a recession for the economy
and that was in 2005 during the height of the credit and housing boom, which
acted as a huge offset. Even then oil prices did keep rising and managed to
outlast the euphoria in credit and residential real estate, so the recession
may have been delayed at the peak of the growth rate in the oil price, but it
was not derailed as history shows. Time will tell.......
Sales at Retailers increased +1% in February, the eighth straight monthly
gain and the largest in four months. Sales rose an upwardly revised +0.7% in
January compared with the prior estimate of a +0.3% gain. Details of the February
report were strong. Economists expected total sales to rise +1.3%. Excluding
the +2.4% rise in motor vehicle sales, retail sales rose +0.7%, below the +0.9%
economists had expected.
Consumer sentiment declined in March at the fastest pace since the
beginning of the financial crisis in 2008, according to a survey results released
by Thomson Reuters and the University of Michigan. The gauge fell to 68.2% from
77.5% in February. The -9.3% point decline is the largest since October of 2008,
after Lehman Brothers filed for bankruptcy. The March reading surprised analysts.
Economists had expected a level of 75.8%, with gains from an improving labor
market only somewhat offset by rising gas prices. Meanwhile, the gauge of consumer
expectations plunged to 58.3% in March from 71.6% in February, while the current-conditions
index declined to 83.6% from 86.9% most likely due to the rise in gas prices.
Thursday, March 10, 2011 4:03 p.m est.
It was pointed out to me yesterday that I made a mistake saying that
the end of the crash was 2008 as it was actually 2009, sorry about that. Today
was one of those strange days when everything was down, commodities, oil, gold,
stocks, bonds but hmmm, the one thing that was up very strongly was the dollar
and why was that, financial worries. Overnight China posted a surprise trade
deficit overnight of over $7 billion in February. Investors took it as a sign
that the Chinese economy may be about to slow. Moody’s also downgraded
Spain which hit the Eurobond market. According to The Wall Street Journal: "Moody's
downgraded Spanish government debt to Aa2 with a negative outlook from Aa1 previously,
triggering sharp declines for the euro and European bond prices in early European
trading." Traders took notice of this as they had also just cut Greece’s
debt once again basically to junk status and are now paying 17.6% interest rates
to borrow money! Maybe they should get one of those 0% interest rate credit
cards for one year!!
The Dow saw lows early on and matched them again in the final hour
of -240.00 points, S&P 500 -26.00 points and the Nasdaq down -60.00 points.
At the close the Dow was down by -230.00 points to 11,984.00, S&P 500 -25.00
points to about 1295.00, S&P 100 -11.00 points to 582.00 and the Nasdaq
Composite -51.00 points to about 2701.00. What was also interesting was that
in Libya there was fighting right around some oil wells, yet at one point today
oil was down over -$3.00! I know why, Libya is only 2% of all of the worlds
oil supply and there is still an overabundance of it around the world! Oil closed
off of its lows closing down about -$2.00 to about $103.00.
With all of the tension you would think that oil would be remaining higher but
the Schork Report notes that speculators now own nearly six times as many barrels
of oil – 268,622 futures contracts representing nearly 269 million barrels
– as can be stored at the WTI trading area in Cushing, Oklahoma. What
this means is that there is a lot of speculative fervor building in the energy
markets. Traders added 40,000 to 50,000 crude contracts (1,000 barrels per contract)
to their long positions in the second half of last week which could take them
up to seven times the Cushing capacity, a level they call extraordinary. This
speculation is so remarkable that the big trading firms now have nearly twice
as many long contracts open as they did in 2008, when oil spiked to $147 in
the summer, a development that either foreshadowed or caused the global economic
meltdown, depending on how you look at it.
Jobless Claims jumped by +26,000 last week to a seasonally adjusted
397,000. Economists had expected first-time claims to rise to a seasonally adjusted
378,000 from last week's upwardly revised level of 371,000. Over the past four
weeks claims have averaged 392,500, putting them near a three-year low. Continuing
claims fell by -20,000 to a seasonally adjusted 3.77 million. Some 4.3 million
people received extended federal benefits, down more than -200,000 from the
week before. Altogether, 8.77 million people received some kind of state or
federal benefits, down -463,351 from the prior week.
The trade deficit widened by 15.1% in January to $46.3 billion, the
Commerce Department said and is the largest since June 2010 and came despite
a record level of exports. The trade deficit was well above the consensus forecast
of a deficit of $41.5 billion. Imports rose +5.2% in January, the biggest gain
since March 1993, easily outpacing a +2.7% gain in exports. The trade deficit
with China widened to $23.2 billion in compared with $18.3 billion in the same
month last year. The trade deficit had added an impressive 3.4 percentage points
to growth in the fourth quarter. But the wider deficit in January suggests trade
will be a drag on first quarter growth.
Wednesday, March 9, 2011 2:03 p.m est.
Happy Crashversary as today is the exact second year anniversary of
the end of the slide we saw in 2008. Since then we have seen an exact 100% rally
off the bottom less the small pullback we have seen the past few weeks. So far
it seems more like a consolidation then a correction as there has been little
downside and if history continues to repeat itself, it will be quite a while
before we see any real hard downside but because of the big move we have seen
it also means the upside is limited, gotta luv it!!! I’m finally starting
to really look forward to the next year!!
For now though the volatility has continued. On Monday the market was
down around -1% and yesterday it bounced back about the same. Today it started
lower with the Dow seeing lows of -60.00 points, S&P 500 -10.00 points and
the Nasdaq down -30.00 points but with oil remaining lower and the fact that
the shorts couldn’t push the market down it rallied back becoming mixed
with the Dow seeing highs of +30.00 points, S&P 500 +1.00 points and the
Nasdaq Composite -5.00 points midday. We’re likely to remain this way
till the end of the day but tomorrow we get another look at employment numbers
so we could see volatility kick up once again.
Speaking of 2-year anniversaries: CredAbility, one of the leading nonprofit
credit counseling and education agencies in the U.S released its Consumer Distress
Index for the 2010 fourth quarter. The Index, a quarterly measure that tracks
the financial condition of the average household, found that rising stock prices
helped propel growth in consumers net worth and that made sense because everyone
bought at the bottom because it was so obvious,,,,not!!! Lower scores in three
of the index’s other four categories - employment, housing and household
budget drove down the overall index though. In actuality we know not everyone
bought at the bottom, very few actually so its no surprise to see that the health
of household budgets declined each quarter in 2010 and is at the lowest level
since the first quarter of 2009. For the quarter ended December 31, 2010, households
scored a 64.3% on the Index’s 100% scale, down slightly from 64.4% in
the third quarter of 2010. For all of 2010, the index showed a small improvement,
moving up from a score of 63.9% in 2009?s fourth quarter. A score below 70%
indicates a state of financial distress. The average consumer has been in financial
distress for 10 consecutive quarters, according to the Index. The last time
the index was above 70% was in the second quarter of 2008. Basically what it
all means is that the increase in the fourth quarter and all of 2010 has not
yet translated into improved financial health for many average American families,
Monday, March 7, 2011 4:03 p.m est.
The market started the week on the upside even though oil was higher
once again but not by that much. The Dow saw highs of +70.00 points, S&P
500 +7.00 points and the Nasdaq Composite +15.00 points. When oil started to
rally and the dollar started to get stronger though it turned down and the Dow
saw lows of -130.00 points, S&P 500 -17.00 points and the Nasdaq down -65.00
points. It was getting pretty oversold in the shortest of time though so it
rallied a bit in the last hour to cut losses in half.
At the close the Dow was down by -80.00 points to 12,090.00, S&P 500 -11.00
points to about 1310.00, S&P 100 -4.00 points to 588.00 and the Nasdaq Composite
-39.00 points to about 2746.00. Oil hit the $107 level but then only closed
up about +$1.00 to about $105.50.
Today was the day that the market hit its lows with the S&P 500
at 666.79 and then it will be exactly two years ago Wednesday that will mark
the Dow bottom in 2009. Since then, the market is up about 85%. A 85% rally
over two years is quite rare and this is only the 9th time it has happened since
1900. In the past the market has continued to rally during the next three and
six months however only about 65% of the time and only about +3% overall which
is nothing compared to the 85% gain! More important though is that the returns
have been more bearish in the longer term. One year after this event history
history reveals that there is an average loss of -2.7%. Two years later, the
Dow was higher only 25% of the time averaging a significant -6.3% loss. One
thing for sure is that it indicates that we’re going to likely continue
to see some volatility in the coming months which is going to be great for getting
great fills on both sides. This expiration is a great example as we’ve
got great premium on each side!
Friday, March 4, 2011 4:03 p.m est.
This could be interesting; Just overnight the price of gas rose another
+4.4 cents to an average cost of $3.47 per gallon and has been steadily rising
for a few months now. It seems to have accelerated after oil first hit $100.
The oil companies are gouging consumers for sure as it takes a little longer
than one day for delivery. In Canada prices popped +.10 cents a liter or about
+.40 cents a gallon the day after oil hit $100 to make it an average price of
$5.60 a gallon! Up here no one is even talking about it so America needs to
get vocal now! Actually, calls for tapping into U.S. strategic oil reserves
continue to rise. According to the New York Times: "As oil prices have
risen in recent weeks, calls have been growing in Congress for the Obama administration
to consider tapping into the nation’s strategic petroleum reserve, which
is now at its full capacity of 727 million barrels." When oil was hitting
$140 the same thing happened to President Bush and when he did start using it
the price of oil fell -10% in the blink of an eye and then continued lower.
We’re seeing lots of volatility this week as the market fell
pretty hard today even though the jobs report this morning was pretty good it
indicates that most of the rally yesterday was likely a “buy the rumor”
type of move. With all of this up and down action we’re virtually unchanged
on the week which is great for our trades! I would expect it to continue next
week as their are more protests being called for in the Middle East. The Dow
saw lows of -180.00 points, S&P 500 -20.00 points and the Nasdaq down -35.00
points going into the final hour but short covering into the close cut losses
in half. At the close the Dow was down by -88.00 points to 12,170.00, S&P
500 -10.00 points to about 1321.00, S&P 100 -5.00 points to 593.00 and the
Nasdaq Composite -14.00 points to about 2785.00. One of the reasons for the
sell off was that oil is now over the $104 level up about +$2.50 to about $104.50.
Job growth accelerated in February and the unemployment rate fell for
the third straight month with it increasing by +192,000 in February. This was
slightly lower than the +218,000 gain expected by economists. Job growth in
December and January was revised higher by +58,000 jobs which is kind of disappointing.
The ADP report which came out earlier in the week was correct for once coming
in with private-sector payrolls increasing by +222,000, the biggest increase
since last April. The participation rate remained unchanged at 64.2%. An alternate
measure of employment, which includes discouraged workers and those forced to
work part-time because of the weak economy, fell to 15.9% from 16.1% but still
remains much to high but is the lowest since April 2009. Among all industries,
68.2% were hiring, up from 60.1% in January and is the broadest range of hiring
since May 1988. Factory payrolls increased by +33,000 last month, exceeding
the survey forecast of a +25,000 gain. Employment at service-providers rose
+122,000. Construction payrolls rose +33,000 and transportation and warehousing
jobs increased by +22,000. Retail trade employment declined -8,100.
Government payrolls decreased by -30,000 last month reflecting cuts
at the state and local level. Federal government employment was unchanged.
Average hourly earnings held steady at $22.87. Earnings are up +1.7%
in the past year and the average workweek was unchanged at 34.2 hours. The unemployment
rate ticked lower to 8.9% in February from 9% in the previous month. Economists
forecast the unemployment rate to rise to 9.1%. The jobless rate declined as
the number of unemployed fell by -190,000 and number of employment rose by +250,000
with the size of the labor force increasing by +60,000. The underemployment
rate, which includes part- time workers who’d prefer a full-time position
and people who want work but have given up looking fell a whopping -0.2% to
15.9% from 16.1% and that’s not a good sign in the big picture.
New orders for manufactured goods were up +3.1% in January, the largest
gain since September of 2006 as new orders for transportation equipment grew
+27.3%. Economists had expected overall new orders to rise +2%. Excluding transportation,
new orders gained +0.7%. Orders for durable goods rose +3.2% in January, up
from a prior estimate of +2.7%. Orders for nondurable goods rose +3.1%. In December,
overall new orders for manufactured goods rose +1.4%.
Thursday, March 3, 2011 4:03 p.m est.
The market shot of the gates today and didn’t look back all day
with highs hit in the final hour with the Dow seeing highs of +220.00 points,
S&P 500 +55.00 points and the Nasdaq up +25.00 points.
At the close the Dow was up by +191.00 points to 12,258.00, S&P
500 +23.00 points to about 1331.00, S&P 100 +10.00 points to 598.00 and
the Nasdaq Composite +51.00 points to about 2800.00. Oil was lower all day but
remaining above the $100 level down about -$.35 to about $102.00.
Jobless Claims fell by -20,000 to 368,000, the lowest level in nearly
three years. The last time claims were that low was in May 2008. Economists
had expected first-time jobless claims to rise to a seasonally adjusted 398,000
from last week's revised level of 388,000. Over the past four weeks claims have
averaged 388,500, marking the lowest one-month average since July 2008, according
to government data. The four-week average is considered a more accurate gauge
of employment trends because it lessens week-to-week volatility in the data.
The decline in claims, which have fallen -27% since last August, appears to
be consistent with a modest pace or hiring and fewer layoffs. Continuing claims,
meanwhile, declined by -59,000 to 3.77 million. About 9.24 million people received
some kind of state or federal benefits, up +74,000 from the week before.
The productivity of businesses rose +2.6% in the fourth quarter, unchanged
from the government's initial estimate. Economists expected productivity to
be revised down to +2.2% from a seasonally adjusted +2.6%. The quantity of goods
and services produced, known as real output, grew at an annualized rate of 4%,
down from an originally reported 4.5%. Hours worked rose +1.4% instead of +1.8%
as initially estimated. Productivity is calculated by dividing the output of
goods and services, adjusted for inflation, by the number of hours that employees
work.
Activity in the service sectors of the economy expanded at the faster
pace in February, the Institute for Supply Management reported. The ISM non-manufacturing
index rose to 59.7% in February from 54.9% in January. The increase was unexpected.
Economists were looking the index to increase to hold steady at 54.9%. The employment
index rose to 55.6% in February from 54.5% in January. The employment index
is closely watched for hints about to the likely strength of the key February
non-farm payroll report to be released on Friday.
Wednesday, March 2, 2011 4:03 p.m est.
The market was all over the place today starting the day lower then
moving up, then selling off pretty hard to then rally hard! Gotta love volatility
to nowhere though, giving us premium decay in our sold options! The Dow saw
highs of +60.00 points and -40.00 points for lows, S&P 500 +7.00 points
and -5.00 points for lows and the Nasdaq up +25.00 points but only minor lows
of -5.00 points.
At the close the Dow was up by +9.00 points to 12,067.00, S&P 500
+2.00 points to about 1308.00, S&P 100 +.45 points to 588.00 and the Nasdaq
Composite +11.00 points to about 2748.00. Oil was higher all day closing over
the $100 level once again up about +$2.75 to about $102.40.
Private-sector employment jumped in February, and the recent pace of
gains has been speeding up, according to Automatic Data Processing Inc.’s
employment report.
Private-sector employment rose +217,000 in February, increasing +104,000
at medium businesses, +100,000 at small businesses and +13,000 at large businesses.
By sector, service-producing employment rose +202,000, while goods-producing
employment gained +15,000. The report suggests continued solid growth of private
employment early in 2011. The consensus for the February report produced by
ADP was for a +180,000 increase. On Friday, the government will report on February’s
Employment report, which also include government workers, and economists are
looking for a gain of +200,000, and for an unemployment rate of 9.1%.
However, outplacement consultancy Challenger, Gray & Christmas
reported that the number of planned job cuts announced by U.S.-based companies
rose in February to almost -51,000, the highest level since March of 2010, and
up +20% from the prior year.
This is the highest level in 11 months as government and non-profit
employers let workers go. "It is too soon to say whether the increases
in January and now February represent a trend," John Challenger, chief
executive officer of Challenger, Gray & Christmas, said in a statement.
Challenger said worries over rising gas prices could impact staffing decisions
over the next six months. "At the very least, rising energy costs could
force employers to postpone hiring plans. At worse, increased costs could kill
the fragile recovery and spur another round of layoffs," Challenger said.
The government and non-profit sector led layoffs with 16,380 job cuts, up +154%
from January. Retail followed with a +44% increase in planned cuts to 8,360.
Some manufacturers and retailers are succeeding in raising prices,
one key pre-condition for inflation to take hold, according to the Fed’s
latest Beige Book survey of economic conditions. Another key inflation ingredient,
rising wages, remained largely absent, the Fed survey found. Overall, the economy
was improving at a "modest to moderate" pace, the report concluded.
Manufacturing growth was solid and service activity was strengthening. Commercial
real estate reportedly improved in several districts, the first report of a
pickup in office and factory projects since at least the beginning of the recession
in late 2007. Credit standards were unchanged or tighter in most districts.
Tuesday, March 1, 2011 4:03 p.m est.
The market started the day higher with the Dow up +40.00 points, S&P
500 +5.00 points and the Nasdaq up +10.00 points but just before Fed chief Bernanke
or his new nick name the Bernank, it started to sell off. During his speech
to congress telling them there isn’t any inflation, after the laughter
subsided it was announced that the SEC was charging former Goldman Sachs Group
director Rajat Gupta for allegedly passing inside information to hedge fund
billionaire Raj Gupta, who served on the board at Goldman and Procter &
Gamble and was a friend of Rajaratnam, tipped the Galleon Management founder
and hedge fund manager with inside information about the quarterly earnings
at both companies as well as an impending $5 billion investment by Berkshire
Hathaway. This took the market down and the Dow saw lows of -170.00 points,
S&P 500 -22.00 points and the Nasdaq Composite -55.00 points in the final
minutes of trading.
Bernanke stuck his neck out today and said the increase in inflation
was from the spike in oil prices and will be modest and temporary. “The
most likely outcome is that the recent rise in commodity prices will lead to,
at most, a temporary and relatively modest increase in U.S. consumer price inflation,”
Bernanke said in prepared remarks to the Senate Banking Committee. The problem
with all of these guys that don’t drive or have to buy food is that prices
have been slowly creeping up for the past year on nearly everything! All they
care about is the price of what a plane sells because that’s what important
to them!!
At the close the Dow was down by -168.00 points to 12,058.00, S&P
500 -21.00 points to about 1306.00, S&P 100 -9.00 points to 587.00 and the
Nasdaq Composite -45.00 points to about 2737.00. Oil was higher all day closing
over the $100 level once again up about +$4.00 to about $101.00.
Manufacturers remained in a strong expansion mode in February, according
to the Institute for Supply Management manufacturing index climbing to 61.4%
in February, the highest level since May 2004! Any reading over 50 indicates
that more manufacturers are expanding instead of shrinking. The manufacturing
sector has now grown 19 straight months, outshining most other industries during
that time. Economists had forecast the index to edge up to 61%.
Friday, February 25, 2011 4:03 p.m est.
The market took off this morning as oil was lower on the day but interestingly
volume dropped like a stone so next week could be interesting. The Dow saw highs
of +85.00 points, S&P 500 +14.00 points and the Nasdaq was very strong up
+45.00 points. The final hour saw a bit of a pullback but tech stocks remained
strong.
At the close the Dow was up by +62.00 points to 12,130.00, S&P
500 +14.00 points to about 1320.00, S&P 100 +5.00 points to 592.00 and the
Nasdaq Composite +43.00 points to about 2781.00. Oil was higher to close the
week but under $100 closing up about +$.70 to about $98.00.
The economy grew at a +2.8% pace in the final three months of 2010,
slower than originally projected, based on new data showing that consumers and
state and local governments spent less than first estimated. Last month, Gross
Domestic Product climbed at a +3.2% annual rate in the fourth quarter. The revised
report takes into account data not initially available in the first reading.
Economists had expected revised GDP to remain at +3.2%. While consumer spending
underpinned growth in the fourth quarter, the government now says spending rose
+4.1%, down from a previously reported +4.4% but still much faster than the
+2.2% rate during the first three quarters of 2010, however. Consumer spending
is the single largest contributor to the economy.
For all of 2010, the economy expanded by 2.8%, the fastest pace of
growth since 2007. Yet the nation’s unemployment remains stuck at elevated
levels around 9.0% in January and the recovery has been one of the weakest in
modern record. Economists say the U.S. will have to grow a lot faster to put
millions of idle Americans back to work. Most forecasters expect growth of about
+3.2% or higher in 2011. Most other data in the government’s latest GDP
report were little changed. Spending on durable goods, nondurable goods and
services all rose, but at slightly lower levels than previously reported. Final
sales for domestic product, considered a better measure of domestic demand because
it excludes inventories and trade, rose at +6.7% rate instead of +7.1% as initially
calculated. The key inflation indicator in the GDP report was barely changed
from the first estimate. The personal consumption expenditure index remained
at +1.8%, though the core index excluding food and energy was marked up to +0.5%
from 0.4%.
An index of consumer sentiment rose in February, according to media
reports of a poll released by Thomson Reuters and the University of Michigan.
The gauge rose to 77.5% in February from 74.2% in January. A prior estimate
for sentiment in February was for 75.1%. Economists had expected a final February
reading of 75.4%.
Thursday, February 24, 2011 4:03 p.m est.
Drill, drill drill! Where have I heard that before! I’m pointing
this out as we saw oil move easily over $100 a barrel this morning for a brief
time but I saw a very interesting report in the media today that was very enlightening
on how oil should really be back at the $50 level, if not lower. Of course everyone
knows that Saudi Arabia has a drill-able oil supply of about 280 billion barrels.
Second is Canada with the tar sands in Alberta of about 170 billion barrels!
Both of those are in production now. Guess who the third is, wait for it,,,,,,America
has 800 billion barrels of oil sitting in shale! That’s unbelievable but
of course why would we go there when we can worry about getting it from places
like Libya where Khadafi just announced that the reason his people are protesting
is because there are drugs in the water!!
The market was down again today and looked like we were going to see
another big down day as oil was well over $100. The Dow saw lows of -120.00
points, moving below the 12,000 level, S&P 500 -12.00 points, moving below
the 1300 level, and the Nasdaq was only off -15.00 points as tech stocks were
strong all day. When oil started to pull back, the market started to rally though
going into the final hour. Just before the close the market actually became
mixed with the S&P 500 and Nasdaq higher but the Dow remained lower.
At the close the Dow was down by -37.00 points to 12,069.00, S&P
500 -1.30 points to about 1306.00, S&P 100 -1.30 points to 587.00 and the
Nasdaq Composite +15.00 points to about 2737.00. Oil was well over $100 in the
morning but rumors about margin increases in the futures market started the
selling and it closed down about -$1.20 to about $97.00.
Jobless Claims fell by -22,000 to 391,000, and surprised economists
as they expected a drop to a seasonally adjusted 405,000 from 413,000. In addition,
the four-week average fell to a more than two-year low, down -16,500 at 402,000.
Continuing claims dropped -145,000 to a seasonally adjusted 3.79 million. About
9.16 million Americans were getting some kind of state or federal benefits down
-89,782 from the prior week.
New home sales fell in January, almost completely retracing the strong
gain seen in December. The decrease in new-home sales to a seasonally adjusted
annual rate of 284,000 was below the 300,000 pace expected by economists. New-home
sales in December rose a revised +15.7% to a 325,000 level compared with the
previous estimate of a +17.5% rise to 329,000. New-home sales are down -18.6%
compared with a year ago. The supply of new homes fell -0.5% to 188,000 units.
The supply in relation to sales rose to 7.9 months in January from 7 months
in December. Median sales prices have risen +5.7% in the past year to $230,600.
Durable goods rose +2.7% in January on stronger demand for civilian
aircraft. The increase in total orders was very close to the +2.5% gain that
was the consensus forecast of economists. This is the first increase in durables
in four months. Orders for December were revised up sharply to a decline of
only -0.4% from the prior estimate of a -2.3% decline. Transportation orders
had the largest increase in January, rising +27.6%. Excluding transportation,
orders fell -3.6%, the biggest drop since January 2009. Shipments rose +0.3%
in January. Orders for core capital goods fell -6.9% in the month after a +4.3%
rise in December.
Wednesday, February 23, 2011 4:03 p.m est.
The market was lower once again today as oil was strong and interestingly
the lower dollar didn’t help to support it. With all of the tension around
the world you would think the dollar would be very strong. The Dow saw lows
of -150.00 points, S&P 500 -15.00 points and the Nasdaq -55.00 points midday
but from there it rallied to make up half of the losses. The market is getting
pretty oversold in the short term but that doesn’t mean that in the longer
term it won’t continue lower. One thing that is appearing though is that
we truly are starting to see a trend change which is great, finally some volatility!!!
At the close the Dow was down by -107.00 points to 12,106.00, S&P
500 -8.00 points to about 1307.00, S&P 100 -3.00 points to 589.00 and the
Nasdaq Composite -33.00 points to about 2723.00. Oil continued to rally getting
very close to that $100 level up about +$1.00 to about $98.00.
Sales of existing homes rose a seasonally-adjusted +2.7% in January
for the fifth monthly rise in six. The National Association of Realtors said
sales of existing homes were at a seasonally-adjusted annualized rate of 5.36
million from a downwardly revised 5.22 million in December. Economists expected
a 5.22 million pace. On a year-over-year basis, sales rose +5.3%, and activity
is now above the level when a now-expired tax credit existed. The realtors group
also, as planned, revised monthly figures from 2008 to 2010 ahead of a bigger
review that's due in the summer. The trade group's data has been called overstated
by as much as 20% though the NAR's chief economist said he hoped the revision
would be in "single digits." The median price of home sales - which
weren't affected by this revision and aren't expected to be by the summer review
- fell -3.7% from last year to $158,800, the lowest since April 2002.
Tuesday, February 22, 2011 4:03 p.m est.
What an interesting start to the shortened trading week. The market
finally fell after Middle East tensions continued to mount over the weekend.
It appears that traders were just delayed! Economic data wasn’t favorable
either even though consumer confidence remained strong. The Case/Shiller housing
index indicated that its 20-city index is headed back to old lows and that the
country may see another -15-25% drop in housing prices this year! The Dow saw
lows of -125.00 points, S&P 500 -20.00 points and the Nasdaq -60.00 points
but of course losses were cut almost in half as the dollar remained weak and
the huge +$8.00 spike in oil was cut in half. Besides that don’t forget
the Fed is in their buying $6-$8 billion today alone!
All of the selling started today because of unrest in Libya but when
the media came out declaring that Gadhafi was going to declare that changes
were going to be made in Libya it rallied, but when he actually spoke saying
that he would “die as a martyr" and that Libyans need to help defend
the country against those who were stirring the unrest, people he referred to
as "gangs" or "terrorists," the market started to sell off
again back to lows. The final hour saw new lows with the Dow seeing -220.00
points, S&P 500 -31.00 points and the Nasdaq Composite -85.00 points. It
bounced a little into the close but Hewlett Packard just reported poor earnings
and is now down about -5% so tomorrow may not turn out that well either but
I wouldn’t be surprised if we start to flatten out around here as the
dollar is remaining weak, oil closed off of its lows and the Fed will be in
buying once again tomorrow.
At the close the Dow was down by -178.00 points to 12,213.00, S&P
500 -28.00 points to about 1315.00, S&P 100 -11.00 points to 591.00 and
the Nasdaq Composite -78.00 points to about 2756.00. Oil rallied of course closing
up about +$7.00 to about $94.00.
The prices of single-family homes in 19 of 20 major cities fell a non-seasonally
adjusted -1% in December, according to the S&P/Case-Shiller home price index
released by Standard & Poor's and is the fifth straight monthly decline.
The only exception was Washington D.C.. Prices have moved down -2.4% in the
past year. A quarterly index covering the entire nation showed home prices fell
-3.9% in the fourth quarter compared with the third. "Despite improvements
in the overall economy, housing continues to drift lower and weaker," David
Blitzer, chairman of the index committee at S&P, said in a statement. While
the composite held above its 2009 low, 11 cities hit their lowest levels since
home prices peaked in 2006 and 2007, the report showed. The numbers heightened
worries that the housing market has entered a double-dip and could be a problem
for months to come. "I think the price may go down substantially,"
Robert Shiller, Yale University professor of economics who helps formulate the
study, said.
Consumer confidence jumped to 70.4% in February, reaching the highest
level in three years, with more optimism about the future, while views on current
conditions remain weak. Looking ahead, consumers are more positive about the
economy and their income prospects but they always are. Economists had expected
a confidence reading of 66%. The report for February is the first using a new
survey provider, but the questions were unchanged. Data have been restated back
to November, but older data can be compared with new results, according to the
Conference Board. Consumer expectations rose to 95.1% in February, the highest
level since December of 2006 from 87.3% in January. Meanwhile, consumer assessment
of the present situation increased to 33.4% from 31.1%. The Conference Board's
index helps analysts compare fluctuations in confidence, with a reading of 100
for the base year of 1985. Generally when the economy is growing at a good clip,
confidence readings are at 90 and above.
Friday, February 18, 2011 4:03 p.m est.
The market started the day mostly flat but after the Dow saw lows of
-10.00 points, S&P 500 -1.50 points and the Nasdaq -1.00 points it turned
around especially the Dow and the market turned positive. Midday worries about
the weekend pulled the market lower with the Dow losing most of its gains but
the S&P 500 saw lows of -2.50 points and the Nasdaq Composite -10.00 points.
Of course with expiration happening for the S&P 100 at the close, buyers
came back and that helped to drive the market higher into the close. The Dow
saw highs of +80.00 points but the strength wasn’t there for the S&P
500 as it had already made highs earlier of +4.00 points and the Nasdaq Composite
+10.00 points.
At the close the Dow was up by +73.00 points to 12,391.00, S&P
500 +3.00 points to about 1343.00, S&P 100 +3.00 points to 602.50 and the
Nasdaq Composite +2.00 points to about 2834.00. Oil rallied of course after
it was reported that Iran’s war ships were going to be allowed to move
through the Suez canal but profit taking due to the contract change saw it close
down about -$.20 to about $86.20.
It appears that were definitely in a bull market because although all
rationality pointed towards a lower close today due to the long weekend and
middle east problems, the market rallied at the close. One of the reasons for
the rally today may have also been because people were putting shorts on but
I won’t have that confirmed until over the weekend. There was an interesting
stat out today which reveals how straight up this rally has been and that this
type of strength has only been seen five other times since the market started
trading. Since September the market has been up +28% in only 5 months, +5.5%
per month. One would think that its not sustainable but the last five times
this has happened the market has actually rallied an additional +22% in the
following year. I found that very interesting and will have to look into it
in more detail. One thing that I have seen is that when you do have this sharp
of an advance the initial sell off is never that bad as people like to “retest”
so to speak to see if a top was truly made.
The rally has been amazing but the bad news is that it has basically
been driven by the Fed’s QE2 stimulus. There has been no volatility in
stocks in the past 6 months and I was sure that it would have started this past
cycle but maybe it will now as we still have the dreaded second half of February
to contend with. I know that at the rate we have been going we’ll be taking
out the previous closing high of 1,565.15 from October 10th, 2007 sometime around
the start of July and I know that’s impossible without some type of a
pullback! Don’t forget, housing is still off about -40% from its all time
highs, and real unemployment is around 20% so obviously, its mostly stimulus
pushing the rally and it will be interesting to see what happens when the Fed
is done in June, QE3!
Thursday, February 17, 2011 4:03 p.m est.
The market started the day lower on worries about the Suez once again
and Israel making the statement that it is unacceptable and action may be needed
to be taken. The Dow saw lows of -40.00 points, S&P 500 -5.00 points and
the Nasdaq -15.00 points but as volume moved lower and lower the market went
higher and higher with the Dow seeing highs of +40.00 points, S&P 500 +5.00
points and the Nasdaq Composite +10.00 points. We only had 576,000 shares traded
going into the final hour unbelievably and there was some selling at the close
but the market remained higher.
At the close the Dow was up by +30.00 points to 12,318.00, S&P
500 +4.00 points to about 1340.00, S&P 100 +1.50 points to 601.00 and the
Nasdaq Composite +6.00 points to about 2832.00. Oil rallied of course after
Iran’s war ships moved into the Suez canal closing up about +$.80 to about
$85.00.
Tomorrow is expiration and the last day of trading before a long weekend
which could be ripe with disturbances throughout the middle east and war threats
from Israel so people won’t likely want to hold stocks for the weekend.
It is also the final trading day for the February expiration cycle which has
historically been down and finally, the Stock Traders Almanac also says that
the Friday before the Presidents day holiday is the most down pre-holiday day
of the year, which indicates at the least that there should be a bit more downside
pressure.
Jobless Claims rose last week by +25,000 to 410,000. Economists had
expected initial claims to rise to a seasonally adjusted 400,000 from a revised
385,000 the week before. Continuing claims, which reflect the number of people
already receiving unemployment compensation, edged up by +1,000 to a seasonally
adjusted 3.91 million. About 9.25 million people were getting some kind of state
or federal benefit in the week ended Jan. 29, down about 108,500 from the prior
week.
Consumer prices rose a seasonally adjusted +0.4% in January, driven
by higher food and energy expenses. The core consumer price index, which strips
out volatile food and energy costs, rose a lesser +0.2%. Economists had forecast
CPI to rise +0.3% overall, with a +0.1% increase in the core rate. Consumer
prices are up +1.6% over the last 12 months. In a related report, the government
said average hourly earnings fell -0.1% in January, adjusted for inflation.
Real average weekly earnings were down -0.3%.
The percentage of mortgages in foreclosure tied a record high in the
fourth quarter of 2010 even though mortgage delinquencies hit their lowest level
since the end of 2008, the Mortgage Bankers Association reported. The percentage
of mortgages in foreclosure tied a record high in the fourth quarter of 2010,
even though mortgage delinquencies hit their lowest level since the end of 2008,
the Mortgage Bankers Association reported. The percentage of mortgage loans
somewhere in the foreclosure process was 4.63%, up from 4.39% in the third quarter
and 4.58% in the fourth quarter of 2009. The delinquency rate, which includes
mortgages that are at least one month past due but not yet in foreclosure, fell
to a seasonally adjusted 8.22% of all loans outstanding, down from 9.13% in
the third quarter and 9.47% in the fourth quarter of 2009.
The index of manufacturing activity in the Philadelphia region jumped
in February to its highest level since January 2004, the Fed’s Bank of
Philadelphia reported. The Philly Fed business condition index rose to 35.9%
in February from 19.3% in January. The increase was much stronger than expected.
Economists expected the index to move higher to 20.8%.
Wednesday, February 16, 2011 4:03 p.m est.
The market started the day higher once again as Dell had pretty good
earnings and that 100% mark say there for the S&P 500. It was finally hit
with the rally and surpassed with the Dow seeing highs of +80.00 points, S&P
500 +10.00 points and the Nasdaq Composite +25.00 points. Over lunch Kyle Bass
was speaking who is highly respected right now as he timed the housing crash
and banking crisis to a tee so when he said that America is headed for the same
fate as Japan and Israel announced that there could be ramifications for Iran
if they continue to move war ships into the Suez canal, the market dropped like
a stone and went from those highs to nearly the unchanged level in a matter
of minutes! Gotta love Program trading, click a button and there she goes! Of
course the market couldn’t stay down though as that would be wrong in
this Fed induced rally so it bounced back in the final hour.
At the close the Dow was up by +62.00 points to 12,288.00, S&P
500 +8.00 points to about 1336.00, S&P 100 +3.00 points to 600.00 and the
Nasdaq Composite -21.00 points to about 2826.00. Oil rallied of course after
Iran’s war ships moved into the Suez canal closing up about +$.80 to about
$85.00.
The market has been on a momentum run for the past two months. That
means that when it breaks, we are likely to have a significant correction. How
big has this move been? So far, the market is up about +14% from its December
2010 lows without even the slightest of corrections! If we continue up it could
turn out to be a nearly +75% annualized rate of gain for this year if we keep
up this pace! Of course it's unlikely that we can do that but the question is
when will we take a break. There are two major forces at work. One is easy money
as the Fed continues to pump money into the system and will likely do so for
the next several months or longer. however their Fed minutes mentioned today
that they are starting to debate stopping it early and if we are tracking Japan,
after their QE1 and 2 were done, the market went right back down. Unless the
economy really starts picking up here this year that will likely be the case.
Yesterday I mentioned that the Empire Manufacturing survey came out
and today read an interesting article that covered it in detail a bit more.
It did show it at 15.43% versus 15% expected which is a great number you would
think but after a little digging you see that its not picking up so much after
all! Was it the employment component that gave us a lift, nope, employment was
3.61%, down from 8.42% in December. Then it must have been New Orders, nope,
new orders fell to 11.8% from 12,39%. It had to be pricing then and there it
is, prices jumped +6.8% in the last 30 days from 15.79% in January to 16.87%
this month. So rising prices overrode the declining employment and orders to
give us a +3.3% gain. That’s great heh, almost 50% of our inflation drops
down to the bottom line. I’ll bet if we can get inflation up over 100%
then we can pop the markets a good 50%!
Today, Housing Starts rose to its highest level in four months in January
with them up +14.6% to a seasonally adjusted 596,000 annualized units, stronger
than the 520,000 pace expected by economists. This is the highest level of starts
since September. Building permits, a leading indicator of housing construction,
fell -10.4% to a seasonally adjusted annual rate of 562,000 however but follows
a +15.3% jump in permits in December as builders rushed to avoid building code
changes in several key states including California.
Wholesale prices jumped +0.8% in January as gas costs rose again. Core
producer prices, which exclude the volatile food and energy categories, rose
+0.5%, marking the largest increase since October 2008. Economists surveyed
by MarketWatch had predicted a 0.9% gain in overall producer prices and a 0.3%
increase in the core rate. Producer prices have risen 3.6% over the past 12
months on an unadjusted basis. The core rate has climbed a slower 1.6% over
that span.
Tuesday, February 15, 2011 4:03 p.m est.
The market was actually lower early on today but after an attempted
bounce it actually fell back again to make lower lows. The Dow saw -80.00 points,
S&P 500 -9.00 points and the Nasdaq Composite -20.00 points. There was an
interesting buy today of 210,000 puts at the 1300 level on the S&P 500 e-mini
today which is strange considering we only have three trading days left. Someone
know something we don’t!! Actually 1300 is barely even -2% off so it may
not be that risky of a trade.
At the close the Dow was down by -42.00 points to 12,226.00, S&P
500 -4.00 points to about 1328.00, S&P 100 -2.00 points to 596.00 and the
Nasdaq Composite -13.00 points to about 2804.00. Oil was lower by about -$.50
to about $84.50.
Sales at retail stores rose +0.3% in January to mark the seventh straight
monthly gain, but the increase was the lowest since last summer. Sales excluding
the volatile auto segment were also up +0.3%. Economists had forecast sales
to rise by +0.6% overall, and by +0.6% excluding autos. The government also
revised sales in December lower, to a +0.5% gain from +0.6% as originally reported.
The biggest increase in sales took place at gas stations, auto retailers and
online and catalog stores. Sales fell at grocery, liquor, clothing and building-supply
stores. Consumers also spent less at bars and restaurants and bought fewer leisurely
items such as books, music and sporting goods.
Conditions for manufacturing in the New York region improved in February
from the prior month, the New York Fed said. The bank’s Empire State Manufacturing
index rose to 15.4% in February from a revised 11.9% in January. This is the
highest level since last June and above analyst expectations. Economists had
forecast the index would rise to 14.3%. In February, the new orders index edged
down and the shipments index retreated after a strong gain in the prior month.
The inventory index rose to its highest level since last April. The index for
numbers of employees fell but the average workweek moved higher. The prices
paid index rose to 45.8% in February, its highest level since August 2008 but
the prices received index rose only slightly to 16.9%.
Confidence among builders for newly built, single-family homes has
remained at the same relatively low level for four consecutive months, according
to the National Association of Home Builders/Wells Fargo housing-market index.
The index remained at 16% in February. Results under 50% indicate that more
builders said conditions are poor than good. The last time the index was above
50% was in April of 2006. Among the three component indexes, two slightly gained
in February: present sales and sales expectations in the next six months. The
gauge for prospective-buyer traffic was unchanged. By region, there were gains
in the Northeast and South, while there were declines in the Midwest and West.
Monday, February 14, 2011 4:03 p.m est.
Was the market closed today, it might as well have been as trading
today had to be the slowest of the year midday! It was very quiet with the Dow
seeing lows of -40.00 points, S&P 500 -2.00 points and the Nasdaq Composite
-1.00 points first thing but tech stocks turned it around once again with the
Dow seeing highs of +5.00 points, S&P 500 +4.00 points and the Nasdaq Composite
+15.00 points. The S&P 500 can now check off that it has rallied 100% off
the bottom as it came within less than .62 of a point from its intraday low
in March 09! Like I always like to say, the market never goes down forever and
never goes up forever, except now of course, haha!
At the close the Dow was down by -5.00 points to 12,268.00, S&P
500 +3.00 points to about 1332.00, S&P 100 +2.00 points to 598.00 and the
Nasdaq Composite +8.00 points to about 2817.00. Oil was lower as it continued
lower down about -$.70 to about $85.00 now as there is a ton of oil out there
and with no disruptions it could pull back easily.
This is an expiration traded week and although people like to say they
are usually volatile, when you look at history they actually aren't but are
usually on the downside. February’s however have been more to the downside,
likely because traders are settled in after the New Year rush to get in so it
kind of makes sense. With a lot of economic data coming out this could be a
trigger or an excuse for some profit taking as volume is abysmal. So far it
doesn’t look like it will stay down however but another thing that the
month of February has to deal with is a long record of hard selling for no real
reason. Could be an interesting week in the end!
Friday, February 11, 2011 4:03 p.m est.
The market started the day lower once again on worries about Egypt
as President Mubarak came out last night and said he wasn’t stepping down
with the Dow seeing lows of -50.00 points, S&P 500 -6.00 points and the
Nasdaq Composite -15.00 points but when he came out and said he changed his
mind and that he would step down the market turned around with the Dow seeing
highs of +60.00 points, S&P 500 +9.00 points and the Nasdaq Composite +20.00
points on one of the worst volume days of the year! I have to say its killing
me watching the hourly volume numbers move lower and lower the higher and higher
the market goes. This has been going on for some time now and is setting the
market up for a big fall. The question is when it will happen and how far down.
Today the S&P 500 almost touched it’s 100% rally point of 1333.58
from its bottom in March 2009 of 666.79 by only three points so that will likely
get all those cycle and fibonacci people all excited! That’s quite a move
over the past 23 months! 27% of that rally has been in the past five months
alone with no corrections whatsoever! Another interesting point is that the
Nasdaq Composite is now testing its 2007 high at 2810! With the market moving
into expiration week it could be interesting because historically it has never
been a great one and sometime this volume problem is going to take its toll.
At the close the Dow was up by +45.00 points to 12,274.00, S&P
500 +7.00 points to about 1329.00, S&P 100 +3.00 points to 597.00 and the
Nasdaq Composite +19.00 points to about 2809.00. Oil of course was lower as
the Suez is now safe although there wasn’t any problems during this whole
crisis closing down about -$1.20 to about $86.50.
Consumer sentiment rose in February, reaching the highest level since
June, hitting 75.1%, up from a final January reading of 74.2%, according to
Thomson Reuters and the University of Michigan. Economists had expected a February
level of 75%. A final reading for February will be released in coming weeks.
The current-conditions index rose to 86.8% in February, the highest since January
2008, up from 81.8% in January. Meanwhile, the expectations gauge declined to
67.6% from 69.3%. Consumer confidence is slowly returning but that expectation
number doesn’t look good and should be rising not falling!
The Trade Deficit widened for the first time in four months in December
on higher oil imports but exports continued their upward trend and were nearing
record levels. The nation’s trade deficit expanded +5.9% in the final
month of 2010, to $40.6 billion from $38.3 billion in November, the government’s
data showed. This marked the first increase and the largest trade gap since
September, as the oil deficit hit its highest level since October 2008. Excluding
oil, the deficit actually improved. A widening of the deficit in December had
been expected, but analysts predicted a bigger increase. Economists had expected
the deficit to widen to $42.0 billion. For all of 2010, the trade deficit totaled
$497.8 billion, up +32.8% from 2009. Exports rose +16.6% to $1.83 trillion,
as imports increased +19.7% to $2.33 trillion. Economists said the final reading
on trade for 2010 might add slightly to growth for the fourth quarter. The government’s
already estimated that growth in the economy accelerated to a +3.2% annual rate
in the final three months of the year, with trade contributing more than three
percentage points. The trade data for December were not included in that forecast,
which is subject to revision.
Thursday, February 10, 2011 4:03 p.m est.
Well thank goodness we finally have something to talk about! The rise
in bond yields is starting to take effect in the mortgage market. According
to Reuters: "Data on Wednesday showed fixed 30-year mortgage rates averaged
5.13% in the week ended February 4th, up from 4.81% in the prior week. It was
the highest rate since the week ended April 9th, 2010, the Mortgage Bankers
Association said. The increase sapped demand for mortgages as the MBA's seasonally
adjusted index of mortgage applications, which includes both refinancing and
home purchase demand, fell -5.5% in the week."
The market started the day lower once again as Cisco’s earnings
last night were once again much lower than expected and their outlook was poor
because of government regulation. Lows were hit early on though with the Dow
seeing -90.00 points, S&P 500 -10.00 points and the Nasdaq Composite -30.00
points but this time the savior was that President Mubarack of Egypt was supposedly
stepping down. You would think oil would fall on this news but instead it rallied
along with the market and the final hour saw the S&P 500 and Nasdaq actually
move into positive territory.
At the close the Dow was down by -11.00 points to the 12,229.00, S&P
500 +1.00 points to about 1322.00, S&P 100 -1.00 points to 594.00 and the
Nasdaq Composite +1.00 points to about 2790.00. Oil was up about by +$.60 to
about $87.60.
So far Q4 earnings are looking good with about 70% of the S&P
500 reporting better than expected earnings and forecasts for 2011 are looking
for an all-time high of $1,017.44 a share. This is pretty good because the last
time S&P earnings were near $1,000, the S&P was at 1,550! The funny
thing is that valuation in 2007 when the market fell apart was based not just
on current earnings but on the expectations. At the time, earnings would grow
to $1,150 in 2008 and $1,300 in 2009. What actually happened is that the earnings
that were claimed by many banks and mortgage companies were fake! Of course
when the bank makes up numbers and the analysts believe them then valuations
can quickly get out of control because one bad year can wipe out several good
ones and it’s the risk of that potential bad year that is currently not
priced into some of todays valuations. In 2007 the banks claimed their loans
were good and real estate values were solid and that caused mortgage companies
to raise their forecasts which caused builders to raise forecasts and then land
and lumber then retailers such as Sears and so on went the wheel.
Now of course we are in a different situation with the deception now being the
Fed pumping money into the system with billions of dollars almost everyday in
the vague hope that jobs will trickle down. What’s interesting is that
QE1 didn’t do anything and QE2 isn’t really doing much except drive
up stock prices and helping the big banks make money. So with $15 trillion in
official debt by the end of this year and a $1.5 trillion annual deficit the
future is looking bleak in the long run. The big question is that when QE2 runs
out what will support the market then if earnings start being lowered because
economic growth isn’t there after all. This may turn out to be an interesting
year! Jobless Claims fell -36,000 to a seasonally adjusted 383,000, hitting
the lowest seen since July 2008. Economists had expected an initial-claims level
of 410,000 for last week. In recent weeks, weather has been behind some volatility
in the data. The four-week average of new claims, which some economist look
to because it smoothes out some volatility, fell -16,000 to a total of 415,500.
Continuing claims fell -47,000 to a total of 3.89 million while the four-week
average remained at 3.93 million. About 9.4 million people were getting some
kind of state or federal unemployment benefits last week. The question always
remains though, are they falling due to job creation or people just falling
off the board.
Inventories at wholesalers rose +1% in December. Economists were expecting
an of increase of about +0.5%. Inventories in November were revised to show
no change compared with the initial estimate of a -0.2% decline. Sales of wholesalers
rose +0.4%. The inventory-to-sales ratio was 1.16 in December.
Wednesday, February 9, 2011 4:03 p.m est.
Oh no, panic must have set in today as the Dow actually fell after
seven days up! Numerous times the index made it back into positive territory
however and in the end it made it back into positive territory in the end for
the eighth day in a row! Lows were hit midday with the Dow seeing -50.00 points,
S&P 500 -10.00 points and the Nasdaq Composite -20.00 points but the final
hour saw a bounce back.
At the close the Dow was up by +7.00 points to the 12,240.00, S&P
500 -4.00 points to about 1325.00, S&P 100 -1.00 points to 595.00 and the
Nasdaq Composite -8.00 points to about 2789.00. Oil was down by -$.10 to about
$86.90.
Tuesday, February 8, 2011 4:03 p.m est.
The market dipped a little this morning but once again it turned around
with highs made in the final hour with the Dow seeing +80.00 points, S&P
500 +6.00 points and the Nasdaq Composite +15.00 points on declining volumes
once again.
At the close the Dow was up for its seventh day in a row now, by +72.00
points to the 12,233.00, S&P 500 +6.00 points to about 1325.00, S&P
100 +3.00 points to 596.00 and the Nasdaq Composite +13.00 points to about 2797.00.
Oil was down by -$.40 to about $87.00.
You know there isn’t really a lot to say about this move as
the market just continues to press higher on weaker and weaker volume. I’m
not sure when it will correct but its like a rocket burning through its fuel
and eventually coming back to earth. I know this will happen sooner than later
but the question is, will it a be a soft landing or a crash!!!
Monday, February 7, 2011 4:03 p.m est.
The market continued its climb higher today on lower and lower volume.
As the market goes higher were now seeing the advance/decline moving sideways
to lower, the dollar actually higher and oil has been lower so its definitely
momentum keeping it going. This is not good as it means were setting up for
a fall which is really to bad! Not sure why people get in these modes because
its so unhealthy in the longer term but maybe this time will be different, ha,
ha, ha!
Highs were hit in the morning with the Dow seeing +100.00 points, S&P
500 +12.00 points and the Nasdaq Composite +30.00 points but as volume fell
the market pulled back. At the close the Dow was up for its sixth day now, first
time in three months by +70.00 points to the 12,162.00, S&P 500 +8.00 points
to about 1319.00, S&P 100 +4.00 points to 594.00 and the Nasdaq Composite
+15.00 points to about 2784.00. Oil was down by -$1.50 to about $87.50.
Friday, February 4, 2011 4:03 p.m est.
It was so interesting this morning listening to commentators on how
great the employment report was going to be around the +150,000 level! When
it came out at only +36,000 they flipped faster than a pancake but then flipped
again to decide to say how great it was because the unemployment number fell
to 9%, which was the lowest level since April 2009, from 9.4%. November and
December payrolls to show +40,000 more jobs created that previously estimated.
The problem is that about 500,000 people actually fell off the board which isn’t
good at all and that’s why unemployment fell, not because people went
back to work. The number of people unemployed for 27 weeks or more decreased
as a percentage of all jobless, to 43.8% from 44.3% but again most likely because
of people falling off the board. Average hourly earnings rose +0.4% or +.08
to $22.86 from $22.78 in the prior month which is good news though. The average
work week for all workers fell to 34.2 hours, from 34.3 hours the prior month
but that may have been weather related. The so-called underemployment rate which
includes part- time workers who’d prefer a full-time position and people
who want work but have given up looking fell to 16.1% from 16.7%.
The modest jobs gains are at odds with other data for January, which had suggested
employment growth was picking up and had raised hopes that the manufacturing-driven
recovery was now spreading to other sectors of the economy. Despite the small
increase in payrolls, the jobless rate, which is calculated from a separate
survey, fell to 9% from 9.4% in December. Private hiring, which excludes government
agencies, rose +50,000 in January. Factory payrolls increased by +49,000 in
January, exceeding the survey forecast of a +10,000 gain.
Yesterday the market was mostly flat but once again in the end it came
back to close a little higher for the day. This morning with all of the great
news out it was hard to decide once again to pick a direction even though the
news wasn’t good! HIghs were hit in the first few minutes of trading with
the Dow seeing of +25.00 points, S&P 500 +3.00 points and the Nasdaq Composite
+15.00 points but just about as quick lows were seen with the Dow seeing lows
of -40.00 points, S&P 500 -5.00 points and the Nasdaq Composite -15.00 points!
It seemed to be the rational time to correct but once again going into the final
hour the market was at previous highs.
At the close the Dow was up for its fifth day by +30.00 points to the
12,092.00, S&P 500 +4.00 points to about 1311.00, S&P 100 +.60 points
to 590.00 and the Nasdaq Composite 15.00 points to about 2769.00 once again
on even more pathetic volume than pathetic volume. Oil was down pretty hard
today because nothing bad happened in Egypt and another reason may have been
because it was announced that America and Canada are getting together to talk
about running a pipeline from Alberta down to Texas. That would likely kill
the price of oil as there is so much oil in the tar sands it could put Saudi
Arabia out of business! Oil closed lower by about -$1.50 remaining around the
$89.00 level.
Once again recent insider data reveals that company officials aren’t
buying any of their stock, only selling with Google being the worst and even
the much touted Apple is seeing more selling than buying! There is no way to
put this in a positive picture! At best, the activity of insiders has been dismal,
at worst, their preference to sell is absolutely terrible! Three months ago
it was the very worst activity we have ever seen amongst insiders of the top
companies in the Nasdaq Composite. Unbelievably, it’s even worse now.
Last time there were 2 buyers for 238 sellers. Now it’s one lone buyer
and 222 sellers. Last time, 9500 shares were purchased versus 88.9 million sold.
This time, only 3500 shares were purchased and 87.4 million sold. The average
P/E was 26.5, 47% higher than the S&P 500 P/E ratio and they trade at 4.6
times sales, an extraordinarily high valuation. This is where its good to be
Apple as they have a great P/E ratio. However, for the week ended January 14th,
Bloomberg reported absolutely no buys for insiders of the S&P 500 companies
and total sales of $163 million in stock. I can’t remember ever seeing
this before. Now, two weeks later, the ratio was 2842 to 1. It seems to explain
why volume is so low overall in the market and why the only thing seemingly
helping to hold up the market is the Fed’s printing press! Basically if
insiders want no part of the companies they work for, why would the public?
Yesterday it was reported that even with the inclement weather and
sputtering economy, shoppers turned out in healthy numbers last month, pushing
retail sales well past most expectations. The 28 retailers that reported January
same-store sales, those are outlets open at least a year, posted a +4.2% gain,
well above the +2.7% average estimate of analysts looking for a +3.3% rise.
Jobless Claims fell last week by -42,000 to 415,000, reversing most
of the increase from the prior week. Economists had expected them to drop to
a seasonally adjusted 418,000 from an upwardly revised 457,000 the week before.
Continuing claims, which reflect the number of people already receiving unemployment
compensation, fell -84,000 to a seasonally adjusted 3.93 million. About 9.3
million people were getting some kind of state or federal benefits, down -112,000
from the prior week.
The productivity of businesses climbed a seasonally adjusted +2.6%
in the fourth quarter. The quantity of goods and services produced, known as
real output, grew at an annualized rate of +4.5%, while hours worked rose +1.8%.
Productivity is calculated by dividing real output by hours worked. Economists
thought productivity would increase +2.2% in the final three months of 2010.
Productivity rose a revised +2.4% in the third quarter.
The Institute for Supply Management's services index rose to 59.4%
in January, compared with 57.1% in December, pointing to a faster pace of expansion.
Analysts had expected a reading of 57.3% for January. Readings above 50% indicate
that the non-manufacturing sector economy is "generally expanding,"
according to ISM.
Wednesday, February 2, 2011 4:03 p.m est.
Interesting data out this morning from the National Employment Law
Project who said the quality of jobs that have been created this past year,
about 80%, have mostly been in low and mid-wage jobs from $8.00 to $10.00, in
retail, food prep and cashiers. This is a huge contrast to the 2001 recession.
Six of twenty three industries showed job declines in 2010. At the same time
it was interesting to hear from an oil analyst in Alberta that said 30% of the
worlds oil supply was created in North America in the 70’s whereas today
it is only 7% and by the end of the year will be a record low 6%! Hey at least
we can say we’re environmental, it seems smart to let the countries who
have fewer regulations pollute their own countries right,,,,, as long as its
not here,,,,,, right......... something to think about!
The market was a bit lower this morning even though S&P downgraded
Ireland to A- and Moody’s cut Egypt’s debt rating! The Dow saw lows
of -20.00 points, S&P 500 -5.00 points and the Nasdaq Composite -10.00 points!
Of course the market came back because its easier to ignore bad news and the
Dow saw highs of +10.00 points, S&P 500 +1.00 point and the Nasdaq Composite
+5.00 points. In the end it pulled back once again so at the close the Dow was
up by +1.00 points to the 12,040.00 level, S&P 500 -4.00 points to about
1304.00, S&P 100 -2.00 points to 588.00 and the Nasdaq Composite -1.00 points
to about 2750.00. Oil was mostly flat closing a bit lower by about -$.40 remaining
around the $91.00 level.
Private-sector employment rose +187,000 in January, according to Automatic
Data Processing Inc employment report. Employment in the service-producing sector
rose +166,000, while employment in the goods-producing sector rose +21,000.
For December, ADP reported that private payrolls gained +247,000, compared with
a prior estimate of +297,000. On Friday, the government will report on January's
employment report, which also include government workers, and economists looking
for a gain of +150,000, and for the unemployment rate to rise to 9.5%. For December,
the government reported that employment gained +103,000, while the unemployment
rate fell to 9.4%.
Meanwhile the ADP report was way off last month but a clue was the
Challenger report and this morning it revealed that the slow pace of downsizing
that marked the second half of 2010 appears to be continuing into 2011, as employers
announced plans to cut -38,519 jobs in January. While that is an increase from
the previous month, it marks the lowest January total on record, according to
the report released Wednesday by global outplacement consultancy Challenger,
Gray & Christmas, Inc. January job cuts were up +20% from December, when
planned layoffs totaled 32,004; the lowest monthly figure since June 2000 (17,241).
Compared to a year ago, however, last month’s job cuts were down sharply,
falling -46% from the 71,482 job cuts recorded in January 2010.
The 38,519 job cuts last month represents the lowest January total
since Challenger began tracking monthly layoff announcements in 1993. Historically,
January is the heaviest job-cut month. From 1993 through 2010, employers announced
an average of 104,560 job cuts to start the year. October, the next best job-cut
month, saw an average of 84,218 cuts over the same period.
Tuesday, February 1, 2011 4:03 p.m est.
The market was higher once again today for no real reason except that
it was the first day of the month so window dressing seemed to be in play. The
Dow saw highs of +170.00 points, S&P 500 +23.00 points and the Nasdaq Composite
+60.00 points in the final hour. At the close the Dow was up by +150.00 points
to the 12,040.00 level, S&P 500 +21.00 points to about 1308.00, S&P
100 +10.00 points to 590.00 and the Nasdaq Composite +51.00 points to about
2751.00. Oil closed lower by -$1.40 around the $91.00 level.
Conditions for the nation's manufacturers improved for the 20th straight
month, the Institute for Supply Management reported today with the ISM index
rising to 60.8% from 58.5% in December. This is the highest level of the factory
index since last May and was much stronger than expected. The estimates were
for the index to remain steady at 58.5%. Readings above 50 indicate expansion.
The key employment index improved to 61.7% from 58.9% in December. New orders
jumped to 67.8% from 62% in the prior month. The one bad thing about the report
was that Input prices soared with the price index jumping to 81.5% from 72.5%
in the prior month. But of course I’m sure the government will be able
to straighten things out with the CPI later in the month.
Construction spending fell -2.5% in December, marking the second decline
in a row. Economists had forecast spending to rise +0.1%. Spending for November
was also revised lower, to a decline of -0.2% from an originally reported gain
of +0.4%. For all of last year, construction spending ended up +10.3% lower
compared to 2009.
Monday, January 31, 2011 4:03 p.m est.
The market started the day higher even after Globex futures hit new
lows overnight but rebounded after European markets were mixed. The buying dried
up pretty quick however and another sell off ensued with only slight lows with
the Dow off -10.00 points, the S&P 500 -1.00 points and the Nasdaq Composite
-10.00 points after Intel came out and lowered their revenue numbers for the
year. It didn’t last long once again however as it is month end so the
market rallied with the Dow up +70.00 points, S&P 500 +11.00 points and
the Nasdaq Composite +20.00 points. The final hour saw the market move back
near highs.
At the close the Dow was up by +70.00 points to the 11,891.00 level,
S&P 500 +10.00 points to about 1286.00, S&P 100 +4.00 points to 579.00
and the Nasdaq Composite +13.00 points to about 2700.00. Oil started the day
on the downside but $100 oil called again so it was up just about +$3.00 to
close around the $92.00 level.
The first month of the year has been a very good guide for the rest
of the year although you can only take it with a grain of salt but the stats
are interesting. This January was up about +2.5%. When January is positive the
rest of the year has been positive 82% of the time, averaging a return of 10%.
If January is negative, then the average return is just about 2% and is positive
only half the time. In the shorter time frame I looked to see if the January
Barometer works for predicting February. Once again, January's momentum seems
to carry forward because if January is positive, February averages a gain of
+.50% and if it's negative, then February averages a loss of about -1%.
One thing that could heat up in February is American debt levels and
if the Obama administration didn't have enough problems, the next shoe might
be the collapse of the Afghan banking system, where the losses at Kabul's leading
bank may be as high as $900 billion according to a report. That means that there
is nearly one trillion dollars that can't be found. Banking "experts"
are now expecting a possible "run on solvent banks, destroying the country’s
banking system and shaking the confidence of Western donors already questioning
the level of their commitment to Afghanistan," says the New York Times.
The situation, according to the Times is a result of "fraud and mismanagement"
which could lead to the "collapse" of the bank and a "broad financial
panic in Afghanistan" according to American, European and Afghan officials
who spoke to the New York Times.
Perhaps the most troubling aspect of the situation is the notion that
"Investigators and Afghan businessmen believe that much of the money has
gone into the pockets of a small group of privileged and politically connected
Afghans, preventing earlier scrutiny of the bank’s dealings." In
other words, there may be government officials, and as previous indications
have implied, the government and perhaps even President Hamid Karzai, and/or
his family may be involved. The latter would be difficult to prove, and would
have even wider repercussions if proven to be true.
The Institute for Supply Management-Chicago said its gauge of business
activity rose to 68.8% from 66.8% in December, indicating another month of expansion,
though at a faster pace. Economists had expected a reading of 65% in January.
Any reading above 50% indicates expanding activity.
Consumer spending increased a seasonally adjusted +0.7% in December,
above expectations and a sign the economy entered the first quarter with momentum.
With many households still deeply in debt, the key factor regarding the outlook
for consumers spending will be the recovery of the labor market. Consumer spending
has risen in six straight months. Income rose +0.4% in December for the second
straight month. Economists had expected a +0.4% increase in income and a +0.6%
gain in spending. With spending outpacing income, the savings rate fell to 5.3%
from 5.5% in November, sadly the lowest level since last March!
Inflation picked up slightly in December, while prices continued to
moderate at the core level excluding food and energy prices. The personal consumption
expenditure price index rose +0.3%, up from a +0.1% increase for November. Inflation
is up +1.2% in the past year, up from +1.1% in November. The core PCE was flat
in December after a +0.1% increase in November. Over the past year, core inflation
rose +0.7% compared with a +0.8% gain in the prior month. This is a record low
in terms of the annual rate for core prices. The Fed is worried that another
negative shock could push the economy into deflation, where prices and wages
decline.
Friday, January 28, 2011 4:03 p.m est.
The market started the day higher ignoring all negative news geopolitically
and poor earnings from Ford, Amazon and average earnings from microsoft because
who cares if oil may not be able to move through the Suez Canal! On a completely
different note, but one which I think had a major effect also, was that reality
seemed to finally set in when the Nasdaq started to finally show where its index
was trading. For 45-minutes the index wasn’t displaying changes in the
index even though stocks were trading and the market seemed to start to sell
off when Nasdaq officials announced that they didn’t really know why it
wasn’t working. That and the fact that riots got even worse in Egypt after
the government tried to put on a curfew, took the market down hard. Lows were
hit again in the final hour with the Dow off -190.00 points, the S&P 500
-24.00 points and the Nasdaq Composite -80.00 points. One thing for sure is
that the end of the month could see some interesting trading if things continue
to blow up in Egypt.
At the close the Dow was down by -166.00 points to the 11,824.00 level,
S&P 500 -23.00 points to about 1276.00, S&P 100 -10.00 points to 576.00
and the Nasdaq Composite -68.00 points to about 2687.00. Oil rallied pretty
good today because of the possibility of the Suez Canal being shut down up about
+$4.00 to close around the $89.00 level.
The economy accelerated in the fourth quarter, with Real gross domestic
product up at a +3.2% annualized rate and up from a +2.6% rate in the third
quarter. The gain was slightly below expectations as economists expected Q4
GDP to rise at a +3.5% rate. The big story for the fourth quarter was the pickup
in consumer spending. Spending rose at a +4.4% annual rate in the final three
months of the year, the fastest pace since the first quarter of 2006. Inventories
were a big drag on growth in the fourth quarter but this was largely offset
by a positive contribution from net exports. For the year, GDP advanced +2.9%,
compared with a +2.6% drop in 2009. This is the strongest growth rate in five
years.
A gauge of consumer sentiment fell in January on concerns about rising
food and fuel prices, according to Thomson Reuters and the University of Michigan.
The final January reading showed that the consumer sentiment index eased to
74.2% from 74.5% in December. An earlier reading for January estimated that
the index had dropped to 72.7% because of higher gas prices. “Given that
consumers do not anticipate renewed wage growth, they are likely to again engage
in selective spending cutbacks,” said Richard Curtin, chief economist
with the consumer survey, in a statement. “Consumers are now less able
to smooth consumption by using credit cards since fewer households now have
credit cards and those that have them are likely to have lower credit limits,”
he said. Economists had expected a final January reading of 73.5%. The current-conditions
index fell to 81.8% from 85.3% in December, led by less favorable views of buying
conditions for durables, according to the Michigan report. Also, half of consumers
expected that their incomes, adjusted for inflation, will endure small declines
this year, according to the report. Meanwhile, the index of consumer expectations
rose to 69.3% from 67.5% in December, with anticipations for a stronger economy
this year, according to the report.
Thursday, January 27, 2011 4:03 p.m est.
Guess what, the market was up today with the Dow seeing highs of +45.00
points, the S&P 500 +5.00 points and the Nasdaq Composite +30.00 points.
After some profit taking that took the Dow and S&P a bit lower, it rallied
again in the final hour after microsoft released their earnings a bit earlier
than expected initially but the final minutes of trading saw selling once again.
At the close the Dow was up by +4.00 points to the 11,989.00 level,
S&P 500 +3.00 points to about 1299.00, S&P 100 +1.00 points to 586.00
and the Nasdaq Composite +16.00 points to about 2755.00. Oil was lower all day
closing down about -$1.70 to close around the $86.00 level.
Volume right now in the S&P 500 futures market is almost lower
during the day than overnight which is a scary thing to see as it means that
not only the Smart Money has quit buying but the hedge funds are also losing
interest so we’re still due for a pullback here. Commodities continue
to retract after their run also which isn’t good.
One of the things that should have brought the market down was that overnight
Japan’s credit rating was cut for the first time in nine years by Standard
& Poor’s. It was because of persistent deflation and political gridlock
that undermined efforts to reduce a 943 trillion yen ($11 trillion) debt burden.
The world’s most indebted nation is now ranked at AA-, the fourth-highest
level, putting the country on a par with China, which likely passed Japan last
year to become the second-largest economy. The government has been struggling
for decades now with its nation’s debt, the rating company said in a statement.
The outlook for the rating is stable, S&P said but still.... The yen and
bond futures fell on concern the downgrade will push up the cost of borrowing
for Japan, where public debt is about twice the size of gross domestic product.
Vice Finance Minister Fumihiko Igarashi this week said the government must fix
its finances to avoid a debt crisis that could trigger a “global depression.”
I know, it sounds very familiar to here and yes that's where we’re headed
but the good news is we still have time to fix it...
Jobless Claims jumped last week by +51,000 to 454,000, partly because
poor weather caused administrative backlogs in four Southern states. A labor
spokesman said snowstorms earlier in the month forced unemployment offices in
Alabama, Georgia, North Carolina and South Carolina to open fewer hours and
process fewer claims. A reduction in the backlog contributed to the sharp increase
in new claims, the spokesman said. Economists had expected initial claims to
rise to a seasonally adjusted 408,000 from a revised 403,000 the week before.
Continuing claims, which reflect the number of people already receiving unemployment
compensation, rose +94,000 to a seasonally adjusted 3.99 million. About 9.41
million Americans were getting some kind of state or federal benefits, down
-223,826 from the prior week. The funny thing is you would expect claims to
go down because of the storm not up so that’s interesting!
Orders for Durable goods fell in December, falling -2.5% on weaker
demand for airplanes, vehicles, and computers, machinery. Excluding transportation,
orders rose +0.5% but the decrease was unexpected. Economists expected a +1%
rise in durables. This is the fourth drop in durables in the last five months.
Transportation orders had the largest decline, falling -12.8% while shipments
rose +1.4% in December. Orders for core capital goods rose +1.4% in the month.
Pending home sales rose +2% in December for the fifth increase in the
past six months. The National Association of Realtors said its pending home
sales index rose to 93.7% from a downwardly revised 91.9% in November. The index
is still -4.2% below the level in December 2009, however. The data reflects
contracts and not closings, which normally occur with a lag time of one or two
months. The index is based on a large national sample, typically representing
about 20% of transactions for existing-home sales.
Wednesday, January 26, 2011 4:03 p.m est.
The market was higher once again today as traders waited for the Fed’s
decision on interest rates at 2:15est. The Dow finally saw 12,000 with highs
of +45.00 points but Boeing was off strongly which held the index back, the
S&P 500 saw +9.00 points and the Nasdaq Composite +30.00 points. It turned
mixed pretty quick though and after the Fed came out keeping interest rates
the same but made the comment that; “progress on the economy is disappointingly
slow.”
At the close the Dow was up by +8.00 points to the 11,985.00 level,
S&P 500 +5.00 points to about 1297.00, S&P 100 +2.00 points to 585.00
and the Nasdaq Composite +20.00 points to about 2740.00. Oil was up all day
closing up about +$1.00 to close around the $87.00 level.
The Fed’s Open Market Committee made no policy changes, holding
its key interest rate at historic low range of 0% to 0.25% and continuing on
course with its $600 billion program of Treasury purchases or QE2 which helps
to support stocks. The decisions were widely expected as we now have a few new
members voting. They only made a few changes to the language of the policy statement
it issued in December. Overall, the Fed said that underlying inflation is still
trending lower, despite rising commodity prices because the Fed is comprised
of robots that don’t need to eat and they don’t need gas for vehicles
because for them walking is nothing. While the economy was recovering, the rate
was still insufficient to bring about a significant improvement in labor market
conditions, the statement said. The vote by the committee was unanimous.
Sales of new single-family homes rose in December to an annual rate
of 329,000 on a seasonally adjusted basis, the highest level since April when
a federal tax credit gave the market a temporary help. About 85% of the new
sales took place in the South and West. Nationwide sales in November, however,
were revised down to +280,000 from an initial reading of +290,000. Economists
had forecast new home sales to rise to +299,000 in the final month of 2010.
For the full year, new home sales totaled +321,000, down -14.4% compared to
2009. The median price of new homes climbed to $241,500 in December from $215,500
in November. The supply of new homes available fell to 6.9 months at the current
sales rate from 8.4 months in the prior month, the lowest level since April.
Tuesday, January 25, 2011 4:03 p.m est.
The market started the week on the upside with the Dow finishing the
day higher by +100 points, S&P 500 +8.00 points, but today saw some heavy
selling in commodities along with oil and the dollar was rallying, so it started
the day lower. Lows were hit early in the morning but after a rally it fell
back to new lows with the Dow off -80.00 points, S&P 500 -10.00 points and
the Nasdaq Composite -25.00 points. Buying in the final hour brought it back
though and closed mixed.
At the close the Dow was down by -3.00 points to the 11,977.00 level,
S&P 500 +.40 points to about 1291.00, S&P 100 +.40 points to 583.00
and the Nasdaq Composite +3.00 points to about 2719.00. Oil was lower all day
closing down about -$1.65 to close around the $86.00 level.
The prices of single-family homes in 20-major cities fell a non-seasonally
adjusted -1% in November, according to the S&P/Case-Shiller home price index.
This is the fourth straight monthly decline. Prices have moved down -1.6% in
the past year and this is the second consecutive month where annual growth rates
decelerated. Home prices declined in 19 of the 20 areas tracked by Case-Shiller
compared with October. From Case Shiller: “With these numbers more analysts
will be calling for a double-dip in home prices. Let’s take a moment to
define a double-dip as seeing the 10- and 20-City Composites set new post-peak
lows. The series are now only 4.8% and 3.3% above their April 2009 lows, suggesting
that a double-dip could be confirmed before Spring. Certainly eight cities setting
new lows, and with the only positive news concentrated in southern California
and Washington DC, the data point to weakness in home prices,” says David
M. Blitzer, Chairman of the Index Committee at Standard & Poor’s.
“With an annual growth rate of +3.5% in November, Washington DC was the
strongest market, but still well below the +7.7% annual rate of growth seen
in May 2010. The only city with a gain in November was San Diego, up a scant
0.1%. While San Diego, Los Angeles and San Francisco are still ahead from November
2009, their annual rates are shrinking in recent months.
“Looking at the monthly statistics, 19 of 20 MSAs and both Composites
were down in November over October. Fourteen MSAs and both composites have posted
at least four consecutive months of decline with November’s report. Thirteen
of the MSAs and the 20-City Composite fell by 1.0% or more in November. While
not always consecutive months, 13 of the MSAs and both composites have posted
at least seven months of decline since the beginning of 2010. These markets
saw home prices fall more than half the months reported in 2010 so far.”
Consumer confidence jumped to 60.6% in January, reaching the highest
level since May, with more consumers optimistic about income and jobs, as well
as current business conditions, the Conference Board reported. Economists had
expected a confidence reading of 54.8%. Confidence in December reached an upwardly
revised 53.3%, compared with a prior estimate of 52.5%. A barometer of consumers
expectations rose to 80.3 in January from 72.3 in December. Meanwhile, consumers
assessment of the present situation increased to 31%, the highest level in more
than a year, from 24.9%. The Conference Board's index helps analysts compare
fluctuations in confidence, with a reading of 100% for the base year of 1985.
Generally when the economy is growing at a good clip, confidence readings are
at 90% and above.
Friday, January 21, 2011 4:03 p.m est.
Of course with it being an expiration traded day the market shot out
of the gate this morning to give the S&P 500 a strong expiration number
of 1289.25! Highs of course were hit in the first few minutes of trading with
the Dow seeing highs of +85.00 points, S&P 500 +11.00 points and the Nasdaq
Composite +20.00 points but as the day wore on the Nasdaq turned into the red
as Apple once again fell. It saw lows of -20.00 points in the final hour but
the Dow and S&P 500 remained higher.
At the close the Dow was up by +49.00 points to the 11,872.00 level,
S&P 500 +3.00 points to about 1283.00, S&P 100 +2.00 points to 580.00
and the Nasdaq Composite -15.00 points to about 2689.00. Oil was flat all day
closing down about -$.40 to close around the $89.00 level.
Well this looked like it was going to be just another up week in the
beginning marking the eighth week in a row for the S&P 500! In the end it
looks like the streak ends at seven but barely. It seems that a huge part of
the run up we have seen was for great earnings and now that we’re seeing
them the market is consolidating those gains creating volatility. Volatility
usually comes before a change in the trend. After nice gains over the last six
months, some kind of correction or consolidation should come as no surprise.
From the looks of it a correction is at hand however there are two types of
corrections, one is the obvious, the market falls usually to some type of support,
and then at time the market just moves sideways for a period of time. This is
perfect for our style of trading. After huge moves that we have seen breaking
through various overhead resistance this is likely the case. Whenever the market
has moved up this strong for a prolonged amount of time it rarely ever does
an about face right away anyhow. Another factor is that the Fed continues to
pile money in to help support the market as they don’t want to see much
downside. When QE2 ends we may see a difference but until then at the least
we will likely just see normal corrections.
Thursday, January 20, 2011 4:03 p.m est.
The market continued lower this morning mostly from profit taking mostly
in commodity stocks such as oil being off -$2.00. Lows were hit early in the
morning but with the Dow off -80.00 points, S&P 500 -11.00 points and the
Nasdaq Composite -40.00 points as Apple was down once again. Of course with
it being expiration tomorrow and that the market was off about -2% from highs
made on Tuesday, it was time for a rally so the market actually made it into
positive territory for a brief time but by the close it sold off once again.
At the close the Dow was down by -3.00 points to the 11,823.00 level,
S&P 500 -2.00 points to about 1280.00, S&P 100 -.00 points to 577.00
and the Nasdaq Composite -21.00 points to about 2704.00. Oil was lower all day
closing down about -$2.00 to close around the $89.00 level.
Sales of existing homes jumped +12.3% in December, an encouraging end
to the worst year since 1997, as the collapse in house prices and a wave of
foreclosures depressed activity over the 12-month period. The National Association
of Realtors said existing-home sales rose from November's upwardly revised 4.7
million rate to a seasonally-adjusted annualized rate of 5.28 million, beating
estimates of 4.88 million. The jump in the mortgage rate to 4.8%, a rise of
roughly a half percentage point from depths, has helped get people back into
the market. The annual tally of sales was 4.91 million, a drop of -4.8%, based
on preliminary data. The median price of existing homes in December fell -1%
to $168,800, the lowest since February, and November prices were marginally
revised lower to $170,200. Over the year, prices edged up +0.3% to $173,000,
which was well below the $198,100 of 2008 and the $219,000 price in 2007.
The index of manufacturing activity in the Philadelphia region fell
slightly in January, the Fed’s Bank of Philadelphia reported. The Philly
Fed business condition index fell to 19.3% from 20.8% in December. The decline
was a bit weaker than expected. Below the headline, the report had some strong
signals. The index for new orders jumped to 23.6% from 10.6% in December. The
index for employment also jumped to 17.6% from 4.3% in the prior month. The
one bad part of the report was that prices paid jumped strongly.
Wednesday, January 19, 2011 4:03 p.m est.
The market today saw that much needed correction occur even though
Apples and IBM’s earnings were sensational last night. As the night moved
on though Globex futures slowly lost ground and by this morning they were in
negative territory. Apple started the day strong moving over $350.00 at one
point but by the close was down almost -$2.00 to $339.00 after losing about
-$8.00 on the news yesterday that Steve Jobs was taking a leave of absence.
The earnings they put out were incredible so one can only assume that the huge
run up the stock has had was mostly discounting these earnings. Its always good
to consolidate gains anyhow and that may be what were seeing in the overall
market now that we are full on in earnings season.
Lows were hit in the final hour with the Dow off only -45.00 points
as IBM helped to support the index as it was able to hold its gains. The S&P
500 sold off pretty good, off -16.00 points because of Apple and Goldman Sachs
earnings weren’t very good and that hurt the banking sector. The Nasdaq
Composite saw lows of -50.00 points because of Apple and plain old profit taking.
At the close the Dow was down by -13.00 points to the 11,825.00 level,
S&P 500 -13.00 points to about 1282.00, S&P 100 -5.00 points to 577.00
and the Nasdaq Composite -41.00 points to about 2725.00. Oil was lower all day
closing down about -$.65 to close around the $91.00 level.
Construction of New Homes fell -4.3% to an annualized rate of 529,000
in December, but permits jumped +16.7%. Economists had expected housing starts
in December to drop to 545,000 on a seasonally adjusted basis. Yet permits for
new construction, viewed as a more accurate gauge of home building, jumped to
an annualized rate of 635,000 in December the highest level since last March,
from a revised 544,000 in November. Housing starts in November were little changed.
Tuesday, January 18, 2011 4:03 p.m est.
Today could have been a real ugly day as Apple reported over the weekend
that Steve Jobs would be taking a leave of absence once again from Apple so
the stock was selling off strongly yesterday overseas. There was also news out
first thing that Citibank didn’t have great earnings so the market opened
lower. Of course it turned mixed pretty quick and the S&P 500 only ended
up seeing lows of -4.00 points and the Nasdaq Composite -5.00 points. Midday
it all turned positive with the Dow seeing highs of +75.00 points, S&P 500
+3.00 points and the Nasdaq Composite +15.00 points in the final hour because
traders were anticipating incredible earnings from Apple so after hitting lows
of -$22.50 of course it was going to rally to close with only a loss of -$8.00!
At the close the Dow was up by +50.00 points to the 11,838.00 level, S&P
500 +2.00 points to about 1295.00, S&P 100 +.00 points to 582.34 and the
Nasdaq Composite +11.00 points to about 2765.00. Oil was flat all day closing
down about -$.20 to close around the $91.50 level.
This is an expiration shortened trading week so volatility will likely
start to kick in starting tomorrow and if we are tracking anything like last
January we’ll likely really see it kick up as were getting more and more
bad news but the market isn’t reacting to it. Apple reported pretty decent
earnings after the bell but so far the stock is flat to down while IBM also
had great earnings and is higher but Globex S&P 500 futures are actually
a bit lower. It seems that part of this run up may have discounted earnings!
Tomorrow could be an interesting day!
Economic data didn’t help today either. Conditions for manufacturing
in the New York region improved slightly in January from December, the New York
Fed said. The bank's Empire State Manufacturing index rose to 11.9% from a revised
9.9% in December. Economists had forecast the index would rise to 13% however.
Indexes for new orders, shipments and employment improved in January. Both the
prices-paid and the prices-received indexes jumped in January. After a sharp
decline in December, the index for inventories rose above zero. A gauge of future
activity jumped to its highest level since early last year, suggesting that
manufacturers expect conditions to improve over the next six months but since
then it has remained flat to down.
The National Association of Home Builders/Wells Fargo housing market
index, which measures confidence in the market for newly built single-family
homes, stayed at 16% in January for the third straight month. Economists had
expected the gauge to pick up a point, to 17%, and the figure is in weak territory
in any event. The seasonally adjusted index is designed so that any number over
50% indicates that more builders view conditions as good than poor, which hasn't
been the case since April 2006. Subcomponents on current sales conditions and
sales expectations for the next six months were unchanged, while the subcomponent
gauge traffic of prospective buyers edged up a point.
Friday, January 14, 2011 4:03 p.m est.
The market started the day quietly as economic data was again not that
good. The Dow only saw lows of -30.00 points, S&P 500 -3.00 points and the
Nasdaq Composite -10.00 points because once again buyers pulled it back up on
even worse volume then yesterday. The Dow saw highs of +65.00 points, S&P
500 +9.50 points and the Nasdaq Composite +20.00 points in the final hour. At
the close the Dow was up by +55.00 points to the 11,787.00 level, S&P 500
+9.50 points to about 1293.00, S&P 100 +5.00 points to 582.00 and the Nasdaq
Composite +20.00 points to about 2755.00. Oil was up slightly on the day closing
up about +$.50 to close around the $91.50 level.
By the way the market is closed on Monday.
Part of the reason for the push today may have been because January
expiration weeks have always been rough ones so this way there is lots of support
back at the 1260 to 1275 level on the S&P 500 so it could fall to there
and still see an uptrend. Bullishness is at record levels not seen at any other
time since just before Black Monday in 1987, the currency debacles in 1998,
9/11, and the start of the 2008 bear market! We’re not just talking a
little under either, the index is way lower. The closest number before that
was just before the 87 crash! All of this while volume is at 3-year lows! But
heh as long as we have the TradeBots in control I guess its wrong to be a bear,
until it really falls of course! The scary thing is that stats behind this bull
market are even more remarkable than the rally itself appears. The S&P 500
has been above the 10-day average for 30-days straight and above the 50-day
average for 92-days straight. With the recent move in the S&P, the market
has gone for 92-days without closing below its 50-day average, which has been
seen only 17 other times since 1928 and most interesting is that the market
has not closed below the 10-day moving average once during the past 30-days
and this has never happened before, in 82 years of history! It’s great
to see a rally but I always get nervous when you don’t see any volatility!
The consumer price index increased +0.5%, driven by a +4.6% gain in
energy prices, the fastest increase in energy prices in more than two years.
Other price increases were more moderate. Food prices rose +0.1%. The core CPI,
which excludes food and energy costs, rose +0.1% in December. The CPI report
was in line with expectations. In 2010 the CPI rose +1.5%. The core rate was
up a record low +0.8%. These numbers are getting so ridiculous because you know
there is more inflation than this but because of how the Fed weights the components
it remains lower. Fuel alone is up +16.5% for the year, food +1.5% and that
seems low, medical care up +3.4%, transportation up +2.8%, but that is all offset
by a -1.1% drop in apparel which has a much higher weighting, a -2.8% decline
in natural gas, and a -0.2% decline in new car prices. So, other than natural
gas, the things you have to buy every day carry very little weight while the
things you may buy once in a while are given more weighting. According to the
CPI report: "A deceleration in the gasoline index accounted for much of
the slowdown, as it increased +13.8% in 2010 after rising +53.5% in 2009."
Retail sales rose +0.6% in December, marking the sixth straight monthly
increase, as consumers bought more goods from online retailers, drug stores
and building-supply companies. Excluding the volatile automotive sector, retail
sales rose +0.5%. Economists had forecast total sales to rise by +0.8%, or a
slightly lower -0.7% excluding the auto segment. Auto sales often swing sharply
from month to month and can mask underlying retail trends. Retail sales in November,
meanwhile, were unchanged from the original reading of +0.8%. For all of 2010,
retail sales rose +6.6% compared to 2009.
An index of consumer sentiment unexpectedly fell in January, according
to the preliminary poll released by Thomson Reuters and the University of Michigan.
The index fell to 72.7% from 75.2%, compared to expectations of a rise to 76%.
Thursday, January 13, 2011 4:03 p.m est.
There was some pretty poor economic indicators this morning so the
market started lower and when the Philly Fed released a revised reading of its
business index to +20% from +26% the market sold off, sort of. Of course with
Apple moving higher the Nasdaq turned slightly positive by midday and the rest
of the market was flat. The strange thing today was that the dollar was getting
pounded but the market may have stayed lower as interest rates were backing
up quite a bit. Selling took hold in the final hour once again with the Dow
seeing lows of -60.00 points, S&P 500 -6.00 points and the Nasdaq Composite
-15.00 points but once again buyers pulled it back up on pathetic volume.
At the close the Dow was down by -24.00 points to the 11,732.00 level,
S&P 500 -2.00 points to about 1284.00, S&P 100 -1.00 points to 578.00
and the Nasdaq Composite -20.00 points to about 2735.00. Oil was lower all day
closing down about -$1.00 to close around the $91.00 level.
You know what’s strange is that looking at last weeks and today’s
economic data you can see that things aren’t moving all that fast out
there and I just glanced at an old indicator that everyone used to watch and
it is close to lows made in 08! The Baltic dry index has been falling off a
cliff since September, interesting! This is an index made up of shipping overseas
and what its looking like. It seems that movement we have been seeing in the
market the past month isn’t on fundamentals. I know I was convinced that
we would see a pullback at the start of the year but it has yet to appear. This
is the reason why its always smart to at least have a few trades on both sides,
up and down. Anyhow I think the reason has been because leverage is back in
hedge fund land. According to CNBC.com: "As of the end of 2010, hedge funds
have increased leverage to within 10% of pre-credit levels, according to a report
from UBS Prime Brokerage Services and have likely increased risk up even more
to start this year." CNBC added: "Gross leverage for funds has climbed
43% from the bottom reached after the collapse of Lehman Brothers in 2008 and
is up 13% in 2010, according to UBS. Risk-taking surged in the second half of
the year as hedge funds scrambled to avoid the fate of another year of underperforming
the S&P 500," being further spurred by the Fed's easy money policy.
What makes me worry is that if things go wrong we could see some wild volatility
once again. What’s worse is that it was recently reported that as much
as 70% of the current trading volume is computer driven which is already meager,
much of it of the variety known as "Flash Trading," where programs
and massive trades are executed at lighting speeds. Everyone remembers last
year’s "Flash Crash" so you know a market can collapse in minutes!
Jobless Claims were up +35,000 last week to 445,000, the highest level
in more than two months, as a government official attributed the sharp increase
largely to administrative backlogs. Economists had expected them to fall to
a seasonally adjusted 405,000. Last week’s claims were also revised up
by +1,000 to 410,000. The labor government said that many people don’t
file claims right away and state unemployment offices are open fewer hours,
leading to administrative delays. The four-week average rose a much smaller
+5,500 to 416,500 while continuing claims dropped by -248,000 to a seasonally
adjusted 3.88 million. The four-week average fell by -72,000 to 4.06 million.
The trade deficit narrowed by -0.3% in November to $38.3 billion. Economists
had expected a rebound in November after the sharp narrowing of the deficit
in October of almost 14%. The forecast was for a deficit of $40.3 billion. Exports
rose faster than imports in November. The trade deficit with China widened to
$25.63 billion in compared with $20.17 billion in the same month last year and
$25.51 in October. China's president Hu Jintao will come to Washington for a
state visit next week . The U.S. is running a $252 billion deficit with China
in the first eleven months of the year. In November, exports to China hit a
new record high, the government said.
Wholesale prices climbed +1.1% in December, largely owing to a spike
in gasoline prices. Core producer prices, which exclude the volatile food and
energy categories, rose a lesser +0.2%. Both figures are seasonally adjusted.
Economists had predicted a +1.1% gain in overall producer prices but a much
smaller +0.2% increase in the core rate. The core number tends to draw the most
attention of economists. Wholesale energy costs rose +3.7% in December, while
food prices increased +0.8%. Prices for core intermediate goods, viewed as an
important indicator of inflation, rose +0.4%.
Wednesday, January 12, 2011 4:03 p.m est.
Global warming, ya right! Today it was reported that 49 of 50 States
had snow and the one that you would think wouldn’t have snow was Hawaii
but it did in some upper volcanoes! The only State that didn’t was Florida!
We remain in this good news is good and bad news is good mode! Yesterday
one of the concerns of the market, even though it traded higher was that the
EU was having problems with default countries once again such as Portugal but
they stated overnight that they have no problem in paying their bills, they’ll
just borrow more and they proved it by selling a few bonds over 7% interest!
Aren’t those great rates, they obviously don’t have any problems
with such a low rate. Oops, sorry that's actually not so low and on the rise
but heh, you get what you get! If America did that it would cost over $1 trillion
in interest annually but because they were actually able to sell all of them
the market started the day higher! The Dow saw highs of +110.00 points, S&P
500 +12.00 points and the Nasdaq Composite +20.00 points and held it into the
close. Once again however this move up was on even lower volume. This uptrend
in a thinly traded mode is showing a lot of desperation and doesn’t have
the appearance of a genuine rally. I think a -2 to -5% correction could occur
with any whiff of bad news now and would be healthy.
At the close the Dow was up by +84.00 points to the 11,755.00 level,
S&P 500 +12.00 points to about 1286.00, S&P 100 +5.00 points to 579.00
and the Nasdaq Composite +20.00 points to about 2737.00. Oil was higher all
day closing up about +$.75 to close around the $92.00 level.
Some signs are emerging that the labor market at long last may be getting
better although last weeks information was mixed. According to the latest report
on economic conditions across the country the Fed said. "Labor markets
in most districts appear to be firming somewhat," the Fed report, known
as the Beige Book reported. Overall, the Beige Book reported evidence that the
economy was expanding moderately through the end of the year, led by improved
conditions in manufacturing, retail and non-financial services. Most Fed districts
said that businesses were upbeat but cautious about the outlook.
Import prices rose +1.1% in December, on higher prices for fuel and
non-fuel imports. Prices for fuel imports rose +4.1% in December, while prices
for non-fuel imports gained +0.3%. December's result matched expectations of
economists. Import prices rose an upwardly revised +1.5% in November, compared
with the prior estimate of a +1.3% gain.
Tuesday, January 11, 2011 4:03 p.m est.
Yesterday was pretty quiet in the market starting down pretty hard
in the morning but by days end it was only down slightly. Yesterday was the
third straight down day but it doesn’t feel like it as the upside and
downside has been limited. Today the market was up all day with highs hit midday
with the Dow up +70.00 points, S&P 500 +8.00 points and the Nasdaq Composite
+15.00 points but a sell program midday actually pulled all indices into the
red slightly for a minute or two. In the end the market ended higher but off
of highs.
At the close the Dow was up by +34.00 points to the 11,671.00 level,
S&P 500 +5.00 points to about 1274.50, S&P 100 +2.00 points to 574.00
and the Nasdaq Composite +9.00 points to about 2717.00. Oil was higher all day
closing up about +$2.00 to close around the $91.25 level.
The market is in drift mode and could be setting itself up for a spill
as volume gets lower and lower. It doesn’t have to be big but just something
to relieve this condition. If you also look into history you also see that if
the market is up strong at the start of January that the end is usually weak.
It will be interesting to see how it plays out as in the end....
Inventories in businesses fell -0.2% in November while wholesale sales
climbed +1.9% on a seasonally adjusted basis. The inventory-to-sales ratio fell
to 1.15 from 1.17, the Commerce Department said. The monthly inventories report
seldom moves financial markets, mostly because many of the numbers have been
previously reported, but economists find the data useful to project quarterly
growth.
Friday, January 7, 2011 4:03 p.m est.
Where’s the rationality! This morning the employment report came
out much worse than expected yet the market started the day higher! Globex futures
tanked on the news but by the open they were in positive territory because they
decided to focus on the jobless rate fell from 9.8% to 9.4%! Anyhow the Dow
saw quick highs of +30.00 points, S&P 500 +4.00 points and the Nasdaq Composite
+10.00 points. The market did turn lower though after the Supreme court in Massachusetts
reportedly ruled that two foreclosures were invalid because banks didn’t
show they owned the mortgages. This hurt the banking sector as the day went
on and the Dow saw lows of -100.00 points, S&P 500 -13.00 points and the
Nasdaq Composite -35.00 points. The past 11 Fridays have been higher since the
rally started in September however so of course the market made a run at coming
back midday and into the final hour.
In the end it couldn’t make it 12 in a row and at the close the
Dow was down by -23.00 points to the 11,675.00 level, S&P 500 -2.40 points
to about 1271.50, S&P 100 -1.50 points to 573.40 and the Nasdaq Composite
-7.00 points to about 2703.00. Oil was lower most of the day closing down about
-$.30 to close around the $88.00 level.
The economy added +103,000 jobs in the final month of 2010 while the
unemployment rate fell to 9.4%, the lowest level since May 2009. Employment
for November and October were revised higher by +70,000 jobs though which helps
a bit. Economists had predicted a net +150 to +200,000 increase though, with
many raising their forecasts earlier this week after the ADP employment report
came out at record levels.
Still, jobs need to be added at a much faster clip to quickly drive
down the unemployment rate to pre-recession levels but even Bernanke said himself
earlier today that it could take up to 5-years before we’re anywhere near
pre-recession levels. Employment in December rose +113,000 in the private sector,
partially offset by a -10,000 decline in government jobs. Most of the hiring
occurred in the fields of leisure, hospitality and health care. Leisure and
hospitality added +47,000 jobs and health care employment rose by +36,000. The
manufacturing sector also added +10,000 jobs. Average hourly earnings in December
rose +3 cents, or +0.1%, to $22.78. Economists had expected a +0.2% increase.
Earnings have risen +1.8% over the past 12 months. The average workweek held
steady at 34.3 hours. An alternative measure of the unemployment rate, which
includes discouraged workers and those forced to work part-time because of the
weak economy, fell to 16.7% last month from 17% in November. Of the 14.5 million
persons unemployed in December, 44.3% had been jobless for 27 weeks or more.
More than 8 million Americans lost their jobs during the height of the recession.
I guess if you have to look for some type of good news the unemployment
rate dropped to 9.4% from 9.8% in November, according to a separate survey of
60,000 households as it was the biggest one-month decline since April 1998.
Unfortunately the lower unemployment rate is only because the participation
rate also fell once again to 64% another new low as the labor force declined.
Getting more people employed is good if there dropping off the board, that’s
not a good sign long term!
Economists had been expecting the unemployment rate to remain flat.
The high of the jobless rate was 10.1% in October 2009, compared to under 5%
before the 2007-2009 recession began.
Thursday, January 6, 2011 4:03 p.m est.
Here’s a bad sign for market players if they're hoping to get
retail investors back into the market. This may be one of the reasons why you
see the public so heavily invested in interest rate products; Computer trading
and market timing rule the stock market. According to CNBC.com: "Computer
trading, dark pools and exchange-traded funds are dominating market action on
a daily basis, statistics show, killing the buy and hold philosophy still attempted
by many professional and retail investors alike. Everything moves up or down
together at a speed faster than which a normal person can react, traders said.
High frequency trading accounts for 70 percent of market volume on a daily basis,
according to several traders’ estimates. The average holding period for
U.S. stocks is now just 2.8 months, according to the Crosscurrents newsletter.
In the 1980s, it was two years." I think people are tired of bubbles!
The market started the day lower after the Jobless Claims number and
the Monster.com employment report came in worse than expected along with reports
from retailers that sales were below expectations for Christmas after all. Just
when the market was on its way back though Treasury Secretary Timothy Geithner
said that the U.S. could hit the $14.3 trillion debt ceiling as early as the
end of March if it doesn’t get increased sooner than later. In a letter
to Senate Democratic Leader Harry Reid, Geithner said the government right now
has room to borrow about $335 billion but that it is most likely that the debt
ceiling would be hit between March 31st and May 16th. "This means it is
necessary for Congress to act by the end of the first quarter," Geithner
said. At the same time the debt of Portugal, Italy and Spain sold off once again
implying that things may be going bad once again. The Dow saw lows of -60.00
points, S&P 500 -7.00 points but the Nasdaq Composite only saw -5.00 points
and went positive once again as tech stocks remained strong.
At the close the Dow was down by -30.00 points to the 11,695.00 level,
S&P 500 -3.00 points to about 1274.00, S&P 100 -1.50 points to 575.00
and the Nasdaq Composite +8.00 points to about 2710.00. Oil sold off once again
closing down just about -$2.00 to close around the $88.50 level.
Jobless Claims rose last week by +18,000 to 409,000 but economists
had expected them to total about 400,000 on a seasonally adjusted basis. The
prior week's number was also revised up by +3,000 to 391,000. The four-week
average of new claims, however, dropped -3,500 to 410,750, the lowest level
since July 2008. The moving average is considered a more accurate barometer
of employment trends because it smoothens out quirks in the weekly data. Continuing
Claims meanwhile fell by -47,000 to a seasonally adjusted 4.1 million. Altogether,
8.77 million people received some kind of state or federal benefits in the week
of December 18th, on an unadjusted basis. That was down -92,277 from the prior
week.
Wednesday, January 5, 2011 4:03 p.m est.
The market looked as if it was going to correct this morning as the
dollar was rallying and it was a quiet day for QE2 buying for the Fed. Not really
sure how much of an effect that is having anymore as they have been in just
about everyday for awhile now. Globex futures were down almost three quarters
of a percent early on but after a record breaking ADP employment report came
out just before the open losses were cut. The Dow saw lows of -50.00 points,
S&P 500 -6.00 points and the Nasdaq Composite -15.00 points but the market
worked its way back as the day went on, and then turned positive around lunch.
Going into the final hour highs were hit with the Dow seeing +60.00 points,
S&P 500 +8.00 points and the Nasdaq up by +25.00 points.
At the close the Dow was up by +32.00 points to the 11,722.00 level,
S&P 500 +6.00 points to about 1277.00, S&P 100 +3.00 points to 576.00
and the Nasdaq Composite +21.00 points to about 2702.00. Oil was lower at first
but as the day wore on it went positive also closing up +$1.00 to close around
the $90.40 level.
On Monday I was talking about how the 3rd year of the Presidential
cycle has generally seen good returns for the year but I questioned how strong
the market would be since we moved so much in December. Well if you look at
the final quarter you see that the last quarter of 2010 was up over +10%. Does
that mean that it will continue for the beginning of the New Year, or does the
strong previous quarter indicate an early year pullback? Even though we have
been up about 1% since the start of the year history indicates that when the
fourth quarter is up over +10%, January has been simply average and only sees
an average increase of +0.46%, whereas a typical January averages a gain of+1%.
However, after that February and March make it up as the entire quarter usually
gains about +5%.
This would be a good time for a pullback as the market is extremely
overbought with sentiment also way too bullish! Equity call buying relative
to put buying on is at an extreme and the volatility index is now trading at
a level that is twice S&P 500 historical volatility. During the past two
years, when the VIX is trading at such a high premium to the S&P, a mild
to large pullback soon followed. The last time this indicator signaled was early
November, ahead of a -4% pullback in the market. For the first time since late
April, stock mutual funds experienced net inflows last week. The inflows are
incredibly small compared to the enormous outflows during the past three years,
but one has to wonder if this eight-month "extreme" in optimism might
precede a pullback in stocks! After all, during the past 10 years, the month
of January experienced a correction, or marked the start of a correction, in
five of those years 2002, 2003, 2008, 2009 and 2010.
Private-sector employment gained +297,000 in December, according to
Automatic Data Processing Inc.'s employment report. Employment in the service-producing
sector rose +270,000, the largest monthly increase on record. Employment in
the goods-producing sector rose +27,000, the largest gain since February of
2006. On Friday, the employment report comes out and economists are looking
for a gain of about +150,000, and for the unemployment rate to remain at 9.8%.
The Institute for Supply Management's services index rose to 57.1% in December,
up +2.1% from November and better than economists expectations of 55.6%. Any
reading above 50% indicates growth. The bad news though was that the employment
sub-index fell -2.2% to 50.5%, indicating growth in employment for the fourth
consecutive month, but at a slower rate.
The number of corporate layoffs announced by companies totaled nearly 530,000
last year, including just over 32,000 in December, according to outplacement
firm Challenger Gray & Christmas. The 2010 total represented a 59% drop
from the nearly 1.29 million announced job cuts that Chicago-based Challenger
Gray compiled during 2009, and it also marked the fewest annual job reductions
since 1997, with December's tally the fewest for that month since 2000. Still,
2010 was a "lackluster year for the overall job market," said John
Challenger, the firm's chief executive. A string of "relatively small"
net job gains in the private sector has been "not nearly enough to make
a dent in unemployment," he said.
Tuesday, January 4, 2011 4:03 p.m est.
The market continued higher this morning with the Dow seeing +30.00
points, S&P 500 +3.00 points and the Nasdaq up by +10.00 points. It didn’t
last though as oil started to sell off and the dollar rallied so the Dow saw
lows of -30.00 points, S&P 500 -9.00 points and the Nasdaq Composite -25.00
points. The market came back a bit after the Fed released its minutes midday
but couldn’t come all the way back. At the close the Dow was up by +20.00
points to the 11,691.00 level, S&P 500 -2.00 points to about 1270.00, S&P
100 +1.00 points to 573.00 and the Nasdaq Composite -10.00 points to about 2681.00.
Oil sold off strongly today losing -$2.17 to close around the $89.40 level.
Some members of the Fed’s Open Market Committee said they had
a “fairly high threshold” for making changes to the central bank’s
$600 billion bond-buying program, according to minutes released midday. The
Fed maintained its plan to purchase the $600 billion in bonds through the end
of June, a pace of roughly $75 billion per month. Fed officials also defended
the bond purchase program despite the fact that bond yields have risen steadily
since it was put in place. At the meeting, the Fed also kept the federal funds
target rate in a range of 0 to 0.25%. a level it has maintained for two straight
years now. They repeated that economic conditions are likely to warrant exceptionally
low levels of its target rate for an extended period with the vote being 10-1.
Thomas Hoenig, the president of the Kansas City Fed Bank, again dissented and
has opposed every Fed decision last year. He will rotate off the Fed in 2011.
Several “hawkish” members will join the rate-setting committee this
year, including Charles Plosser, the president of the Philadelphia Federal Reserve
Bank, Richard Fisher, the president of the Dallas Fed Bank, and Narayana Kocherlakota,
the president of the Minneapolis regional Fed bank.
Since the meeting, economic indicators have been positive leading economists
to be more optimistic about growth in 2011, leading to speculation the Fed may
adjust the amount of bond buying down. Plosser suggested late last month that
the Fed may need to slow the purchases of bonds if the economic outlook improves.
At the moment, most economists expect the Fed to start hiking rates early in
2012. Bernanke is expected to provide an update of his views on the economy
and monetary policy when he testifies to the Senate Budget Committee on Friday
the same time the all important employment number will be out.
Monday, January 3, 2011 4:03 p.m est.
The market shot out of the gate this morning as it was a new year and
why not start with the year with a bang. Highs were hit early on with the Dow
seeing +140.00 points, S&P 500 +19.00 points and the Nasdaq up by +55.00
points. The unfortunate thing is that once again volume was terrible and it
shouldn’t be being that holidays are all done. It did pull back a bit
in the final hour though but at the close the Dow was still up by +93.00 points
to the 11,671.00 level, S&P 500 +14.00 points to about 1272.00, S&P
100 +6.00 points to 572.00 and the Nasdaq Composite +39.00 points to about 2692.00.
Oil started out strongly today but ended the day with only small gains but were
still 27 month highs, up +$.17 to close around the $91.55 level.
The market started the day up strongly exactly the same as last year
and of course this caused the bulls to pull out their old saying that the first
five trading days of January institute the entire year! It is hard to argue
with it however as history indicates that if it is higher in the first five
days, 86.6% of the time, it is up the entire year so the odds are pretty good.
Maybe this will come true because if you look at a few other things you see
that this will also be the 3rd year for President Obama which in the past has
always seen the market have double digit gains! There are a few theories as
to why this is such as investor confidence increases after midterm elections
which should be the case this time around since everyone was mostly replaced,
an incumbent President wants to promote market-friendly policies as they prepare
for their re-election efforts and of course, it's also possible that it's simply
random. The interesting thing is that the consistency of third-year positive
returns over the last 60 years is quite impressive.
Since about the 1950’s there have been 15 full presidential cycles,
and all of them have seen positive third years and the average return in these
years is almost +18% and many of them were over +20% in comparison with the
other years only averaging about +5%! Basically the big returns have been in
the first quarter of the year and then taper off as the year comes to an end.
On average the first quarter of the third year has been positive 87% of the
time, and has an average return of +7.6%, an extremely high return. I agree
that we could see another up year but my question is if we’ll see those
kind of strong returns and especially a strong first quarter because December
last year alone was up almost +7%! We have similar headwinds to last year with
housing still falling, countries running out of money and few jobs being created
so, at the least we could see the market start to slow down a bit the first
half of the year!
This morning it was reported that the manufacturing sector continued
to grow in December, marking the 17th straight month of expansion, according
to the Institute for Supply Management saying its index of factory activity
rose to 57% from 56.6% in November. Readings over 50% indicate that more firms
are growing than contracting. Economists expected the number to climb to 57.5%.
Also out were Construction projects rising for the third straight month
in November, up +0.4%, slightly higher than economists expectations of about
a +0.2% gain. Spending on public-sector and private projects increased in November.
Outlays are still down -6% compared with a year earlier.
Friday, December 31, 2010 4:03 p.m est.
Wishing you a very merry Happy New Year and I hope the coming year
is as blessed to you as this one has been!
Well there it is; According to Reuters: "The average price of
U.S. gasoline rose above $3 a gallon over the past week, reaching its highest
level since October 2008, the Energy Department said. Where I live the average
price is now over $5.00 per gallon so that sounds cheap to me!! The funny thing
is I live in Canada where our oil supply is almost endless right now with the
oil sands in Alberta!
As we leave 2010 we see its going out with a whimper. The market has
been flatter than a board since Monday with Tuesday mixed and Wednesday barely
higher. Yesterday the market made an attempt to move higher on a falling dollar
and good news on the job front but it ended the day slightly lower. Going into
today's trading we’re basically at the same level as we were last Thursday
so we’re really ending the year on the quiet side with the lowest volume
I have ever seen. Back in the boom days the amount of volume we’ve seen
in the past week would have fit in the first few hours of a day!
Anyhow today the market started the day lower with the Dow seeing early
lows of -40.00 points, S&P 500 -4.00 points and the Nasdaq Composite -20.00
points but as the day went on and the dollar fell and oil rose after an initial
sell off it started to rally, if you can count a few points a rally with the
Dow seeing +20.00 points, S&P 500 +3.00 points and the Nasdaq remaining
lower by -5.00 points. It looked like the market was going to sell off going
into the close once again but it came back to close the year mixed.
At the close the Dow was up by +8.00 points to the 11,578.00 level,
S&P 500 -.23 points to about 1258.00, S&P 100 +.30 points to 566.00
and the Nasdaq Composite -10.00 points to about 2653.00. Oil rallied in the
end to close near highs of the year up +$1.53 to close around the $91.38 level.
The market has had a good year with the S&P 500 up about +12% and
is up about +21% since its mid year bottom on July 1st. Of course with the abysmal
volume it is quite overbought but of course those who were needing to play catch
up to make their books look decent for year end wouldn’t allow much downside.
Small stocks have done much better as they are up about +26% since December
31st, 2009 and +30% since bottoming on July 2nd according to the Russell 2000
index.
Economic data was quite interesting as yesterday saw Jobless claims
fall below the key 400,000 level in the most recent weekly data, a signal that
the labor market is continuing to get better. Yes it sounds good however there
has been less than million jobs created this past year in America but 1.4 million
overseas. A good example is Caterpillar who created +15,000 jobs this year but
more than half of them were overseas where employment and taxes are much better,
or Coke’s +93,000 global employees but there were less than 13% in the
U.S. in 2009, down from 19% five years ago. Anyhow, at least they’re going
in the right direction with them falling -34,000 to a seasonally adjusted 388,000
however I’m sure that it will be revised next week to accommodate the
holidays. This is the lowest level since July of 2008 though which is good even
if it only lasts one week. Economists had expected initial claims of 413,000.
The four-week average fell -12,500 to 414,000, also reaching the lowest level
since July of 2008.
Continuing Claims were down -57,000 to a seasonally adjusted 4.13 million.
The four-week average of these continuing claims fell -37,250 to 4.12 million,
the lowest level since November of 2008. Altogether, about 8.87 million people
received some kind of unemployment-insurance benefits last week. Workers in
states with the weakest labor markets can receive up to 99 weeks of unemployment-insurance
benefits, while workers in other states are eligible for shorter spans of benefits.
Around 3 million to 3.5 million people this year have exhausted their eligibility
for unemployment-insurance benefits, according to the National Employment Law
Project, a New York-based advocacy group.
Manufacturing conditions in the Chicago region jumped in December to
its best level in more than 22 years! The Chicago PMI rose to 68.6% in December
from 62.5% in November, marking the 15th straight month that the gauge was over
the 50% level indicating economic expansion and well above the 61% reading that
economists expected. To put December’s report into context, the median
showing of the Chicago report between 1970 and 2009 was 55.1%. The survey of
purchasing managers showed the highest production levels since October 2004,
new orders at their highest levels since 2005, the best employment levels in
more than five years and the highest prices paid since July 2008. The national
Institute for Supply Management’s manufacturing poll is due for release
on Monday, and the national gauge isn’t expected to be nearly as good,
with economists expecting that report to be virtually unchanged at 56.5%.
Pending home sales were up +3.5% in November as the housing market
continues to show stabilization at weak levels. The National Association of
Realtors said its pending-home-sales index rose to 92.2% from a downwardly revised
89.1% in October. The index is still -5% below November 2009 levels. The data
reflects contracts and not closings, which normally occur after a lag time of
one to two months and is based on a large national sample, typically representing
about 20% of transactions for existing-home sales. The NAR said the figures
suggest a “gradual” recovery into 2011, reflecting housing affordability
and an improving economy.
A separate report released Tuesday said home prices fell -1.3% in October,
and fears remain that a glut of properties on or soon to hit the market will
weigh on prices next year and possibly create a “double dip” in
the housing market said the Case/Shiller home price index. The report said that
Home Prices are dropping in the nation's largest cities and are expected to
fall through next year, with the worst declines coming in areas with high numbers
of foreclosures. The Standard & Poor's/Case-Shiller 20-city home price index
fell -1.3% in October from September and all cities recorded monthly price declines.
Atlanta recorded the largest decline with prices falling -2.9% from a month
earlier. Washington, which had posted increases for six straight months, dropped
-0.2% in October. The 20-city index has risen +4.4% from their April 2009 bottom
but it remains -29.6% below its July 2006 peak.
Consumer confidence declined to 52.5% in December on concerns about
jobs in the present and future. Economists had expected confidence to rise to
56.9%. Consumers feel the economy and labor market remains tepid, and their
outlook remains cautious. Confidence for November was revised higher to 54.3%
from a prior estimate of 54.1%. Expectations fell to 71.9% from 73.6% in November,
while consumers assessment of the present situation decreased to 23.5% from
25.4%. The Conference Board's index helps analysts compare fluctuations in confidence,
with a reading of 100% for the base year of 1985. Generally when the economy
is growing at a good clip, confidence readings are at 90% and above.
Monday, December 27, 2010 4:03 p.m est.
Well today turned out to be one of the quietest days of the year and
it wasn’t even a holiday because a major snowstorm hit the East making
it tough for traders to get in to trade. Selling could have been really rough
as China raised interest rates once again as they thought it was a good time
because of the holidays and they may have been right as the market barely moved
lower on the news. Lows were hit right at the open with the Dow seeing -60.00
points, S&P 500 -6.00 points and the Nasdaq Composite -25.00 points but
because volume was so low it was easy to turn it around with tech stocks leading.
It did become mixed with the Dow still lower but the S&P 500 saw highs of
+2.00 points and the Nasdaq +10.00 points but it was still on dismal volume.
With it being a holiday week I doubt were going to see much buying or selling
in the end as the market is “just right,” for the year now. Because
of this I’m not sure if I’ll send much out for commentary as I think
its going to be boring but if there are some surprises or good news I’ll
let you know!
At the close the Dow was down by -20.00 points to the 11,555.00 level,
S&P 500 +1.00 points to about 1257.00, S&P 100 +.20 points to 566.00
and the Nasdaq Composite +2.00 points to about 2667.00. Oil is holding the $90
level down a little but still closing around the $91.00 level.
Thursday, December 23, 2010 4:03 p.m est.
As this will be my last commentary for the week I wanted to wish you
and your family a very Merry Christmas!!! The market has continued higher the
past couple of days on ever dwindling volume up about +1% but today’s
start saw some downside as it is the last day of trading before Christmas and
there have been many threats from assorted terrorist groups that say they will
be doing something to disrupt Christmas. There is also the fact that the market
is quite overbought and sentiment is reaching levels not seen since 1995! The
selling at the open wasn’t that bad though so it came back but only the
Dow was able to make slight gains. By midday more selling occurred with the
Dow seeing -20.00 points, S&P 500 -5.00 points and the Nasdaq Composite
-15.00 points but again on dismal volume. At the close the Dow made it back
to positive territory up by +14.00 points to the 11,573.00 level, S&P 500
-2.00 points to about 1257.00, S&P 100 -.50 points to 565.00 and the Nasdaq
Composite -6.00 points to about 2665.00. Oil has remained pretty strong now
closing over the $90 level up +$1.00 to close around the $91.40 level.
It was reported this morning that Consumer Sentiment rose in December,
reaching the highest level in six months, but remains at a low level on concerns
about “stagnant incomes,” according to the Reuters/University of
Michigan index. The index moved up to 74.5% in late December, matching estimates
from economists but remains below pre-recession levels of more than 80%. The
final December result compares with 74.2% earlier in the month, and 71.6% in
November. While consumers employment expectations have improved, views of their
financial situations “have remained quite negative due to the widespread
expectation of stagnant incomes,” according to the sentiment report. One-in-four
consumers expect their finances to improve in the year ahead. “The majority
of consumers anticipated no income increases during the year ahead, as they
have for a record 24 months,” according to the report. The report showed
that a gauge of consumers views on current conditions rose to 85.3% in December
from 82.1% in November, while a reading on their expectations increased to 67.5%
from 64.8%. “Consumers reported much more favorable news about recent
changes in the job situation,” according to the report. “Lessening
job uncertainty pushed buying plans for household durables up to their highest
level in three years.”
Sales of new single-family homes climbed +5.5% to a seasonally-adjusted
annual rate of +290,000, from a downwardly revised +275,000 in October. The
sales level missed estimates of +295,000. The pace of sales is 21.2% below that
of November 2009. The median sales price of new houses sold in November was
$213,000, up +8% on October but +2.6% below year-earlier levels.
Consumer spending rose for a fifth straight month in November and incomes
rose slightly more than expected, reinforcing views of a solid economic growth
pace in the fourth quarter. Spending rose +0.4% after increasing by an upwardly
revised +0.7% in October. Economists had expected spending, which accounts for
about 70% of economic activity, to rise 0.5% last month after a previously reported
+0.4% gain in October.
The report also showed consumer inflation, the personal consumption
expenditures price index, excluding food and energy, rose +0.1% after being
flat for four straight months. In the 12 months through November, the core index
rose +0.8%, the same margin as in October and still the smallest year-on-year
gain since records started in 1960. The gains in spending were the latest to
suggest an acceleration in the growth pace this quarter after output increased
at a +2.6% annualized rate in the July-September period. Spending was from a
+0.3% increase in incomes, which was slightly more than the +0.2% rise that
economists had expected. Incomes rose +0.4% in October. Spending adjusted for
inflation rose +0.3% after advancing +0.5% in October. The seventh straight
month of gains bolstered views the spending pace gathered momentum in the current
quarter after growing at a +2.4% rate in the July-September period. Consumers
also dipped into their savings to fund purchases which is to bad as the saving
rate fell to 5.3% last month, the smallest since March, from 5.4% in October.
Savings dropped to $614.8 billion, the lowest level since March.
Jobless Claims fell slightly by -3000 last week to 420,000. Economists
had expected them to total about 421,000 on a seasonally adjusted basis. The
prior week's number was revised up by +2,000 to 423,000. The four-week average
of new claims rose +2,500 to 426,000. Continuing claims dropped -103,000 to
a seasonally adjusted 4.06 million. Altogether, 8.88 million people received
some kind of state or federal benefits in last week on an unadjusted basis.
That was down 308,338 from the prior week.
Durable goods orders fell -1.3% in November, led down by transportation-equipment
orders. Economists had expected a decline of -0.5%. Excluding transportation,
new orders rose +2.4%. Core durable-goods orders, which are orders for capital
goods excluding defense and aircraft, rose +2.6% in November after a -3.6% decline
in October. Shipments of durable goods fell -0.3% in November, while inventories
rose +0.6%. Durable-goods orders in October were revised to a decline of -3.1%
from a prior estimate of a -3.4% drop. Durable goods are expensive items designed
to last three years or longer, and while the data is volatile from month to
month, analysts see a trend in orders as a valuable leading economic indicator.
On Tuesday and Wednesday it was reported that the economy expanded
at a +2.6% pace in the third quarter, slightly faster than previously reported,
mainly because of a higher inventory buildup, which is never good. Third-quarter
growth was previously reported at +2.5% on an annualized basis and this was
the final report and incorporates data not immediately available in two earlier
readings of the economy. Economists had expected growth to be revised up to
+3%, but an upward revision in imports partly explains the smaller increase
in the final third-quarter report. Imports subtract from GDP.
Sales of Existing Homes rose +5.6% to a seasonally-adjusted annualized
rate of 4.68 million, the National Association of Realtors said, a figure that
was pretty close to economists 4.66 million. Sales were still 27.9% below prior-year
levels and below the 5.26 million in June when a homebuyer tax credit existed.
In November 2009, activity was sparked by anticipation. Current sales are back
to levels before the existence of the tax credit but said they won't be sustainable
until they get back to 2000 levels of about 5.2 million. The median price edged
up +0.4% to $170,600
Monday, December 20, 2010 4:03 p.m est.
The market was pretty quiet today making it clear that it could be
like this all week. It was volatile within its tight ranges as it saw highs
early on but then sold off with the Dow seeing -60.00 points, S&P 500 -4.00
points and the Nasdaq Composite -15.00 points. After this though it turned around
pretty quick and the final hour saw highs made with the Dow seeing highs of
+30.00 points, S&P 500 +7.00 points and the Nasdaq up +20.00. Some selling
took hold in the final minutes of trading to cause a mixed day at the close.
The Dow was down by -14.00 points to the 11,478.00 level, S&P 500 +3.00
points to about 1247.00, S&P 100 +1.00 points to 561.00 and the Nasdaq Composite
+7.00 points to about 26350.00. Oil was pretty flat once again closing up +$.80
to close around the $88.50 level.
Although the next two weeks are generally up historically the market
does have some headwinds. First off the Volatility Index comes into the week
trading around its 2010 lows, implying that a turn could come anytime as traders
buy some cheap protection. Interestingly, equity-only option buyers executing
trades on the International Securities Exchange and Chicago Board Options Exchange
during the past 10 trading days have purchased calls over puts at a rate of
three to one, the highest ratio in two years! From a sentiment perspective,
this is a concern but for now as long as the robust call buying continues, it
will help stocks.
The market is getting more and more overbought as volume is pathetic
and I’m sure that by Thursday its really going to be hurting so a quick
correction could come. The S&P 500 has been up 12 of the last 14 trading
days this month anyhow making it one of the strongest Decembers in recent years.
The 1250 level will likely hold the market back a bit as it is below the pre-Lehman
close of 1,250, a level technicians are closely following.
Friday, December 17, 2010 4:03 p.m est.
Interesting notes; The very first gold dispensing machine appeared
in Boca Raton Florida today. The cover of USA Today also had “Get Back
into Stocks” plastered all over the front cover. Sign of a top in either
one, that's the question.....
It was also interesting overnight how the markets responded to Moody's
downgrade of Ireland. This was the same ratings agency that rubber stamped sub-prime
mortgage backed CDO’s! The downgrade comes after months of evidence that
Ireland was on its way to bankruptcy and required a European Union bailout.
It took them long enough!!! It was very interesting how the market responded
to the downgrade with Globex index futures barely falling after the announcement
so I’m willing to bet it had something to do with expiration this morning.
It will be interesting to see what happens next week!
There was also news out that the extension of employment benefits won't
help those whose benefits have run over 99 weeks. According to The Wall Street
Journal: "The extension for unemployment benefits that is part of the compromise
tax deal is good news for many of the unemployed, but it won't provide aid to
anyone who's been out of a job over 99 weeks."
For a quadruple witch expiration it was pretty flat with the Dow finally
seeing highs midday of only +10.00 points, S&P 500 +3.00 points and the
Nasdaq up +20.00. Some selling took hold in the final hour and at the close
the Dow was down by -7.00 points to the 11,492.00 level, S&P 500 +1.00 points
to about 1244.00, S&P 100 +.10 points to 559.49 and the Nasdaq Composite
+6.00 points to about 26343.00. Oil was pretty flat today closing up only +$.30
to close around the $88.00 level.
As we head into a new year of trading with full profits the market
continues its march higher on lower and lower pathetic volume! Now that expiration
is done, the tax cuts or resumption of them is what people should be saying,
I think that institutions are going to take off and volume is going to get even
worse, but heh the markets are up about 12% on the year, 6% just this month
alone and the Nasdaq 16%, so it shouldn’t really matter should it. What’s
going to be interesting about going into next year though is the fact that we
have moved up pretty quick here and volatility is sitting at near record lows
so we could see a little downside or at least some leveling off going into year
end.
A bigger concern though is that the public is buying more and more
into the market and corporate insiders are selling more and more at new record
levels!! Hmmmm, do they know something we don’t? The past few years have
seen everything from news, commodities, stocks and politics to be very manipulated
by a few people with fixed agendas and hopefully that will all change with many
of the new candidates that are coming into Congress next year. For example I
just read a report that reveals that there is so much oil sitting out there
in harbors and storage areas that the price of oil should be more like around
$60 but because the whole enterprise has been deregulated it is being manipulated
to remain high.
Now when it comes to the insiders selling the shares of their companies we see
they are at a pace not seen since early 2007. This was just a few short months
before the Great Recession began! Insiders, of course, are a company’s
officers, directors and largest shareholders and are required by law to almost
immediately report to the SEC whenever they have bought or sold shares of their
companies stock. Vickers Weekly Insider Report is a service that analyzes the
insider data, calculating each week a ratio of the number of shares that insiders
have sold that week to the number that they have bought. Over the last four
decades, according to Vickers, this ratio has averaged between 2 and 2.5 to
1. As a result, the firm considers any reading above 2.5-to-1 to be bearish,
since it indicates an above-average pace of selling on the part of insiders
but guess what, the sell-to-buy ratio this past week was 7.07-to-1! In other
words, corporate insiders on balance are selling more than seven shares for
every one that they are buying! The last time this ratio was this high was the
week ending Feb. 14th, 2007, almost four years ago. The ratio has been above
the bearish threshold of 2.5-to-1 for several weeks now. Because of the way
that the market is traded nowadays some people think that to get a decent reading
it needs to be around these levels before you should start getting worried.
Professor Nejat Seyhun, a finance professor at the University of Michigan who
is an expert on the behavior of corporate insiders, estimates that the “normal”
level for the sell-to-buy ratio is now closer to 6 or 6.5-to-1 but even then,
the latest sell-to-buy ratio now exceeds even this higher threshold! Does this
mean the market will immediately sell off, no but its something we should take
note of and watch closely.
A “mild pickup” could be in store for the economy in 2011
following a slow winter, the Conference Board said as it reported that its leading
economic index rose +1.1% in November, the biggest gain since March. “Continuing
strength in financial indicators is now joined by gains in manufacturing and
consumer expectations, but housing remains weak,” said Ataman Ozyildirim,
economist at the New York-based Conference Board, in a statement. “Possible
clouds” on the horizon for the medium term are ongoing weakness in housing
and jobs, the Conference Board added. Nine of the 10 component indicators included
in the index rose in November, with the largest positive contribution coming
from the index of supplier deliveries. Building permits were the only negative
contributor. “Strengths among the leading indicators have become slightly
more widespread than the weaknesses in recent months,” according to the
Conference Board. November’s result matched expectations.
Thursday, January 14, 2010 4:03 p.m est.
The market remained higher yesterday closing near its highs and after
a poor sell off from economic data this morning it went back up again with the
Dow up seeing highs of +45.00 points, S&P 500 +5.00 points and the Nasdaq
Composite +20.00 points. It all seemed to have a lot to do with the dollar once
again however because as it went down, the market and oil went up.
At the close the Dow was up by +30.00 points to about 10710.00, S&P
500 +3.00 points to about 1148.00, S&P 100 +2.00 points to about 529.00
and the Nasdaq Composite +9.00 points to 2317.00. Oil was pretty flat all day
but when the dollar turned down, it was able to close up +$.20 around the $80.00
level. Volume was meager once again however as traders seemed to want to wait
for Intel’s earnings after the bell today and JP Morgan’s tomorrow
morning. This is all going to make for an exciting end to this expiration cycle!
Retail sales fell a seasonally adjusted -0.3% in December on widespread
weakness across different kinds of stores. The decline was unexpected, as economists
were looking for a +0.5% gain. Auto sales also disappointed, dropping -0.8%
in dollar terms despite an increase in unit sales reported by the automakers.
Excluding auto sales, retail sales fell -0.2%. Sales for all of 2009 fell -6.2%
compared with 2008 to $4.14 trillion and was the largest decline on record,
dating back to 1992. Besides that it was only the second decline on record;
the other was the -0.5% drop in 2008!
Jobless claims rose in the latest week by the most in five weeks up
+11,000 to 444,000. The forecast of economists was for claims to inch lower
to 433,000. Claims in the previous week were revised to 433,000 down from 434,000.
This is the highest level since December 19th. The four-week average of initial
claims fell -9,000 to 440,750 while the number of Americans receiving state
jobless benefits fell -211,000 to 4.60 million. The four-week moving average
of continuing claims fell -151,500 to 4.86 million.
Import prices were unchanged in December after four months of gains.
A decline in fuel prices offset gains in other sectors. Economists had expected
import prices to be flat as imported oil prices had fallen in the month. Fuel
import prices fell -1.4% in December after a +7.1% gain in November. Non-fuel
import prices rose +0.4% for the fifth straight month. Export prices rose +0.6%
in December. Excluding the farm sector, export prices were up +0.5%. For the
year, export prices were up +3.4% after falling -2.9% in 2008.
Tuesday, January 12, 2010 4:03 p.m est.
The market started the day on a bad note and as it wore on it got worse
and worse. As I have been saying it has been overbought and we are in an expiration
traded week so volatility is likely to happen. By midday the Dow saw lows of
-100.00 points, S&P 500 -15.00 points and the Nasdaq Composite -45.00 points.
The final hour saw the market come back and cut losses quite a bit At the close
the Dow was down by -38.00 points to about 10627.00, S&P 500 -11.00 points
to about 1136.00, S&P 100 -5.00 points to about 524.00 and the Nasdaq Composite
-30.00 points to 2282.00. Oil was lower all day as it sold off on as the dollar
strengthened closing off -$1.70 around the $81.00 level.
As we move into earnings season its hard to believe that companies
actually could make money. For example according to The Wall Street Journal:
"The downturn that started in December 2007 delivered a body blow to U.S.
workers. In two years, the economy shed 7.2 million jobs, pushing the jobless
rate from 5% to 10%, according to the Labor Department. The severity of the
recession is reshaping the labor market. Some lost jobs will come back. But
some are gone forever, going the way of typewriter repairmen and streetcar operators."
Jobs may never return in other housing boom related industries, such as manufacturing
and finance.
There is a link between the education and joblessness. It's clear that the education
system isn't doing its job, which is one reason why the economy is feeling the
recession even worse. It's not just about filling jobs that may open. It's about
creating new jobs, new enterprises, and innovation and there is a clearly a
lack of inspiration coming out of this down turn as fewer people are willing
to take chances, instead just giving up on looking for work. This is why 2010
earnings will be characterized by an important transition from a margin story
to a revenue story within earnings. The market will be looking for the first
signs of a rebound in “top line” growth this quarter as it will
be so easy to beat last years results. The problem is that the economy remains
extremely weak so we’ll likely only see single digit year over year growth
in revenues in 2010.
Profit margins have surged back to near record highs and should lay
the foundation for companies to begin spending cash on hiring and expansions
though but don’t get too excited! The problem is that that as we enter
the latter half of 2010 we will need to see substantial revenue growth to meet
the expectations of the huge estimates and the biggest thing that I need to
repeat is that earnings are “top line,” not just from cost cutting!
As I have been saying I think volatility will return and with the median P/E
multiple now a huge 22.2 and the degree of bullish sentiment in the latest Investor
Intelligence Poll a huge 72% along with others nearly the same, it will get
extremely hard for the market to move to the upside. There likely won’t
be much downside however because one has to remember that the market is made
up of companies that are multinational so you have to look around the globe
to see if economies are slowing down all over the place. We truly are in a global
economy now. For example it is said that 470 of 500 S&P 500 companies have
a presence in China now! This will likely help to support the downside and until
stocks become a bit cheaper, the upside will likely remain on hold also. Something
to watch....
The trade deficit widened by +9.7% in November to $36.4 billion. The
trade deficit was above forecasts of economists of a deficit of $34.8 billion.
Exports rose for the seventh straight month, but imports rose at a faster pace
in November. The government also revised the deficit in October to $33.2 billion
from $32.9 billion. As a result the deficit for the year now totals $340.6 billion,
down from $654.1 billion in the same period last year. The trade deficit with
China narrowed to $20.2 billion in compared with $22.7 billion in October.
Monday, January 11, 2010 4:03 p.m est.
Looks like were going back to the 1970’s! I can’t remember the exact
date in the 70’s but I believe it was near the end of the decade when
scientists came out and said that the world was moving into another “ice
age!” I’m sure that’s what the people in the south have been
thinking as its even freezing in Florida!!! The funny thing is that where I
live were above freezing right now!! Anyhow, in the United Kingdom, where they
are also seeing a record freeze, the press is not talking about global warming
but global cooling. It seems as if global warming and cooling are at least partially
influenced by a naturally occurring cycle where the temperature of the ocean
3000 feet below the surface and its oscillations are a critical part of the
global cooling and heating cycle. If this theory and observations are correct,
the next 30 years or so will be cooler than the last they say. The scientists
who discovered this say that the hot cycle ended in 2007 and were now in a cooling
phase. All I can say is that its sure a good thing we have all of this extra
CO2 around to help keep us warmer otherwise it’d likely be even colder,
haha! From a business point of view though those people in Copenhagen must be
“shaking,” get it,,, as it could also mean that If they're right,
and this winter gives them a lot of support at the moment, global warming and
its trillion dollar effect on the North American taxpayer has suffered a significant
set back!
The market started the day higher and it looked like it was going to
be another rally day but selling suddenly took the market down with the Dow
seeing lows of -40.00 points, S&P 500 -4.00 points and the Nasdaq Composite
-15.00 points before turning mixed midday. The final hour saw the Dow make new
highs of +60.00 points, S&P 500 up +4.00 points while the Nasdaq Composite
was still down by -2.00 points. At the close the Dow was up by +46.00 points
to about 10664.00, S&P 500 +2.00 points to about 1147.00, S&P 100 +1.00
points to about 529.00 and the Nasdaq Composite -5.00 points to 2312.00. Oil
was lower all day but mostly unchanged around the $83.00 level.
Were now into the earnings season with Alcoa kicking it off after the
bell so it will be interesting to see how this week turns out on this incredibly
pathetic volume. I thought that it would pick up today if the market was up
but it wasn’t which as I said last week, is very worrisome. I’m
not looking for a crash but I still think were going to see a decent correction
start anytime now!
Friday, January 8, 2010 4:03 p.m est.
Interesting.....According to Rasmussen Reports.com: "More voters have greater
confidence in the telephone book these days than in the current Congress, and
most think their national legislators are paid too much to boot. A new Rasmussen
Reports national telephone survey shows that 45% of likely U.S. voters now think
a group of people selected at random from the phone book would do a better job
addressing the nation’s problems than the current Congress. That’s
up 12 points from October 2008, just before the last congressional elections.
Thirty-six percent (36%) disagree, and another 19% are not sure."
The market sold off first thing as the jobs report was much worse than
expected first thing this morning with the Dow seeing lows of -55.00 points,
S&P 500 -5.00 points and the Nasdaq Composite -10.00 points. It didn’t
last long though as everyone decided that jobs aren’t really important
especially when you can borrow money at near zero interest rates so the final
hour saw the Dow up +15.00 points, S&P 500 up +4.00 points while today the
Nasdaq Composite was up +20.00 points as semiconductors stocks this time were
being bought.
At the close the Dow was up by +11.00 points to about 10618.00 S&P
500 +3.00 points to about 1145.00, S&P 100 +2.00 points to about 528.00
and the Nasdaq Composite +17.00 points to 2317.00. Oil was mostly unchanged
around the $83.00 level.
The jobs report this morning confirms that economy is still not moving
much out of the abyss that it was in last year. Business is not good, not just
less bad than before. The consumer is not getting better, and especially not
just less strapped than before. This seems to make it possible that we could
see a double dip into recession once again. Earnings reports for last quarter
start coming out next week and although they are expected to be pretty good,
the question will be if they actually came from growth on the top line or just
more of the same, cost cutting. There is also more odds for a major terrorist
event as it seems that they are kicking it up a notch around the globe right
now.
As I have been saying I expect the market to be mostly moving sideways
to slightly up this year, so far we saw a nice gain for this week. With earnings
coming out and it being an expiration next week we could see a correction start.
While expirations weeks tend to be positive, that is not the pattern for the
expirations week in January. The past 8 of the last 11 years have been down
big and expiration day (Friday of next week) has been down 9 of last 11 with
some big losses. The way this market has moved this week on the incredibly pathetic
volume, almost worse than Christmas, it makes me very nervous about what could
happen actually because you want to just give your head a shake about how it
can move like this with no volume behind it.
This was a bad start to the year as job losses resumed in December
by -85,000 and unemployment was 10%. There was a huge range overall from economists
but they were basically looking for a positive number and an increase in the
unemployment rate to 10.1%. Revisions showed payrolls rose in November for the
first time in nearly two years though but was taken away as October’s
numbers were revised lower. Novembers numbers were revised to a +4,000 gain
after the initial -11,000 but October’s revision was lowered to -127,000
from a -111,000 number so combined there was a net -1000 job loss. During 2009,
payrolls fell by -4.2 million and since the recession began two years ago, it
has fallen by -7.3 million. An alternative gauge of unemployment, which includes
discouraged workers and those forced to work part-time, rose to 17.3% from 17.2%.
Average hourly earnings rose +3 cents or +0.2%, to $18.80. Average hourly earnings
are up +2.2% in the past year.
Temporary help jobs did move up by +46,500, a leading indicator of
permanent employment eventually! However, fewer industries were hiring in December
than in October, and the number of discouraged workers rose by +287,000 to 929,000.
The employment participation rate fell to 64.6% from 64.9%. Total hours worked
in the economy were unchanged. The average workweek was unchanged at 33.2 hours.
A separate survey of households showed employment fell by a seasonally
adjusted -589,000 and unemployment fell by -73,000 to 15.3 million but 661,000
people dropped out of the workforce, driving the employment participation rate
down to 64.6%. The employment-population ratio dropped to 58.2%. Due to changes
in seasonal adjustment factors for the household survey, the peak unemployment
rate in October of 10.2% was revised to 10.1%. The number of people who've been
unemployed for longer than six months rose by +229,000 to 6.13 million, representing
a record 39.8% of 15.3 million who are classified as unemployed. Overall this
was a very bad report for the start of 2010 and the Obama administration. Maybe
they need more government jobs but even they fell by -21,000!! The goods-producing
sector fell by -81,000, including -53,000 in construction and -27,000 in manufacturing.
The average workweek in manufacturing was unchanged at 40.4 hours. Service-producing
jobs fell by -4,000, including -10 in retail. Services had added +62,000 jobs
in November but maybe that was a Christmas thing. Of 271 industries, 40% were
hiring in December, down from 42.4% in November.!
Wednesday, January 6, 2010 4:03 p.m est.
Yesterday the market closed mixed as it started to think about how the employment
report on Friday may look like. It continued that way today but was able to
make slightly higher highs with the Dow up +25.00 points, S&P 500 +3.00
points and the Nasdaq Composite +5.00 points but still on low volume. Friday’s
report could have an interesting effect on the market because if it is stronger
than expected although it may be good for the economy, it basically guarantee’s
that interest rates will be going up. With the market moving so much on the
0% carry trade, higher rates aren’t a good thing so a sharp correction
could ensue.
At the close the Dow was up by +2.00 points to about 10574.00 S&P
500 +.65 points to about 1137.00, S&P 100 -.28 points to about 524.00 and
the Nasdaq Composite -8.00 points to 2301.00. Oil remains incredibly strong
up well over +$1.00 to close around the $83.00 level.
It seems that even though more and more problems come about, the market
ignores it. Geo-politics are really kicking up in the middle east as Iran is
completely ignoring threats about their nuclear ambitions and China has declared
they won’t go along with the U.S to bring more sanctions. Yemen is now
the new hotbed for al-queada, oil prices are once again over the $80 level,
a record setting winter isn’t helping, a wayward Congress and an increasingly
unpopular president, along with expectations of low economic growth and persisting
joblessness, the market just keeps on moving higher. Volume has been pathetic
but did pick up a bit yesterday. Breadth has still been good though as the advance
decline line continues to confirm every new high. What I find most interesting
is that the higher interest rates is failing to scare traders and that short
term rates have once again turned negative. It was interesting yesterday that
Pending Home sales fell -16% as that may be due to the expectation of higher
rates. It was a complete surprise anyhow but didn’t move markets much
after the initial shock wore off to momentum once again. The employment report
will come out on Friday and it appears the market is starting to flatten as
it gets closer but right now momentum is key. This of course is bad because
momentum runs are great but always end badly because you can see a 5-10% start
on basically anything and maybe that will be it.
At 2:00 est. it was reported that recent signs of an improving economy
did not turn the Fed from the belief that the recovery would be gradual relative
to past recoveries and inflation would remain flat, according to minutes of
the latest policy meeting. Although the November employment report was better
than expected, Fed officials observed that “more than one good report
would be needed to provide convincing evidence of recovery in the labor market.”
There was a sharp divide among officials about the forecast for inflation longer-term
though. The argument was so intense that the discussion about the price outlook
continued long after the formal vote on policy, which usually signals the end
of the closed-door gatherings. There was not a lengthy discussion of the Fed's
purchases of mortgage-backed securities that are scheduled to end in late March.
Only a few Fed officials pushed to expand the plan and only one thought it should
be scaled back. The Fed put off a discussion of “alternative approaches
to implementing policy in the longer-run” until this year. The committee
will next meet on January 26th-27th.
This morning it was reported that private-sector firms cut -84,000
jobs in December, according to the ADP employment report. It was the fewest
jobs lost since March 2008. The private-sector has lost jobs for 23 months in
a row. In November, a revised -145,000 jobs were lost, compared with the -169,000
originally reported. The ADP index does not include government jobs. The ADP
jobs data come two days before the employment report comes out. Economists are
looking for them to actually go up by +10,000, the first gain in two years.
Compared with the regular employment report, the ADP report has indicated steeper
job losses over the past seven months, with an average difference of about -100,000.
The service sectors of the economy rebounded in December, the Institute
for Supply Management reported. The ISM non-manufacturing index rose to 50.1%
from 48.7% in November but despite the improvement, the increase was below expectations.
Economists were looking the index to rise to 51%. It has been above 50 for three
months in the summer and fall but then slipped under in November. The closely-watched
employment index rose to 44% from 41.6% in November. The employment index has
been below 50 since May 2008 and hit a low of 31.1% in November 2008.
Yesterday it was reported that Pending home sales plunged a seasonally
adjusted -16% in November as a highly popular tax credit for first-time buyers
was set to expire on November 30th, the National Association of Realtors reported.
The pending sales index which measures contracts signed but not closed on previously
owned homes was +15.5% higher than in November 2008. October's increase was
revised higher to +3.9% from +3.7% previously reported. The tax credit was ultimately
extended through the first half of 2010 and expanded to repeat buyers. “The
fact that pending home sales are comfortably above year-ago levels shows the
market has gained sufficient momentum on its own,” said Lawrence Yun,
chief economist for the lobbying group. “We expect another surge in the
spring.” Yun said he expects about 2.4 million more buyers to take advantage
of the subsidy from taxpayers before it expires on June 30th, in addition to
2 million who have already taken the tax credit.
The factory sector is emerging from recession as businesses stepped
up their demand in November for capital equipment to expand production. Factory
orders increased +1.1% in November, faster than the +0.8% expected by economists.
This is the seventh increase in the past eight months. October's orders were
revised higher by two-tenths of a percent to +0.8%. Orders for durable goods
increased +0.2% in November, unrevised from the initial estimate released late
last month. Orders for nondurable goods rose +1.8%. Inventories rose +0.2% in
November for the second straight monthly gain. Inventories had been extremely
lean and is a sign manufacturers want to restock shelves.
Monday, January 4, 2010 4:03 p.m est.
The market started out the New year much better than last years start opening
up strong and remaining there all day. The Dow saw highs of +175.00 points,
S&P 500 +19.00 points and the Nasdaq Composite +45.00 points but the unfortunate
thing was that it was on incredibly low volume and that’s not good considering
were coming off of a very long holiday season. The final hour saw a bit of profit
taking but most of the gains were held. At the close the Dow was up by +155.00
points to about 10583.00 S&P 500 +18.00 points to about 1133.00, S&P
100 +9.00 points to about 523.00 and the Nasdaq Composite +39.00 points to 2308.00.
Oil was up strong as temperatures were hitting record lows all over North America
this past weekend and there are many geo-political flare ups around the middle
east. It was up well over +$2.00 closing around the $81.50 level.
It does appear that things are changing as Americans are moving from
being buyers to doers as a result of the recession. People are looking for experiences
over the latest products or gadgets. For example, museum attendance has increased,
and people are staying at home more and spending more time with family and friends.
According to The New York Times: "Quietly but noticeably over the past
year, Americans have rejiggered their lives to elevate experiences over things.
Because of the Great Recession, a recent New York Times/CBS News poll has found,
nearly half of Americans said they were spending less time buying nonessentials,
and more than half are spending less money in stores and online." The Times
added: "Americans are not just getting by with less. They are also doing
more. Some are working longer hours, but a larger proportion, the poll shows,
are spending additional time with family and friends, gardening, cooking, reading,
watching television and engaging in other hobbies." What does this all
mean? If you own a business this may be where you should be looking by offering
activities and products that enhance it.
The manufacturing sector expanded in December for the fifth straight
month, the Institute for Supply Management reported indicating that the recession
is still slowing down. The ISM manufacturing index rose to 55.9% from 53.6%
in November and was the highest in nearly four years. Economists were expecting
a modest gain to 54.2%. Readings over 50% indicate that more manufacturing firms
said business was improving than said it was worsening. In December, nine of
18 industrial sectors were growing. The new orders index rose to 65.5% from
60.3% while the employment index rose to 52% from 50.8%. The production index
rose to 61.8% from 59.9%.
Construction spending fell -0.6% in November as spending on housing and public
works decreased and was the seventh straight monthly decline in spending. Outlays
are down -13.2% compared with a year earlier. Economists were expecting a decline
of -0.7%. There was also a sharp downward revision to October spending. The
government said spending fell -0.5% in October, compared with the initial estimate
of no change. In November, spending on private-sector projects fell -0.7%, while
public spending fell -0.4%. Private home construction fell -1.6%. Spending on
nonresidential private projects inched lower for the eighth consecutive monthly
decline.
Thursday, December 31, 2009 4:03 p.m est.
Well good by to 2009 and welcome to 2010. 2010 has a nice ring to it and I believe
its going to be an incredibly good trading time for our style of trading as
volatility will return a but movement will be little! I believe the market will
continue to go mostly sideways in the coming year as it consolidates the incredible
gains made this year.
The S&P 500 is up about +24% for the year and +68% from the March
lows alone but it still remains in-between the highs and lows that were made
10-years ago! In2000 I felt that we could go sideways similar to the 1965-1982
period and so far that remains in place. Hope you all have a great New year
celebration with well wishes and safe driving, think smart!
The market basically closed at its lows after a sell program came in
the final thirty minutes of trading but again it was on the lower volume than
yesterday! At the close the Dow was down by +120.00 points to about 10428.00
S&P 500 -11.00 points to about 1115.00, S&P 100 -5.00 points to about
514.00 and the Nasdaq Composite -22.00 points to 2269.00. Oil was up once again
closing around the $79.50 level.
Jobless Claims fell -22,000 to a seasonally adjusted 432,000 last week,
the lowest level since summer 2008. Economists expected initial claims to come
in at 455,000. The four-week average dropped -5,500 to 460,250, the lowest since
September 2008. The number of continuing claims, which reflects people who have
been collecting state benefits for an extended period, fell -57,000 to 4.98
million. The four-week average fell -122,000 to 5.22 million, the lowest rate
since last March. Its nice to have some good news going into the New Year!
Wednesday, December 30, 2009 4:03 p.m est.
The market has been virtually flat this week, being up Monday and down yesterday
on the lowest volume of the year. It is obvious that traders are done for the
year and won’t be coming back until 2010. By the way if your one of those
people who only put cash into the market once a year because you think your
an incredible market timer, you would have lost money the past decade because
the Dow and especially the S&P 500 isn’t going to finish the year
anywhere near where it was at the start of 2000. Oh well, maybe double down
next Monday and the next ten years will be better!
At the close the Dow was up by +3.00 points to about 10548.00 S&P
500 +.00 points to about 1126.00, S&P 100 +.00 points to about 519.00 and
the Nasdaq Composite +3.00 points to 2291.00. Oil has been rallying of late
but it too is little changed this week remaining near the $79.00 level.
Yesterday it was reported that Consumer Confidence rose for the second
straight month as more people expect the economy to improve in 2010. Its always
good to be hopeful! The index climbed to 52.9% from a revised 50.6% in November.
Confidence had been expected to rise to 54% though. The expectations Index jumped
to 75.6% from 70.3% but the Present Situation index, a gauge of how consumers
feel now, fell to 18.8% from 21.2% remaining near a 26-year low.
The market value of homes in 20 major cities was flat in October and
failed to keep pace with gains so far in 2009, according to the Case-Shiller
home price index. In October prices rose in just seven of 20 cities. In the
past year, prices are down -7.3% in the 20 cities and lower in October 2009
than in October 2008.
Today, more businesses in the Chicago region were expanding in December than
at any time in the past 16 months, based on the latest data from the Chicago
purchasing managers index. The business activity index rose to 60.0% from 56.1%
in November. This is the highest reading since August 2008 and was stronger
than economists had forecast. The index fell as low as 31.4% in January. Readings
over 50% indicate more firms said business is getting better than said it was
worsening.
Thursday, December 24, 2009 3:00 p.m est.
The market has basically been up all week and with the early close today at
1:00 p.m est, it continued higher. Volume is so low you can almost count it
on one hand and because of this, it has placed it in an incredibly overbought
condition. Next week will be interesting as we move into year end. I likely
won’t be reporting tomorrow as it’s Christmas so I’d like
to take the time to wish you a very Merry Christmas!!
At the close the Dow was up by +54.00 points to about 10520.00 S&P
500 +6.00 points to about 1126.00, S&P 100 +3.00 points to about 518.00
and the Nasdaq Composite +16.00 points to 2286.00. Oil has been rallying as
inventories have been lower than expected closing near the $78.00 level.
The economic shocker for the week was that Sales of New Homes fell
-11.3% in November to a seasonally adjusted annual rate of 355,000 as the popular
tax break for first-time homeowners was set to expire. The market decided to
completely ignore the number. It was the lowest sales pace since April and followed
months of steadier sales helped by the tax break that was set to expire on November
30th. Buyers would have had to sign a contract on a new home by early October
at the latest in order to receive the tax credit, which was ultimately extended
until June and expanded to include repeat buyers. November's sales were far
weaker than the 421,000 expected by economists. October's sales pace was revised
lower to 400,000 from the 430,000 earlier reported. Sales were down -9% from
last November. Through the first 11 months of 2009, 349,000 homes had been sold,
down -24% from the same period a year ago.
Home builders continued to cut inventories of unsold homes. The number
of unsold homes dropped -2.1% to 235,000, the lowest in 38 years. The number
of homes for sale that are under construction or not yet started fell to a record
low. Builders have cut back on production of new homes, but still face stiff
competition from unsold existing-homes as foreclosures continue to grow. At
the November sales pace, it would take 7.9 months to sell the inventory, up
from 7.2 months in October. Once a home is completed, it's taking 13.6 months
to sell it, a reflection of the mismatch between the more expensive homes in
the inventory and the lower priced homes that are selling.
The median sales price of a new home sold in November was $217,400,
down -1.9% in the past year. Sales fell in three of four regions, led by a -21%
drop in the South to a 19-year low, down -9% in the West and -3% in the Northwest.
Sales increased +21% in the Midwest.
Today it was reported that Jobless claims fell -28,000 to 452,000 last
week, hitting the lowest level since September 2008. Economists were looking
for an initial claims level of 470,000. The four-week average fell -2,750 to
465,250, which also the lowest level since September 2008. Continuing claims
fell -127,000 to 5.08 million, the lowest level since February. The four-week
average of continuing claims fell -90,000 to 5.23 million, the lowest level
since March.
Yesterday a big drop in volatile aircraft orders covered a broad-based
increase in demand for other durable goods. Orders for durable goods rose a
seasonally adjusted +0.2% in November, held back by a massive -32.6% drop in
aircraft bookings. Excluding transportation goods, orders rose +2%. Orders were
stronger in every major industrial category outside of transportation. Orders
for core capital equipment goods, a gauge of business capital investment jumped
+2.9%. Total orders were weaker than the +0.6% increase expected by economists.
Orders are up in two of the past three months and are up +3.8% since June.
It was reported that Personal Incomes by +0.4% in November to an annual
rate of $12.2 trillion, the biggest gain since May and in line with expectations
of economists. The increase in wages and salaries was largely due to the +0.6%
increase in hours worked. Income earned by owners of small businesses increased
+1.2% after a +1.4% gain in October, reversing three straight quarters of declines.
After inflation, after-tax disposable incomes rose +0.2% for the third straight
month. Real disposable incomes had fallen for much of the recession, but are
now up +2.3% compared with December 2007, with much of the increase due to tax
cuts and government transfer payments. Consumer spending increased +0.5% in
November to an annual rate of $10.2 trillion after a downwardly revised +0.6%
gain in October. Spending was weaker than the +0.7% gain forecast by economists.
It appears that consumer spending is on track to rise by around +1.5% in real
terms in the fourth quarter, which, given an anticipated add to growth from
a sharp slowing in inventory disinvestment, should get gross domestic product
to go over +4% at an annual rate in the fourth quarter,but if its like the last
quarters revisions being cut almost in half, that won’t be good.
Tuesday, December 22, 2009 2:15 p.m est.
Yeah, the sun has turned around! This is one of my favorite days as it means
the sun will be up a few minutes longer, pull out the lawn chairs!!! Oh, wait
a second I guess we should get through Christmas first! Last week it was all
about parties at my kids school as they celebrated Christmas galore so they
may have well been home on vacation and the market is identical. Outside of
expirations strong volume due to rollover, the market should have closed months
ago let alone this week. I’m willing to bet that we see the lowest volume
ever as we move into the end of the week. Yesterday’s was incredibly pathetic.
We’ll likely finish the week on the upside mind you but I don’t
think it will be anything really huge.
Yesterday the market was up pretty good but pulled back by the close
and today’s market didn’t react well to the ever lowering of 3rd
quarter GDP as it opened pretty flat. The Dow eventually saw highs of +65.00
points, S&P 500 +7.00 points and the Nasdaq Composite +20.00 points. Once
again the upper level of the trading range turned the market back once again
and is currently sitting just below the highs.
The final hour saw a bit of a bounce so at the close the Dow was up
by +20.00 points to about 10329.00 S&P 500 +6.00 points to about 1102.00,
S&P 100 +3.00 points to about 509.00 and the Nasdaq Composite +32.00 points
to 2211.00. Oil rallied today on news that Iran attacked an oil rig in Iraq
and took it over. At one point it was up over +$2.00. In the end it closed up
+$.40 to the $73.00 level.
The economy grew at the fastest pace in two years during the third
quarter, but the revised annual growth rate of +2.2% was much slower than what
the government initially reported at +3.5%. Real gross domestic product increased
for the first time since the spring of 2008, boosted by higher consumer spending,
especially on autos as well as a rebound in investments in homes, a slower pace
of inventory reduction, more exports, and robust government spending. Before
growing in the June-through-September quarter, the economy had shrunk for four
straight quarters, the first time it had done so since the Great Depression
so being up a little now means very little to me as you can’t go down
forever! The economy contracted -0.7% in the second quarter after falling by
-6.4% in the first quarter and by -5.4% in the fourth quarter of 2008. The figures
are seasonally adjusted and adjusted for price changes. Real GDP has fallen
-2.6% in the past year. Most economists believe the worst recession in generations
ended during the third quarter, even as the nation's unemployment rose. Production
and sales increased, while real incomes slipped lower but recent economic indicators
have turned down again which may be trouble in the future. Consumer spending,
boosted by the government's so-called cash-for-clunkers program, was the main
engine of growth in the third quarter and that is bad because since it has been
finished auto sales have fallen back and were not really moving forward if its
the government that is creating the growth not new business ventures.
Economists are forecasting stronger growth, about +4% on an annualized
basis in the fourth quarter ending December 31st. They also see annualized growth
of about +3% in the first half of 2010.
Home buyers rushed to qualify for an expiring federal tax credit, increasing
re-sales of homes by +7.4% to a 6.54 million. The sales pace was the highest
since February 2007 and was the third straight large increase. Sales are up
+28% since August. Buyers were rushing in November to finalize sales ahead of
the November expiration for the tax credit. The tax credit was subsequently
extended and expanded to include repeat buyers. Economists were expecting existing
home sales to rise to a 6.28 million annual pace in November.
Friday, December 18, 2009 4:03 p.m est.
Well it was another interesting expiration as stocks were forced up first thing
in the morning to get a decent read on the S&P 500 expiration with it settling
at 1102.38 for the month. The Dow saw highs of +45.00 points, S&P 500 +6.00
points and the Nasdaq Composite +30.00 points. Right afterward though sellers
showed up and the Dow saw lows of -45.00 points, S&P 500 -2.00 points but
the Nasdaq Composite remained strong still up +5.00 points as Oracle had decent
earnings last night.
The final hour saw a bit of a bounce so at the close the Dow was up
by +20.00 points to about 10329.00 S&P 500 +6.00 points to about 1102.00,
S&P 100 +3.00 points to about 509.00 and the Nasdaq Composite +32.00 points
to 2211.00. Oil rallied today on news that Iran attacked an oil rig in Iraq
and took it over. At one point it was up over +$2.00. In the end it closed up
+$.40 to the $73.00 level.
Now that were finished the last expiration cycle of the year with full
profits I still expect the market to hold up at least to year end to keep the
gains that have been made this year. After that we’ll see....
Thursday, December 17, 2009 4:03 p.m est.
The market fell today on worries that Fed chairman Ben Bernanke may not get
renominated and FedEx missed their earnings report and made it sound like future
earnings may be lower. The Dow saw lows of -140.00 points, S&P 500 -14.00
points and the Nasdaq Composite -35.00 points. The final hour saw a bit of a
bounce but at the close the Dow was down by -133.00 points to about 10308.00
S&P 500 -13.00 points to about 1096.00, S&P 100 -6.00 points to about
506.00 and the Nasdaq Composite was down -27.00 points to 2180.00. Oil closed
flat after correcting over a dollar early on around the $72.50 level.
I read an interesting article this morning on the American healthcare
system and thought I would let you know about it. I don’t really have
much of an opinion as I live in Canada so on this subject I don’t really
care but the U.S media continues to slam our program up here but the one thing
that I know is that where I live the system is incredible! I do think it depends
on where you live and because I live in a resort area doctors want to live here
so I can see my doctor any time I want or walk into any one of the numerous
medical clinics here for help. Yes if I need a new knee or hip I’ll have
to wait a year but I know from experience that my friends have gotten in the
next day if you need one due to complications or if your having a heart attack
or bleeding out etc, you’ll be operated on immediately! For the $114 it
costs per month for my entire family I think its worth it!
Anyhow as this article points out it was the Democrats that started
screwing up the medical area with Clinton and guess who’s got there nose
in it now!!! “As health care "reform" stalls in Congress once
again, the general public should consider that if and when the package passes,
the compromises are ironed out, and the president finally signs the final bill
into law, the system will move on to the next crisis, the lack of well trained
physicians to take care of the surging number of patients that will supposedly
have access to care.
To be sure, the lack of foresight and the potential for future consequences
have never been the hallmark of political decisions. Yet, this one has the potential
for some huge effects in the future, especially the political future of those
who enact the "reform" package.
A little known fact is that in order to save money for Medicare, the funding
for physician training programs was cut in 1997. That means that today's long
waits at the doctor's office, and the projected shortage of physicians over
the next 15 years was fueled, at least partially by the same government that
is once again tinkering with the potential health of its constituents.
At the same time that training program funds were being cut, HMOs were
empowered by the Clinton administration, adding layers of bureaucracy to the
system, where physicians now have to ask for permission from the insurers to
perform routine procedures on patients who actually need them. Most doctor's
offices now have at least one person on their staff whose sole job is often
just to ask for "approval" from insurers for what most in medicine
consider routine interventions in patient care. In this scribe's office, part
of the daily routine is talking to insurance companies about the use of "third
tier" anti-inflammatory medication for patients. That means that a dedicated
nurse has to explain to the clerk on the other end of the phone why the doctor
wants to use Celebrex for a patient with arthritis. If the patient hasn't tried
at least three other anti inflammatory medications before, the insurer won't
pay for Celebrex. What makes this even more frustrating is that in the rare
occasion when we get the approval, the patient can't afford the $50 or $60 copay
that is required to get the medicine.
According to Bloomberg: "To combat a nationwide shortage of doctors,
medical schools in the U.S. plan to add 3,000 first- year students by 2018.
It won’t be enough." Why? According to the report: "The expansion,
pushed for by the Association of American Medical Colleges, is being undercut
by a U.S. health-care overhaul designed to supply medical insurance to an additional
31 million Americans and a cap on government-funded physician training programs
that’s been frozen in place for 12 years, said Steven Safyer, of Montefiore
Medical Center."
In fact, as Bloomberg reports: "Last year, there were 16,721 fewer primary-care
doctors than needed in inner city and rural areas, according to the U.S. Health
and Human Services Department. Residencies, the hospital based-training doctors
undergo before they can practice medicine on their own, have been capped by
Congress at about 90,000 since 1997 as a way to curb rising medical costs."
Consider this. According to Bloomberg: "Even with the push for more residencies,
about 1,500 have gone unused for the last three years, the medical school group’s
Salsberg said. This is because some hospitals find they no longer can provide
supervision or hands-on experience necessary to educate all the residents they’ve
been allocated, he said." Translation: there aren't enough physicians that
are willing to go into academics to teach other physicians any more because
the pay for the hard work involved in teaching physicians isn't worth the trouble.
What are the alternatives? Aside from waiting a long time to see someone
when you're ill, your chances of seeing a non-physician "extender,"
such as a nurse practitioner or a physician's assistant are likely to rise.
To be sure, that's not a knock on those professionals, who are often well trained,
dedicated, and capable. But, at 4:00 A.M., when your abdominal aortic aneurysm
is dissecting, and you're bleeding to death, you want to know that a capable
vascular surgeon is available and willing to try and give you the best chance
possible at that 50% survival rate under those conditions in the best of hands.
If the current trends remain in place, there won't be one of those
capable folks available everywhere. And with the number of smokers, diabetics,
and non-excersisers in the population, the number of vascular emergencies and
cardiac related issues is certain to rise. And that's not all. What we see on
a daily basis tells us that the chronic problems, such as osteoarthritis, spine
problems, and other labor and resource intensive issues will also rise.
So what's the bottom line? There are too many people that need medical
care. There aren't enough doctors to take care of all of them now. The medical
education system is underfunded. The health insurers don't want to pay for any
treatments that aren't bare bones, whether they work or not. And, even if the
system was to change for the better overnight, it would still take years for
the educational system to catch up to the needs of the population.
Conclusion
We're not trying to be negative here. We're just noticing that the longer this
debate goes on, the more evidence to support slowing down and thinking about
what we're doing rises. Yet, Congress and the president, looking for a political
prize continue to push into a potential abyss.
The system, with all its warts, still takes good care of a lot of people. But
the system is fraying, at all levels, especially that precious pipeline, future
physicians. And if there is no one to take care of patients, what's the use
of having "reform" and "access?"
That's why we're concerned about the "don't worry be happy" stuff
emanating from Capitol Hill and the White House on this issue. In other words,
the golden goose is sitting on a silver platter, the oven door is opening, and
the welcoming fires are waiting.”
Something to think about......
Jobless Claims were up by +7,000 to 480,000 last week from a revised 473,000
the prior week. The number of people receiving unemployment insurance was little
changed in the prior week, while those getting extended payments increased.
They were projected to drop to 465,000 by economists. The four-week moving average
of initial claims, a less volatile measure, fell to 467,500 last week, the lowest
level since September 2008, from 472,750. Continuing claims increased by +5,000
to 5.19 million. The continuing claims figure does not include the number of
Americans receiving extended benefits under federal programs. The report showed
the number of people who have used up their traditional benefits and are now
collecting extended payments jumped by about +144,000 to 4.73 million.
The index of leading economic indicators rose for the eight straight month,
pointing to an improved economy in 2010, the Conference Board said. The index
increased +0.9% after a +0.3% gain in October. Six of the 10 leading indicators
were positive and for the first time since December 2007, employment did not
make a negative contribution to the index, potentially a good sign for future
job growth, the board said.
Improvement in the manufacturing sector in the Philadelphia region continued
in December, the Fed’s Bank of Philadelphia reported. The Philly Fed diffusion
index rose to 20.4% from 16.7% in November and was above expectations as economists
were expecting the index to rise to 17%. The index has been positive for five
straight months. For the first time since 2007, more firms reported an increase
in employment than reported declines.
January 2, 2008
What a great start to the year!! The market tanked today as some traders
returned from holidays after a poor reading on manufacturing came out and oil
closed in on the $100 level. The market had been a little higher early on but
after it was reported that the ISM manufacturing index came in below 50%, indicating
contraction, the market pulled back to see triple digit losses. After an attempted
bounce after the Fed’s minutes came out midday basically saying nothing
new, it fell back to lows with the Dow seeing -275.00 points, S&P 500 -28.00
points and the Nasdaq Composite -60.00 points. At the close the Dow was down
by -220.86 points to 13043.96, S&P 500 -21.18 points to 1447.18, S&P
100 -9.70 points to 675.95, and the Nasdaq Composite -42.65 to 2609.63. Oil
closed with huge gains up +$3.64 to $99.62.
Volume remains pathetic so it is really hard to judge what the market
is really thinking but one thing for sure is that it is getting quite oversold
before some very important economic data. This may be a sell on the rumor, buy
on the fact, type of move. I’m still analyzing what I think is going to
happen for the overall year but I’ll let you know as soon as I’m
done.
Factory activity contracted in December to its weakest level since
April 2003. The Institute for Supply Management said its index of national factory
activity fell to 47.7% in December from 50.8% in November, below economists
median forecast for a reading of 50.4%. A reading below 50 also indicates contraction
in the sector. Seven of 18 industries were expanding in December, led by apparel,
petroleum and food. The new-orders index fell to 45.7% from 52.6%, the lowest
since October 2001 during the last recession. The production index fell to 47.3%
from 51.9%., the lowest since March 2003. The employment index rose marginally
to 48% from 47.8% though but remains below 50% indicating that people are still
losing jobs.
Spending on construction projects hit a two-month high in November, rising by
+0.1% on strong outlays for public, state and local construction projects. Spending
on home construction, meanwhile, continued to fall by -2.5% following a drop
of -2.3% in October and is now the 21st consecutive decline. The overall number
was a surprise though as economists were expecting a fall of -0.5% in November.
Year over year, spending is down by -0.1%.
8/9/07 4:15 p.m. est.
The market was ugly today as overnight it was reported that French banking group
BNP Paribas said it has suspended three funds with exposure to the U.S. credit
markets as it has become impossible to accurately value them after “the
complete evaporation of liquidity.” The market opened ugly and after cutting
losses in half it made new lows right at the close with the Dow off -390.00
points, S&P 500 -45.00 points and the Nasdaq Composite -57.00 points. At
the close though the Dow was down by -387.18 points to 13270.68, S&P 100
-22.12 points to 676.02, S&P 500 -44.40 points to 1453.09 and the Nasdaq
Composite -56.49 to 2556.49. That’s what you call volatility! Oil closed
a little lower by -$.54 to $71.61.
The market was volatile once again today with 10 of the last 13 sessions seeing
triple digits on the Dow. It seems that even Fed fund futures are getting in
on the act as they are now pricing in a 100% probability of a rate cut in September.
It may have done this because the Fed added about $12 billion in temporary reserves
to the banking system through 14-day repurchases, double the amount added the
prior week. It is still within the norm however so I wouldn’t get to excited
about a coming rate hike just yet. Fed funds were only showing a possibility
of 25%yesterday. I have never seen them move around like this in all of my years
of trading but I am also not seeing the level of paranoia out there either.
Even the risk management people at futures firms are telling me that they are
fearful of big moves in the market. The only good thing is that they say the
same thing about a move in the market on the upside. The other thing I’m
seeing is that in just about every major technical indicator I’m seeing
the market as oversold as if it was down -15 to -20% so sentiment is unbelievably
negative!
We are definitely in an interesting period in time but one thing that all of
these credit surprises from the U.S, Australia and now France are indicating
to me is that this crisis with the entire mortgage thing is much bigger than
we think. At the beginning of the year I was saying that things could be interesting
this year because of all the mortgages that needed to be reset this year. There
is about $3 billion worth of them happening and $300 million worth of defaults
expected. Unfortunately we are already over that level and I am sending a chart
in the e-mail to show you where we were now at to give you an idea of what we
could see. The chart shows June as current but were now a month ahead of that.
The point is if you take a look at what is coming up you can see that we could
have a real mess on our hands and with mortgages so high now I can see why there
would be a problem.
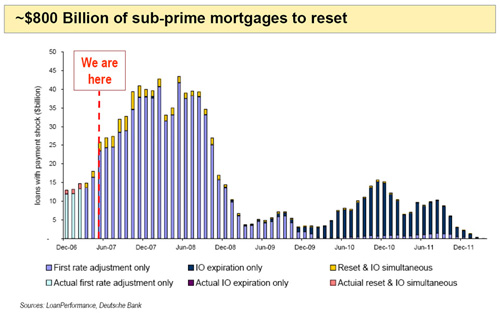 One Mortgage
broker business that I have heard of says that it is very difficult to fund
a new mortgage if your credit score is below 660 now even with a decent down
payment. Before your credit score only had to be 600 to get a new mortgage with
zero down! Besides that though these huge loans over $400,000 have an interest
rate of 8% due to the size of the loan. This could really be a problem for the
higher priced real estate markets like in California where highly leveraged
loan markets once thrived. The problem though is that practically everyone is
dependent on high leveraged loans right now around the world because of how
high mortgages are.
One Mortgage
broker business that I have heard of says that it is very difficult to fund
a new mortgage if your credit score is below 660 now even with a decent down
payment. Before your credit score only had to be 600 to get a new mortgage with
zero down! Besides that though these huge loans over $400,000 have an interest
rate of 8% due to the size of the loan. This could really be a problem for the
higher priced real estate markets like in California where highly leveraged
loan markets once thrived. The problem though is that practically everyone is
dependent on high leveraged loans right now around the world because of how
high mortgages are.
1/3/06 4:10 p.m. est.
The market started the new year on a strong note with the Dow up +45.00 points,
S&P 500 +6.00 points and the Nasdaq Composite +13.00 points for no real
reason except that it was the new year. When some poor economic data came out
and oil spiked higher by over +$2.00 per barrel due to a reported conflict between
Russia and the Ukraine over Natural Gas the Dow hit lows of -40.00 points, S&P
500 -3.00 points and the Nasdaq Composite -20.00 points. After this though the
market was able to turnaround a bit and when the Fed released their minutes
the market took off to new heights on dreams of an end to rate increases. The
funny thing is that everything they said has been said before and they even
made it seem more confusing not knowing what they’re going to do. Such
as, they said the number of additional rate hikes needed “probably would
not be large” based on economic data on hand, according to the minutes
yet they also mentioned that the economy is strong suggesting resource markets
could tighten further and price pressures could build, according to the minutes.
The Dow saw highs of +150.00 points, S&P 500 +22.00 points and the Nasdaq
Composite +40.00 points in the final hour. The Dow closed at 10847.41 up +129.91
points, S&P 100 +9.25 points to 579.25, S&P 500 +20.51 points to 1268.80
and the Nasdaq Composite +38.42 points to 2243.74. Oil closed up by a strong
+2.10 cents to $63.14.
If you look at the first five trading days of the year
the odds of a decent prediction for an upside move is pretty good, looking at
the last 35 years. If we see the first five days of trading on the upside there
is a 85.7% chance that it will be an up year. If they are down we get more of
a mixed picture with about a 50% chance of being higher and 50% being lower
for the year. One of the most interesting stats was that if December was down
January was up 76% of the time since the market has been running. Since 1950,
January has predicted the full year performance 78.5% of the time and a down
January has preceded a new bear market or at the least a flat year. Of course
no one really knows what is going to happen but I’m suspecting that in
the end we’ll see another up year by say 11.8% but most of it will be
lackluster. We could see a bit more volatility however which I think will be
great for us in our style of trading.
2004
12/31/04 4:20 p.m est.
And there the year goes with a whimper. Every year I always love to hear all
the media analysts attempt to blow up the fact that the market is going to explode
going into year end and every year it closes quietly. All of the year end positioning
was done a couple of weeks ago my friends not on the last days of the year!
2004
2005
Change Percent
Dow
10453.92 10783.01 +329.09
+3.1%
S&P 100 550.78
575.29 +24.51
+4.5%
S&P 500 1111.92
1211.92 +100.00 +9.0%
S&P 500 Jan. Futures 1110.60
1211.20 +100.60
+9.0%
Nasdaq Composite 2003.37
2175.44 +172.07
+9.0%
Russell 2000 556.91
651.56 +94.65
+17%
5 Year Bond 3.22%
3.22%
10 Year Bond 4.25%
4.25%
Volatility 18.31,
17.51 13.54, 13.02
Since its the end of the year it looks like its time to
start talking about what may happen next year and so far to me it appears that
there will be little difference from last year, slow steady growth economically
and for the market. In the end the market will likely see gains of about +10%
but we could see some interesting volatility on its way there on the downside.
There are lots of factors that are going to come into play for the market next
year that could possibly affect it if they get worse, such as, oil prices, terrorism,
the deficit, the economy, company earnings, technicals, sentiment etc. You could
almost name it at this point because the market has had a very good run the
past few months so anything negative could cause a quick retreat.
When the market peaked out back in 2000 I knew we were
going to see a huge correction as the Nasdaq Composite barreled over the 5000
level in its blow off rally and at the bottom I declared a snapback rally but
then at least 5 years of mostly sideways to higher action. So far that has come
to pass but because there is still really “no new thing to move the market,”
I remain with the declaration of slow steady growth ahead. I always think back
to the time of 1965 to 1982 as the market barely moved and the period were in
now is exactly the same. Sure we may see new highs on the Dow but it has been
five years and that index is price weighted so it moves different than other
big cap indexes such as the S&P 500, which is far away from its all time
high.
On the positive side though, many analysts are saying
that 2005 has to be an up year because all years ending in 5 have all seen strong
gains since 1885, without exception. First off, to me this indicates more of
a possibility of this being the first down year just because everyone is talking
about it now and secondly if you look closely you can see that not all years
were really strong. The two times we saw small gains were in 1895 and 1965,
while every other year ending in five has seen a gain of more than 20% with
six of those years coming in at 30% and over. Of course the 1895 +1.7% gain
may have been small just because of the fact that it was the first year the
Dow index was established but I think the 1965 number is the key one to look
at coming in with only a +10.9% gain. Don’t forget the 1965 to 1982 period
I mentioned above...
1885 1.7%
1995 36%
1985 28.2%
1975 43%
1965 10.9% ****
1955 44%
1945 29%
1935 42.7%
1925 32.3%
1915 80.5%
1905 38.7%
1805 1.7%
Average gain
38.5%
This is a pretty good track record, I must say.
Maybe it’s just a coincidence that they are all up or perhaps a self-fulfilling
prophecy, as everyone bought stocks in anticipation of another great “5”
year. The one thing I know for sure is that although every year ending
in five was a good year it tells us absolutely nothing about what may happen
in 2005! I mean really, although it sounds like a sure thing, there was also
an over 95% probability of President Bush losing the election race according
to a bunch of supposed historical indicators so I like to think there is more
to the market than just a bunch of probabilities!
Another thing that people have looked at is that almost all of these "5"
years has registered its low for the year in the month of January.
1995
January 30th was the low, yearly high +36%
1985
January 4th was the low, yearly high +28.2%
1975
January 2nd was the low, yearly high +43%
1965
January 4th was the low, yearly high +10.9%
There were five days in June seeing slightly lower closes and it indicates how
the year overall was mostly flat.
1955
January 18th was the low, yearly high +44%
1945
January 24th was the low, yearly high +29%
1935
January 15th was the low, yearly high +42.7%
Nine days in March closed lower also but then the market went straight up.
1925
March 30th was the low, yearly high +32.3%
This was the only exception of it not being in January.
1915
January 2nd was the low, yearly high +80.5%
February 24th closed less than -1.0% lower.
1905
January 25th was the low, yearly high +38.7%
On average, the low for the year was around January 22nd,
but you can see by a few of those years that it always didn’t go straight
up from there. There's no denying that history looks pretty good for the “5”
year of each decade for the past century but there lies part of the problem
for the year 2005. Stock market Cycles began publicizing the mystique of the
“5” year 20 years ago when very few people were aware of what happened.
In 1994, awareness was quite apparent and as we approach 2005, I believe the
publicity concerning the phenomenon will increase dramatically.
An interesting factor was that at the end of 1974, 1984, and 1994, adviser sentiment
had been bearish for a significant percentage of the calendar year.
Unfortunately, we are facing an almost exact opposite
sentiment picture as we are seeing bullishness that hasn’t been seen for
years which will likely see even bigger bullishness by the promises of another
great “5” year. Overall there has been a mindset of steadfast bullishness
for well over two years. The average level of weekly bulls over bears since
March 2003 has been a huge 31.4%. To put this data in perspective, there has
been only seven full calendar years in the history of Investors Intelligence
data (since March 1964) where bullishness has been so strong they have escaped
without seeing even one week with bears over bulls and only one other consecutive
two-year grouping such as we are seeing in 2003-2004. The other consecutive
years occurred in 1999-2000. The other years were 1972, 1976, and 1983. So far,
each and every year that has failed to see even one weekly reading with bears
leading has been followed by a down year!
So there we have it, two historical indicators that have
so far been 100% correct however that can’t happen this year so one of
them has to break, the question is which one! This also means that even a 100%
correct statistic won’t be correct forever so it looks more like the odds
for this year really are 50/50 it’s going to be an up year and 50/50 its
going to be a down year! Which brings me to my final point and that is to remind
you that no one really knows what the direction will be no matter how good the
statistics are and is one of the biggest reasons why we trade the way we do,
we don’t want to try to time the market! One factor I believe that seems
to portray little upside though is that volatility continues to move lower such
as last weeks light trading bringing in readings below 12 and it hitting its
lowest reading since December 1995 so it has little room to go on the downside.
One thing for sure though is it should be another great year of trading!
We hope you have a great end to this year and a blessed
and profitable next year! We’ll see you back at our regular time on Monday!
2003
1/5/04 1:30 p.m est.
Well it feels good to be back and all rested from a great Christmas vacation.
Christmas was loads of fun and a surprise decision to do a quick road trip on
New years Eve to see one of our family members who couldn’t make it down
for Christmas capped it all off. The markets continued to celebrate also with
a gap up open on Friday morning on extremely thin volume. This however was met
with selling and the market today did the same thing with a gap up open causing
the Dow to see early highs of +90.00 points, S&P 500 +10.00 points and the
Nasdaq Composite +30.00 points. After this however the market pulled back and
flattened out until midday when the Dow made slightly higher highs of +105.00
points, and the Nasdaq Composite +35.00 points and the S&P 500 back to old
highs of +10.00 points. The final hour saw more sideways action until a program
buy came in the last fifteen minutes taking the market up to close at its highs
with the Dow up +134.22 points to 10,544.07, S&P 500 +13.74 points to 1122.22,
S&P 100 +7.32 points to 557.31 and the Nasdaq Composite +40.68 points to
2047.36.
This morning it was reported that Construction Spending
was up +1.2% to a seasonally adjusted annual rate of $934.5 billion following
a revised gain of +1.1% in October. Economists had only expected a +0.5% increase.
November was the fifth straight month that the annual rate set a record, reflecting
a building boom that has been generated by the lowest interest rates in more
than four decades. Economists are looking for construction activity to remain
strong in the coming year because they believe the Federal Reserve will keep
its target for the fed funds rate at a 45-year low at least until midyear to
keep the current recovery going.
Residential construction advanced +1.9% in November to
a seasonally adjusted annual rate of $501.6 billion, after a +2.1% gain in the
prior month. Outlays on offices advanced +1.3%, while construction spending
on highways and streets climbed +4.1%. Health care construction fell -1.7% however.
Private spending on homes was up +2.0% from October, but a huge +14.1% from
a year earlier. Spending on office buildings was up +2.5% from October, but
was down -6.6% from a year earlier. Spending on factories was down -1.6% from
October but down even further -5.8% from last year.
For the rest of the week, tomorrow has the Challenger Layoff Survey and the
December ISM Non-Manufacturing Business Index and finally Factory Orders. Thursday
has Jobless Claims and Wholesale Trade while Friday has the monthly employment
report. This is the most important report of the week and month for that matter
and so far economists are expecting an increase of about +125,000 jobs created.
Expectations are high so if traders are disappointed the market won’t
react well. Another thing to keep note of is that on Thursday, Dow component
Alcoa will kick off this earnings season with its fourth-quarter earnings report.
This year turned out to be a great year for trading with
credit spreads seeing regular trades have a +152% gain, conservative +118%.
S&P 500 futures options E-mini outright sells saw regular trades see gains
of +133% and 103% for conservative trades. The coming year should be as exciting
as this years trading and we here at Agora Outlook are all looking forward to
it!
I must say I’m disappointed with the end of the
year trading though as the market tacked on about an extra +4.0% this past month
which I believe could have been better used by traders this month. Nonetheless
that’s not really my concern but if they’re trying to look good
it is going to take a lot more work now to match this years performance. Last
year at this time I figured the market would be up about +10% by year end even
though it ended the year on strong selling but if there were no terrorist attacks
the market may have even be higher. The S&P 500 finished the year up about
+25% which I believe beat everyone's forecasts and lets me say once again that
making yearly forecasts is actually quite stupid because so many things can
change over an entire year! I think its great to see the strong gains but with
the market now as overvalued on a fundamental basis as it was in 1999 once again
and overbought on a longer term basis, I can’t see the heady gains coming
in that many people are expecting.
Then again if we continue higher like we did today the
market will be up over +400% by year end! I was going to call for another +10%
to +15% gain for the year but with the strong year end finish I’m going
to reduce it to +5.0% and maybe +10% if we see a deep enough correction midyear.
The upside for the market should also be limited because the economy can’t
sustain +8.0% growth so it will likely fall into a normal range once again which
means that earnings for companies are also going to flatten out. If there are
any major terrorist attacks I would then have to join the bears though and expect
a down year as it would hurt consumer sentiment immensely as there has been
no attacks in North America since 9/11. Although I believe that the terrorism
threat is actually getting less and less, when a cat is backed into a corner
it will do anything to save itself so you never know what will happen!
For me, yearly estimates mean nothing anyhow as every expiration cycle is new.
The only pressure we saw all year was one cycle this past summer so we finished
the year with great gains and considering how high the market moved this year
that’s great. Volatility overall has been lower and I think that next
year will remain about the same, maybe even lower as long as there are no surprises
and the dollar doesn’t crash. A lower dollar is fine but it is getting
a bit low considering the need for foreign money to support the deficit.
For the start of the year there is a strong possibility
of some profit taking as traders held onto the gains they have made since August
and so it is better to take profits in 2004 so taxes won’t need to be
paid for a year and a half. Last year the market sold strongly into year end
and then rallied at the start of 2003 and since this year ended with a bang
I think we’ll likely see some selling start anytime now as the market
is extremely overbought and sentiment is also unbelievably bullish. For example
the past two weeks has seen equity option activity indicating strong bullishness.
The 21-day moving average has dropped to its lowest level of 2003 at .54 which
is flashing a warning sign for a possible reversal. The prior low was achieved
in mid-June and after it was hit the S&P 500 fell over -5.0% over the next
10 trading days. Last weeks close also saw the S&P 500 up for a sixth straight
week, the longest streak since 1998.
2002
The market ended the year on the downside with the Dow down 5 of the last six
days of the year and the overall market ending 2002 lower for the third consecutive
year. This was the first time this has happened since 1941 and has only
happened three times in 107 years! It was also the worst month of trading
for a December since 1931! There surely was no "Santa Claus rally"
this year as many had expected but it wasn't that surprising to see the selling
as it was looking like it was going to be a down year anyhow a month ago. Why
not do some tax loss selling right at the end of the year to make it easier
to see an up year next year.
Of course everyone is already talking about how we’ll see an up year now
as you never see a fourth down year but that’s what everyone was saying
last year! Well guess what, there has been one other fourth down year
and it was from 1929 to 1932. Only one in the past does improve the odds
that it won’t happen again this time around but its always best to keep
it in the back of your mind. It is kind of deceiving as the slide started
with the October 1929 crash making it the first down year and the bull market
didn’t get going until July 1932 so if you actually calculate out the
entire down period you only get a total of 35 months. If we stay above
last years July lows we’ll still be okay which placed the bottom at 30
months and if we were to fall below that level and then start a rally it would
make it a 35 month bear at this stage. The longest bear ever was 42 months
so maybe we could see a new bottom in July which is another thing to keep in
the back of your mind. One thing it does say though is that the more something
is expected to happen, the less likely it will so it may be better to stick
with the possibility of a July low and then a rally starting.
Here’s another reason for a possible up year though as it is a pre-presidential
election year and in the last 25 since 1903, stocks have risen 20 times and
fallen only five. This is much better than its total track record during
this period of 64 up years and 36 declines. Even more interesting is the
fact that the Dow has risen in every year before a presidential election since
1943. What’s more, 11 of these 15 years saw the Dow post a double-digit
gain. History certainly tells us that thing should be good for the market
this year so if we follow the seasonal November to April tendencies, coupled
with the third year of the Presidential election cycle, which has never produced
a down year in the last 50 years we should see an up year overall!
Other factors that should help are low interest rates,
economic stimulus, rising earnings and an accommodating Fed. This means
the only fundamental problem that may be out there is that if a new bull market
were to develop, it would be the first time in history that it occurred before
price/earnings ratios fell to or below current long term averages. Right
now, they are roughly twice as high as usual. “Current” P/E
ratios in general are higher than historical averages but from another viewpoint,
P/E ratios are really only meaningful within the context of interest rates because
interest rates influence both corporate earnings and price-earnings ratios.
Right now the five-year bond is at its lowest yield since 1962, and so
P/E ratios should be even higher, at extremes actually but they're not. To be
at the 40-year average the price of the S&P 500 should be at least 20% higher
than it is currently. If you look at the 10-year bond the market is over
30% undervalued.
Assuming no new terrorist attacks or corporate problems pop up, the economy
should grow in 2003 at about a 3.0% rate with just a bit more inflation. The
ISM reports are a confirmation of that, and I expect that to only get better
as we go along. All of the stimulus coming in should help at least a little
bit. So far the consumer, with improving real wages and low interest rates,
have kept the economy going. That is not about to stop as they have been increasing
their savings rate and now have $2.8 trillion in savings accounts alone. Businesses
are also getting in on the act as they are showing some increases in capital
expenditures and it is time for some inventory replenishment so it should enhance
the next phase of the economic recovery.
There are a lot of positive correlation's pointing to when we came out of the
1990-1991 recession with economic strength leading the way. This is all
great news however the biggest problem is still out there and that is
negative psychology as many investors and institutions have been burned badly
the past three years. People are also still worried about another major
terrorist attack even though the odds of it happening become less and less by
the day. To me psychology is the biggest mover in the market and that
is what I think will keep the market in check every time it attempts to scream
higher as profit taking sets in. This means there will be volatility but
it will probably get lower and lower as time goes by along with gains and losses.
In the end the market may be up 10% unless of course terrorism is stopped
completely but I think that will take a few more years to complete. Of
course I don’t really care if the market is up or down for the year but
just how much it moves within every expiration cycle. This is why I think
it will be most important to continue to watch weekly moves this year as we’ll
probably see them mostly flat with decent swings in-between.
Yearly
Change
Index 12/31/01
12/31/02 Change
Percent
Dow Jones Average 10021.57
8341.63 -1679.94
-16.7
S&P 500 1148.08
879.82
-268.26
-23.3
S&P 500 Futures Dec. 1149.20 878.90
-270.30 -23.5
S&P 100 584.28
444.75
-139.53 -23.8
Nasdaq Composite 1950.42
1335.50 -614.92
-31.5
Russell 2000 488.50
383.10
-105.40 -21.5
5-year bond 4.34%
2.72%
10-year bond 5.03%
3.82%

Copyright c 1996,1997,1998,1999,
2000,2001,2002, 2003, 2004, 2005. All rights reserved. The information contained
in the AGORA OUTLOOK NEWSLETTER is based upon data that is believed
to be accurate, but is not guaranteed, and subject to change without notice.
All projections, forecasts, opinions, and track records cannot be guaranteed
to equal our past performance. Persons reading this newsletter are responsible
for their actions. Officers and employees of this publication may at times have
a position in the securities mentioned, or related services