To save time on reading we are cutting back on the archived letters of this expiration cycle by taking out the Economic effects, Next Weeks economic effects sections as they are very large. We also took out the track records section as you can find it in another part of the site. This expiration cycle contains 4 letters.
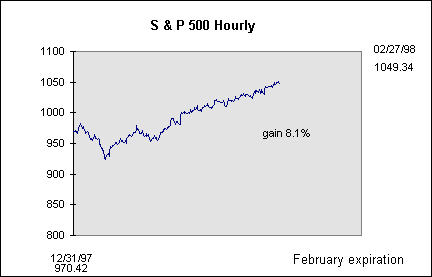
March Expiration February 27th 1998
Mutual fund investors are proving to be surprisingly cautious even as the stock market hits new highs. Many investors are trimming their mutual fund buying and they are putting their money in more conservative money market and bond funds. It appears that people are moving away from aggressive funds. Approximately $35.51 billion flowed into money market funds last month, representing more than half of the new cash that flowed into all mutual funds in January and a reversal of December's money-fund outflow of $1.3 billion. The stream of new cash into bond and income funds more than doubled last month to $11.3 billion, the highest monthly level since August 1993, up from $5.56 billion in December, according to the Investment Company Institute, a trade group. At the same time, $14.58 billion of net new money flowed into stock funds in January, down from $15.45 billion in December, ICI reported. That differed a lot from ICI's earlier January stock fund estimate of $18.5 billion. Investors are continuing to put money into bond funds this month, several mutual fund companies said. The continuing level of interest is particularly striking since for many years nothing had gone into bonds. At Vanguard Group, the nation's second largest fund company, investors have turned more conservative, dumping money into super safe money market funds, bond funds, and balanced funds, which include a mix of stocks and bonds. Investors have cut back on purchases of stock funds somewhat from last month when $2.8 billion flowed into these portfolios, spokesman Brian Mattes said. With the month nearly over, Vanguard's stock funds are expected to take in around $2.6 billion. "We're seeing a more cautious, conservative investor," Mr. Mattes said. Overall, however, Vanguard of Malvern, Pa., is having its "second-best month on record," he said, with projected investments of $5 billion for February. Last month's investments totaled $5.1 billion. The company is known for its popular staple of index funds, including the high-profile Index Trust 500 Portfolio, which tracks the Standard & Poor's 500 index of big-company stocks. It was a similar story at Charles Schwab. In February, about $1.7 billion of new investor money flowed into stock funds through the company's mutual-fund marketplace, compared with $1.3 billion last month, spokesman Greg Gable said. Investors are still interested in bond funds, though somewhat less than January, he said. Specifically, $372 million of new money came into bond funds through Schwab in February, compared with $572 million in January. One surprise: A turnaround in international funds, which for months had suffered because of the Asian financial crisis. In February, $461 million flowed into international funds through San Francisco based Schwab, compared with $94 million in January. Mr. Gable said Schwab customers have even shown increased interest in Asian mutual funds. The public is becoming increasingly knowledgeable about world markets which is something institutions need to take into account as they continue to buy up the market. If the money quits flowing so may the buys on highly priced stocks!
Technically
We’re overbought!......That’s about all we need to say because we’ve been saying that for 1 month! We’re just getting to extremes now, although on longer term technical charts we’re only mid-way. ARMS index is revealing that we’re back into neutral territory. Even though the market was up Thursday & Friday, the volatility index began to move up once again. This shows that skepticism may be creeping back into the minds of traders. Technical analysis is good at revealing trends. What it’s not good at is revealing turning points. However, if a person keeps saying "we’ll head lower from here" everyday until it finally happens, then some day that person will be right. One technical analyst we have always respected, though, is Arch Crawford. We mentioned a few weeks ago that he was still concerned about the market. He said back then that for sure the market was going to hit a top on Feb. 26th. So far he hasn’t been right but we’ll give him a little leeway as he has been a good predictor in the past!
Mclellan Oscillator: 45 100 oversold +100 overbought
Summation Index: 2952
Five day arms: .94 .80 and below, overbought 1.00 and above, oversold
Ten day arms: .93 .80 and below, overbought 1.00 and above, oversold
Bulls: 46.0 previous week 45.9 50% plus overbought/bearish
Bears: 28.2 previous week 30.3 50% plus oversold /bullish
Correction: 25.8 previous week 23.8
Five day Qvix: 20.23 10-15 bullish, low volatility 15-40 bearish, high volatility
Davidson’s View
Today the Dow had considerably more strength than both the S & P 500 and the Nasdaq composite. Nasdaq and the S & P have been moving lock step the past two weeks and have been much stronger then the Dow recently. For the month, though, they have all finished up strongly. The Dow was up 8.1%, S & P 500 up 7.0%, S & P 100 up 7.1% and finally the Nasdaq composite up 9.3%. With the Dow and S & P up this much in one month we should expect a 75% return this year. Does this mean we should buy calls for the rest of the year? This is just another reason why its time for a correction to start. The 30 year bond touched 6.0% today as stocks were near their highs today. As they rallied off of that level stocks seemed to move lower. It topped the 6.0% level for the first time in trading in nearly three months as hedge fund and technical selling combined to pressure prices. At first, bonds bounced after they hit their 6.0% support level, but then they went back and retested it again. After that, though, they rallied all the way to 5.94% as stocks sank. What was interesting was that when bonds hit 6.0%, stocks began to fall even more. It seems that the stockmarket doesn’t want bonds to go through 6.0% but they also don’t want them to rally. They seem to want a flat bond market. The 120 level on bonds was very significant to futures traders. If that level hadn’t held, you could have seen bonds move to 6.25% next week. Next week bonds could rally quite strongly with the indicators that are coming out so we should expect stocks to remain flat to down. It’s time for a correction here, anyway, so we can get our put trades placed. This will be the week that decides the overall direction of the market until the end of expiration. It’s the start of a new month and the pre-warning season for companies to announce possible poor earnings. Analysts say the market has already discounted them but this will be the first time we’ll see earnings fall off of the record setting pace they have maintained since 1990, so this could become significant.
MARKET CLOSES
Index |
Last Week |
This Week |
Change |
Percent |
Dow Jones |
8413.94 |
8545.72 |
+131.78 |
1.6 |
S & P 500 |
1034.20 |
1049.34 |
+15.14 |
1.5 |
S & P 100 |
494.69 |
501.93 |
+7.24 |
1.5 |
Nasdaq |
1728.13 |
1770.52 |
+42.39 |
2.5 |
30 Year bond |
5.86% |
5.94% |
We will continue to show the 1997 chart plus the 1998 chart until we get further into year.

Current Trades
We had a hard time getting into our long call trade this week as the volatility index seemed to be playing tricks on the program. It may have been because of the divergence between the rise in the market and the lowering of the VIX indicator at the TOP of the market and not the bottom. We haven’t seen that in a few years and as we indicated mid week, it could be a sign of a top. Our long trade, 1080/1085 is looking very good here even with the market rise. Our short, 1025/1030, has seen a good premium depreciation even as the market had moved up quite a bit this week. Next week will reveal if we’re going to hang onto the trade or not. Were still waiting for the market to correct before we fill our long put trade. We have the trade in now but we need a move down to open the spread.
Program Trades
Average Entry price |
bid |
ask |
last |
|
March 1025 Call $24.63 |
short trade |
32.00 |
34.00 |
33.00 |
March 1030 Call $21.82 |
short trade |
28.13 |
30.13 |
29.50 |
March 1080 Call $4.68 |
long trade |
3.88 |
4.25 |
4.75 |
March 1085 Call $3.68 |
long trade |
3.00 |
3.38 |
3.38 |
March 1100 Call $1.25 |
sold short trade |
1.25 |
1.50 |
1.63 |
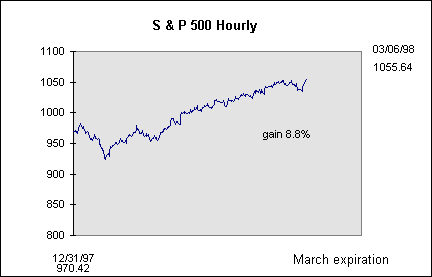
March Expiration March 6th 1998
Last week we mentioned how volatility had been affecting our trades and this week’s Barrons talked about the same thing. We said: "We had a hard time getting into our long call trade this week as the volatility index seemed to be playing tricks on the program. We haven’t seen that in a few years and as we indicated mid-week, it could be a sign of a top. It may have been because of the divergence between the rise in the market and the lowering of the VIX indicator at the TOP of the market and not the bottom." Barrons said; "This measure, gauging the implied volatility’s of four near-the-money call and put options on the Standard & Poor's 100 index, is generally seen as a contrary indicator: a very low reading indicates a market top and vice-versa. That's because low index-option prices are seen as a sign of investor complacency, which can bring rallies to a summary end. Something like this puzzlement is going on in the options markets, where implied volatility’s essentially the prices of index options are drifting lazily lower, even as the Dow industrials power to new records atop 8500." We have to agree that investors have become to complacent in this advance as the market has basically gone straight up. With the selloff on Thursday the volatility index rose from 19.84 on Wednesday to only 22.13 at Thursday’s close. Today the Vix finished the day back below 20 again at 19.75. With the selloff on Thursday one would have expected at least a 25 reading on the VIX and it should have held that level with the S & P 500 up over 20 points. It is surprising how fast the complacency has set in once again. At the start of the 1995 rally the volatility index’s average was 10-13 and it slowly began to rise as the market became higher and higher. It peaked this past August 1997 at 45 when the market sold off strongly. It then went back to its average of 25 (considered very high. Note: technical outlook) as the market began to move higher once again. Since the Dow has broke out of its old high of 8259 the Vix has been descending as if investors believe it is unfathomable for the Dow to move below that level ever again. This is where the divergence has begun. The descending Vix is not an indication of a rally that has just started. It seems to be more of an indication that this rally may be putting in a top when you look at it from a contrary standpoint.
Technically
The market is continuing its strength on momentum alone. It seems that anything fundamental that has been thrown at the market is completely ignored as it continues to move forward. This makes it a good time to take a look closer at technicals to find out where the move may end and were now seeing indicators giving out right sells. With the strong move up you would expect momentum to pick up as registered in the relative strength indicator. The problem is that it has been going down the past two weeks. Nine day RSI has reached its highest level since last July (over 70), which puts it in overbought territory. The fact that the RSI line has started to move lower as prices have climbed has produced a short term negative divergence. The Mclellan summation index has also started to roll over this week producing a sell signal. The last time it did this was at October top. We noted in the article above that the VIX indicator also seems to be flashing a top in the market. The only indicator that appears to be neutral is the Arms index. The Arms indicator has been a great indicator for us the past two years and so it’s hard to ignore it but with so many other indicators flashing sells we must regard them as correct. Looking longer term our bull bear indicator hasn’t been this high in over a year and we’re now only one point from signaling a top. One famous technical analyst has also turned negative on the market for the short term. John Murphy says; "divergence from an overbought region suggests that the current rally may stall (see chart 6). If a setback does take place, the market could find some initial support near Dow 8300. February's stock market rally was supported by stronger global fundamentals and expectations for low inflation and low interest rates in the U.S. With most market averages at new highs, the long-term bullish trend is clearly intact, but several short-term negatives may make the going a bit tougher in March. The bond market will be key: If bond yields stay below 6.15%, any decline in stocks should be minimal. If they don't, we could see a bigger correction than most investors expect in the weeks ahead."
Mclellan Oscillator: 1 100 oversold +100 overbought
Summation Index: 2975
Five day arms: .88 .80 and below, overbought 1.00 and above, oversold
Ten day arms: .91 .80 and below, overbought 1.00 and above, oversold
Bulls: 48.8 previous week 46.0 50% plus overbought/bearish
Bears: 27.2 previous week 28.2 50% plus oversold /bullish
Correction: 24.0 previous week 25.8
Five day Qvix: 20.15 10-15 bullish, low volatility 15-40 bearish, high volatility
Davidson’s View
It is very clear that a surprise isn’t going to move this market lower. We have had Presidential scandals, threats of war, economies collapsing all around us, earnings warnings and even an attempt at profit taking. What will bring it down then? Will it continue higher into oblivion? S & P 500 trailing price earnings closed at 26 on Friday. This is the highest they’ve been since at least well over a year. It is close to a record. This comes at a time when analysts are likely to be lowering earnings forecasts on big cap stocks. On Wednesday, Intel gave us a profit warning and it caused brief profit taking in the market. On Thursday, Motorola announced a profit warning and it created nothing as everyone already knew they were going to be bad but on Friday after the close another big tech company announced a poor profit warning,- Compaq! They’re stock was reportedly falling during after hours trading, -$2.50. Rival, Dell Computer was off -$7.00 and Gateway was down a little. Microsoft was off -$2.00 and a few other tech companies were all off. It is evident that we’re seeing a slowdown with three profit warnings in three days. What will bring the market lower is not all these warnings but be one person and it’s not Allan Greenspan! The very first person who will say enough is enough and just decide to take profits. One person will start, then the second, then the fourth, then the eighth etc etc. Sounds too simple, doesn’t it. If the market was being rational it would react to all of this news even if stock prices weren’t so elevated. The problem has been that people don’t want to miss out on that last penny they might make. Once prices really start declining and stay down, the panic will set in and down we’ll go. I don’t see a slow descent coming either but a very hard fast one like the last few we’ve seen. This past Wednesday I said that the market would sell off on Thursday and "not stay down too long"! When the real selling starts, the market will go much lower then on Thursday. More like 20-25 points on the SPX. I do expect it to do the same thing as on Friday and come back up pretty quick. The only difference will be that it will be a lower high and when people realize that the rally is hitting a wall, the market will go down hard and sit for a while.
MARKET CLOSES
Index |
Last Week |
This Week |
Change |
Percent |
Dow Jones |
8545.72 |
8570.13 |
+24.41 |
0.3 |
S & P 500 |
1049.34 |
1055.64 |
+6.30 |
0.6 |
S & P 100 |
501.93 |
502.73 |
+.80 |
0.2 |
Nasdaq |
1770.52 |
1753.10 |
-17.42 |
1.0 |
30 Year bond |
5.94% |
6.02% |
We will continue to show the 1997 chart plus the 1998 chart until we get further into year.
Current Trades
Our long trade, 1080/1085 is looking very good here even with the market rise. We ran the numbers and have found that there is only an 11% chance of that level being penetrated by expiration. Our outright sell on the 1100 level only has a 4% chance of getting hit by expiration. Most people legged out of the 1025/1030 short trade this week for a nice profit but there are a few people holding out to see if the market declines from here. We have seen good premium depreciation even as the market has moved up. If we get a decent correction, the premium will collapse. When we put the numbers through the program we received a 29% chance of being hit on the trade. This is not good but still a good chance of a close below 1025. Next week will reveal if we’re going to hang onto the trade or not. We’re still waiting for the market to correct before we can get a fill on our long put trade. We have the trade in now but we need a move down to open the spreads as they are very tight from the 1000 level down to 950.
Program Trades
Average Entry price |
bid |
ask |
last |
|
March 1025 Call $24.63 |
short trade |
34.75 |
36.75 |
34.75 |
March 1030 Call $21.82 |
short trade |
30.63 |
32.63 |
32.00 |
March 1080 Call $4.68 |
long trade |
3.38 |
3.75 |
3.38 |
March 1085 Call $3.68 |
long trade |
2.18 |
2.54 |
2.25 |
March 1100 Call $1.25 |
sold short trade |
.50 |
1.00 |
.68 |
March Expiration March 13thth 1998
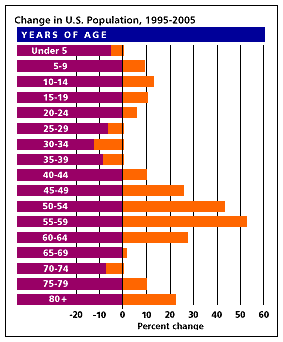
We read an interesting column in Barrons last week that we thought was worth quoting here. We’re all trying to figure out what things will be like in the future and this article does a good job of showing the demographics that we’ll be living with in a few short years.
As a nation, we have a surfeit of "stuff," but an alarming dearth of time for ourselves and each other. Take our morning coffee: It now comes in 25 -- or is it 50? -- flavors, but we haven't a minute to spare for a leisurely sip. In survey after consumer survey, Americans harp more than ever before on the urgent need to regain control of their lives.
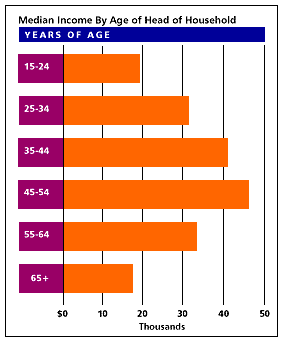
By the year 2000, the Baby Boom generation, 76 million strong, will be in the 35-to-54 age group. Sliced another way, the number of Americans 45 to 54 -- those in their prime earning years -- will rise by 34% through 2005. As they move through middle age, the composition of their spending will shift. "When you're 50 or 60 years old, you've got your toys," says Joshua Shapiro, a New York-based economist for Schroder. "You start traveling, you set up some sort of home office, you spend money on yourself. You're no longer buying a business wardrobe, because you've got one. If it wears out, you replace it. Same with a car." And, with luck, you're not yet spending heavily on medical concerns.
The growth in spending on consumer services is largely the story of Boomer demographics and gains in personal income. The number of Americans aged 45-54 should be 34% higher in 2005 than it was in 1995. In their prime earning years, many already have stated their earlier demand for "stuff." Now they're likely to increase their outlays for a wide range of services, including entertainment, restaurants, insurance and education. As manufacturers and retailers find it tougher to grow, service providers should continue to prosper and multiply.
Strong in numbers, the Baby Boom generation is equally mighty in wealth. By the millennium, economist Edward Yardeni of Deutsche Morgan Grenfell figures, 35-54-year-olds probably will account for 65% of personal income, up from about 53% today. The Boomers haven't aged as their parents did, either, which helps explain their disproportionate spending power. For one thing, they've acquired their "toys" at an earlier age. In the past 25 years, demographers note, women flocked to college in record numbers. Well-educated people married one another and entered the work force, swelling the ranks of wealthy Americans and boosting their incomes to heights once unimagined. A blistering stock market, too, has played a huge role in boosting consumer spending, which last year reached a record $5.5 trillion. With the market now doing our saving for us, the personal savings rate has dropped to a low of around 4% of pretax personal income.
Nonetheless, the spending habits of many Americans, in particular the 20% of the population that controls about 50% of all income, are likely to change fundamentally in the decade ahead. What does that mean for investors and entrepreneurs? In general, the future looks bright for hotel, cruise and casino operators, as well as the owners of restaurants, theaters and spas. We're likely to ramp up our outlays for dog walkers, party planners, personal trainers, financial advisers and companies such as Service Master, franchiser of the much-in-demand Merry Maids. In the past few years, consumer spending on services has been steadily on the rise. Not surprisingly, annual inflation-adjusted outlays on medical services, which now account for 15% of all consumer spending, have increased by a healthy 23% since the decade's start. Given the impressive length of the current economic expansion, it's easy to see why growth in services consumption is rising smartly. Credit-sensitive, big-ticket items, chiefly autos and housing, typically lead the way out of recession, as was the case in the early to mid-1990s. Last year's strong showing in housing and durables owed to a sharp drop in rates. Once consumers replenish essentials, however, they typically turn to spending on recreation and other discretionary pursuits. We're looking now for great escapes and great adventures, and are willing to spend big bucks on almost anything that educates, amuses and entertains, and relieves us of our daily cares. So, does this article fit you? What will you spend your money on in the future? Do you think that the economy will continue to prosper or flatten out?
The growth in spending on consumer services is largely the story of Boomer demographics and gains in personal income. The number of Americans aged 45-54 should be 34% higher in 2005 than it was in 1995. In their prime earning years, many already have sated their earlier demand for "stuff." Now they're likely to increase their outlays for a wide range of services, including entertainment, restaurants, insurance and education. As manufacturers and retailers find it tougher to grow, service providers should continue to prosper and multiply.
Technically
The market is continuing in its overbought situation but has now been confirmed by the Arms index and the summation index. Arms is hitting 80 and the closer the summation index closes in on 3000, the more of a chance the current uptrend will weaken. Momentum continues to show any real strength of a good rally and opens up the market to strong profit taking. This is not good as the S & P 500 and Dow are 5% above the 50 day moving average. In the past this has always been a signal of a top but we have been surprised on how long the market has held above that level. The S & P 500 specifically has been 10% stronger then the Dow, Nadaq and Russell 2000 in this move. The only indicator that is giving any good signs for a higher market is the volatility index but as we mentioned last week the indicator in our view has been moving lower due to complacency, thus, it is not giving a true indication of the market. Were at a top in the market, not the bottom.
Mclellan Oscillator: 21 100 oversold +100 overbought
Summation Index: 2761
Five day arms: .82 .80 and below, overbought 1.00 and above, oversold
Ten day arms: .85 .80 and below, overbought 1.00 and above, oversold
Bulls: 48.8 previous week 48.8 50% plus overbought/bearish
Bears: 27.6 previous week 27.2 50% plus oversold /bullish
Correction: 23.6 previous week 24.0
Five day Qvix: 19.23 10-15 bullish, low volatility 15-40 bearish, high volatility
Davidson’s View
We’re now guaranteed that this next week will be a downer! Louis Rukeyser took the week off from his television show Wall Street Week! When a person looks at all the weird indicators such as hemlines, superbowl indicators, 1st week of January indicating the whole years gains, one of the best indicators has been the "Rukesyer indicator". It seems that whenever he takes the week off, the market plummets the following week. Last year every time he took a week off the market fell. I’m not sure about his overall track record but last year’s 100% accuracy sounds pretty good to me! He always jokes about it every time he returns to the show. I know it’s pretty dumb but heh what’s another indicator! Billionaire investor Warren Buffett told shareholders Saturday there are fewer bargains in the market today and rising stock prices have eroded the margin of safety for investors. His cautious letter will probably not sit well with investors on Monday and so you can almost guarantee a lower day Monday. Last year when he said that all stocks were expensive he created a correction in the overall market!
Another record was also broken this week. The Dow has gone up 7 weeks in a row. It’s been tied before, but for the past few years has never seen 8 weeks in a row. These two indications plus the fact that the market is strongly overbought give good reason to believe that next week will be a down one. It is also looking more and more like the indexes are hanging out on a pole, slowly leaning over as their advance slows. If we do correct here I think the market may continue rallying into April where a longer term top may be made. I’m mostly concerned with next week, however, and was quite surprised on Friday. Before trading started it looked like we were going to have a strong day as globex futures were up, the 30 year bond was lower, and the producer price index was so positive for the market. Why shouldn’t it go higher! Plus, last Friday saw a huge rally, so why not this week! We started the day with strength but before long the market slowly began to ebb away. Volume was also very weak so I was surprised that by the close the Dow and the S & P would be near their lows. For all of these reasons I believe we’ll see more profit taking and will hold to my prediction of 8300 on the Dow and the 1019 level on the S&P.
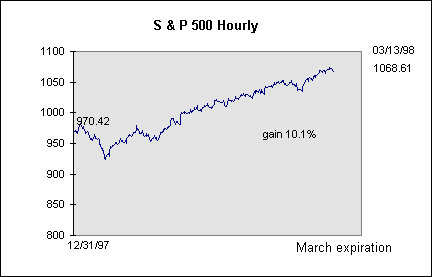
MARKET CLOSES
Index |
Last Week |
This Week |
Change |
Percent |
Dow Jones |
8570.13 |
8602.52 |
+32.39 |
0.4 |
S & P 500 |
1055.64 |
1068.61 |
+12.97 |
1.2 |
S & P 100 |
502.73 |
508.46 |
+5.73 |
1.1 |
Nasdaq |
1753.10 |
1771.66 |
+18.56 |
1.0 |
30 Year bond |
6.02% |
5.86% |
We will continue to show the 1997 chart plus the 1998 chart until we get further into year.

Current Trades
Our long trade, 1080/1085 is looking very good here even with the market rise. We ran the numbers and have found that there is only a 14% chance of that level being penetrated by expiration. Our outright sell on the 1100 level has only a 3% chance of getting hit by expiration. We’re still waiting for the market to correct before we can get a fill on our long put trade. We’re very disappointed that we couldn’t get into the ultra’s this month due to the fact that they had the looks of put options instead of calls. All month the bid on the 1100 matched the ask on the 1105 making it impossible to trade.
Program Trades
Average Entry price |
bid |
ask |
last |
|
March 1025 Call $24.63 |
short trade |
34.75 |
36.75 |
34.75 |
March 1030 Call $21.82 |
short trade |
30.63 |
32.63 |
32.00 |
March 1080 Call $4.68 |
long trade |
3.38 |
3.75 |
3.38 |
March 1085 Call $3.68 |
long trade |
2.18 |
2.54 |
2.25 |
March 1100 Call $1.25 |
sold short trade |
.50 |
1.00 |
.68 |
March Expiration March 20th 1998
Another expiration come and gone... We haven’t taken a look at the expiration cycles of rallies and corrections in a while so we thought we would update everyone on the current rally. We believe that for a true correction to occur the market needs to move lower for a period longer than a couple of weeks or today’s standard of hours! 10% between two expiration periods seems to be more like a decent correction.
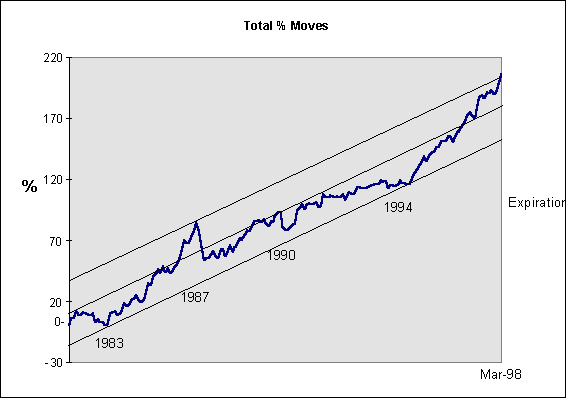
Percentage wise, we’re now well past the high of 1987 when you look at the rally since 1990. Interestingly, even if we do include the 1994 correction, we’re now above (in percentage terms) the `87 high. Twice last year the overall market has had a 10% "correction". Since the market’s old high in August, the market had mostly gone sideways. It corrected about 10% just after the October expiration period but immediately came off its lows with a sharp 6% rally. As we already said, we believe that a genuine correction in the market lasts longer than a few days or hours. Also, the market needs to consolidate the decline as in 1987 and 1990. We believe that a good correction will endure through an expiration period and be at least 10% lower at expiration. We have not seen such a correction since 1990. It has always been our view that with the multiple of derivative strategies being employed it is not to the benefit of institutions for an expiration period to be too low or too high since institutions are now big sellers of options. They prefer to keep 82% of all options expiring worthless since its a great cash grab for them. The past few years have seen volatility die down around expiration as the institutions now complete their strategies before expiration finishes. This past expiration period was not a great example of that. Last month we saw a expiration with an 8.5% gain. This past month saw a 6.1% move with big swings upward on the last day of expiration. If you look at the chart below we have now reached the upper band since the 1987 expiration peak. It appeared from all angles economic, fundamental and technical, that the market was going to plane out this past month. With the 6.1% increase that didn’t happen. So, what will happen next month? Read Ken’s outlook?
Technically
On all points the market continues to be overbought. The summation index is strongly overbought but the market usually doesn’t react right away to this indicator so it could remain overbought for some time yet. Last week appeared that relative strength was giving a sell signal as the market continued to advance as RS continued to decline. This week it turned up strongly along with momentum and doesn’t show any signs of peaking yet so there may still be room left on the upside for the market. We are also watching the volatility index closely as it continues to decline in price and this in our view is a divergence. The lower number right now is showing complacency, not the start of a bull rally. S & P said on Friday that their Point and figure charting has just now moved into overbought territory with there percentage of stocks moving over their key number of 70. Because of this they recommend not buying any stocks. Stocks are oversold if the number goes below 30.
When the market has moved up so strongly as it has the past couple of months it can appear that it should turn and correct sharply. Generally that doesn’t occur however. When the market does correct after a move like this it is usually shallow and becomes oversold very quickly. This is what will likely be the case when the market does correct.
Mclellan Oscillator: 33 100 oversold +100 overbought
Summation Index: 3210
Five day arms: .84 .80 and below, overbought 1.00 and above, oversold
Ten day arms: .84 .80 and below, overbought 1.00 and above, oversold
Bulls: 48.0 previous week 48.8 50% plus overbought/bearish
Bears: 27.6 previous week 27.2 50% plus oversold /bullish
Correction: 24.4 previous week 23.6
Five day Qvix: 18.78 10-15 bullish, low volatility 15-40 bearish, high volatility
Davidson’s View
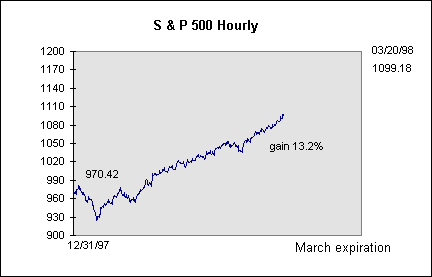
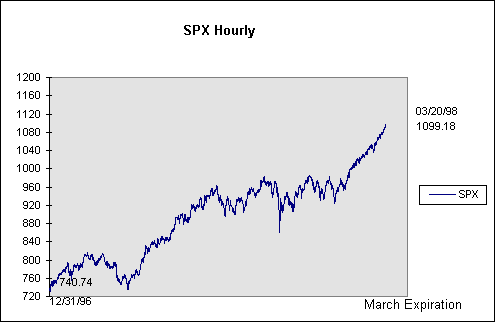
Well, today was up, down and all around with a big push up at the close. So now what? Do we continue higher from here? We have many mixed signals. We have just been through two basically straight up months. The move is similar to two othertime periods. One being quite recent and the other way back in 1987. Last May/June saw a move straight up where the market from bottom to top on the hourly chart rose 29%. From the break out peak it was up about 16%. The rally we’re currently in from bottom to top is 16%. From the breakout level it is 11% higher. Today will equal the time frame that occurred last year so this should represent the top. The question is, should we look at the time frame or the distance. If we take the time frame, today is the top and the market will correct about 6% on an hourly basis. It will then turn around about two weeks before expiration and close about 2% higher overall for the April expiration. Nice and volatile, just what we like. The other possibility is that we just continue higher since our percentage numbers are so low. If we look at the overall expiration totals, the May, June, July 1997 cycle saw a total of 18.8% up move before there was another down month. So far in this cycle (3 months) we have a total of 15.8%. This means the market could be up at least 3% more or 1135 on the S & P 500, 9160 on the Dow and 540 on the S & P100.
The other side of this is that we are in a real blow off. In 1987 the high valuations of stocks were the same as they are now and the repeated ignoring of bad news is the same. It is something to consider. In 1987 the three strongest months of the start of the blow off totaled 19%, Jan, Feb., Mar. The market settled down but the total for the blowoff was 27%. There was then a brief -3% break and then another 16% run over 4 months. After that you know what happened; crash! Economically speaking we were in a much different situation. Rising inflation and interest rates. There was also a rising trade deficit but that didn’t start to affect the market until after the crash. Currently, we’re at the lowest point ever on the inflation front. It is possible that the market is looking further out and realizing that we could move into a period of rising interest rates. If so, the goal would be to move the market now so the bull move doesn’t have to end. We have always believed that when the markets ignore bad news and are blowing off to the upside that they are pushing the market up so when it comes back down it never has to break the upward trendline. It may sound irrational to think that but when you look at how 1987 turned out it makes sense. The market never even broke the lower trendline and just continued higher. If we were really moving into a bear market we would have broken the lower trendline. This coming month shouldn’t see the market move up to much or down to much because of the big run up we’ve had this past two months but hopefully a little more volatility will come. None the less, this should make for an exciting month. The program numbers for the month came out quite interesting and will be sent out tomorrow. It will really take something and some time for this bull to die but we can’t go straight up forever. Then again maybe we can? 60% plus on the Dow this year? Nah!!
MARKET CLOSES
Index |
Last Week |
This Week |
Change |
Percent |
Dow Jones |
8602.52 |
8906.43 |
+303.91 |
3.5 |
S & P 500 |
1068.61 |
1099.18 |
+30.57 |
2.9 |
S & P 100 |
508.46 |
525.24 |
+16.78 |
3.3 |
Nasdaq |
1771.66 |
1789.16 |
+17.50 |
0.9 |
30 Year bond |
5.86% |
5.88% |
We will continue to show the 1997 chart plus the 1998 chart until we get further into year.
S & P 100 Expiration 525.24
S & P 500 Expiration 1095.45
Current Trades
This month didn’t turn out too badly considering that we squeaked out a small profit, 32%, on our 1025/1030 short trade with the leg out and we only had a small loss, 23%, on the 1080/1085 by also legging out, so the month basically equaled out. We did have another 4% profit on our 1100 call outright sell this month bringing the total to 8% for this year. Hopefully this figure will eventually beat the S & P’s gains. Hopefully the numbers will open up for us to get into an Ultra this month.
Copyright c 1996. All rights reserved. The information contained in the AGORA OUTLOOK NEWSLETTER is based upon data that is believed to be accurate, but is not guaranteed, and subject to change without notice. All projections, forecasts, opinions, and track records cannot be guaranteed to equal our past performance. Persons reading this newsletter are responsible for their actions. Officers and employees of this publication may at times have a position in the securities mentioned, or related services.
Short Trades |
Long Trades |
Ultra Trades |
Short Sells |
|||||
1998 Current |
-43% |
1998 Current |
-44% |
1998 Current |
10% |
1998 Current |
8% |
|
1997 |
108% |
1997 |
188% |
1997 |
82% |
|||
1996 |
163% |
1996 |
169% |
1996 |
99% |
|||
1995 |
93% |
1995 |
76% |
|||||
1994 |
79% |
1994 |
89% |
|||||
1993 |
177% |
1993 |
long |
|||||
1992 |
112% |
1992 |
long |
|||||
1991 |
162% |
1991 |
long |
|||||
1990 |
166% |
1990 |
long |
|||||