The letters displayed here start with expiration and then work to the start of the expiration cycle.
Agora Outlook
Publisher Ken Davidson
Fax 250-860-2051
e-mail davidson@silk.net
www.agoraoutlook.com
Davidson’s View
Last week we caught the fragrance of euphoria but this week brought a whiff of fear. The market reminded us that it actually does go down as well as up although the Nasdaq Composites big turnaround on Wednesday still makes me think that investors are mostly ignoring the news this past week.
Analysts believe it is now more likely that the Brazilian crisis will spread to other countries in Latin America which would be bad news for the U.S. and consequently Europe and Asia. On Thursday, $1.8 billion in capital outflow left Brazil. Some analysts believe that Latin America, European markets, and, possibly, the U.S markets, could see a 20% correction if Brazil starts to raise interest rates now that they have floated their currency. This would start a recession and thus follow through to Europe and then the U.S. We have been waiting for a slowdown here for over a year but only time will tell if it will come or not. We may need to see Dow 43,000 first. Hmmm.. isn’t that the same level Japan hit at their peak 9 years ago!
Of interest this week was AMG’s report that $2.8 billion came out of mutual funds this past week. It is surprising to see outflows in January, something I haven’t seen in some time. Outflows have been rare throughout this entire bull market, and especially in the last four or five years. If we do fall into a recession, people will take money out of the market. This will hold money back from the big caps and they could then join the laggard stocks. The advance/decline line is 24000 points away from the July high of 1998.
The question is this: Is the public taking money out of mutual funds so it can join in the Internet frenzy? Do they need the money or are people just being smart as I mentioned in my yearly outlook? It is very strange to see money come out of funds in January. There have been many layoffs the past few months that we have been reporting about so people may need the cash. They could also be putting it into even more speculative stocks. The internet mania has been well publicized the past few months on television and when you see a stock like "Marketwatch" go up over 400% in a matter of hours it could be very tempting. It will be important to watch the mutual fund flows the next few weeks to see if this becomes an ongoing situation.
Shorter term, it could also be that the public just wants to take their money out until after everyone knows for sure that President Clinton isn’t going to be taken out of office. If he were taken out it would be bad for the market but also a great buying opportunity. I have mentioned in the past how I feel that the public is getting wiser when it comes to investing. Perhaps this is evidence of what is happening.
We seemed to have rebounded today due to an oversold condition and the fact that it was an expiration day. We could also believe that Brazil’s floating currency saved the day but even I don’t think institutions are that gullible. Then again, one never knows!
Allan Greenspan is making a speech before congress next week and it could have quite an
effect on the market if he makes any more "irrational exuberance" speeches. What
will be even more interesting is if the market blows his idle comments away once again. It
looks like the week could be interesting and we‘ll be there letting you know what
happens along with placing our trades for next month..
Technicals
Mclellan Oscillator: -71 -100 oversold +100 overbought
Summation Index: +1408
Five day arms: 1.05 .80 and below, overbought 1.00 and above, oversold
Ten day arms: .92 .80 and below, overbought 1.00 and above, oversold
Bulls: 60.0 previous week 58.3 50% plus overbought/bearish
Bears: 30.0 previous week 30.0 50% plus oversold /bullish
Correction: 10.0 previous week 11.7
Five day Qvix: 30.36
Economic Effects
Wednesday
U.S. consumer prices barely moved in December, causing the government's main inflation gauge to end 1998 with its smallest annual rise in 12 years, the Labor Department said Thursday. The Consumer Price Index rose by 0.1% last month after a 0.2% rise in the prior month. That brought the increase for the year to just 1.6%, the weakest since a 1.1% rise in 1986 when the CPI was held down by plummeting energy prices. There was a pickup in the closely watched core CPI, which excludes volatile food and energy costs, but that was mainly the result of a spike in tobacco costs. The rise in tobacco prices was widely expected after announcements by tobacco companies, and economists have tended to view it as an isolated phenomenon that is not reflective of economic trends. The core CPI rose by 0.3% last month after a 0.2% increase in November.
The latest inflation figures were flatter than most economists had projected. Economists had projected a 0.2% rise in the CPI in December and a 0.4% increase in the core index.
Jobless claims totaled 352,000 in the week ended Jan. 9, down from a revised 356,000 in the prior week. Economists had expected jobless claims to fall to 333,000. The job market is generally tight, with the U.S. unemployment rate of 4.3% close to its lowest level in three decades. But jobless claims have been trending higher in recent weeks. Economists have said it was unclear whether that suggests some deterioration in the jobs picture because the claims figures tend to be erratic around the Christmas and New Year holidays. Bad weather in parts of the country toward the end of December could also have skewed claims by forcing construction sites to close. The four-week average of jobless claims rose to its highest level in more than five months. The four-week average climbed to 342,250 in the week ended Jan. 9 from 329,250 in the prior week.
Brisk demand for new cars pushed U.S. retail sales up strongly in December but there was no sign of a Christmas rush at clothing and merchandise stores where business weakened from November. The Commerce Department said total retail sales increased a stronger-than-expected 0.9% last month to a seasonally adjusted $231.35 billion after a 0.6% gain in November. General merchandise store sales dropped for the first time since July while clothing-store sales were down. Mild weather during the first half of December, when the monthly survey was taken, may have been a factor depressing sales of winter clothing.
Excluding new cars, December retail sales were up a modest 0.4% following a 0.6% November increase. New car sales climbed 2.5% to a seasonally adjusted $57.98 billion in December after a 0.7% rise in November. The only other category of goods that posted strong monthly sales was building materials, up 1.3% to $14.44 billion following a 1.6% jump in November.
For the whole of 1998, U.S. retail sales increased 5.1%. That was stronger than 1997's 4.3% pickup in annual sales but trailed a 5.7% gain in 1996.
Spending by consumers fuels 2/3rds of U.S. economic activity and has been important in the long expansion from the 1990-91 recession. Most economists anticipate a fairly steady pace of spending ahead.
A report by the Conference Board predicted that strong job growth and stock market gains have kept incomes rising and would keep spending on a rising trend for some time.
Real average weekly earnings, after adjusting for inflation and seasonal factors, rose 0.5% in December. The December rise followed a revised 0.2% drop in November real average weekly earnings, which was previously reported as up 0.1%.
The December increase resulted from a 0.4% rise in average hourly earnings and a 0.3% increase in average weekly hours. The earnings increase was partially offset by a 0.2% gain in the Consumer Price Index for Urban Wage Earners and Clerical.
In constant 1982 dollars, weekly earnings for nonsupervisory private workers outside the farm sector averaged a seasonally adjusted $270.22 in December, versus $268.89 in November and $264.80 in December 1997.
Next week’s Economic Indicators
This coming week is quiet as far as reports go. The first report is on Wednesday with Housing Starts. The report will likely hold little importance for the market as we have been seeing record Starts of late. On Thursday we get Jobless Claims and International trade figures. The trade figures may become to be important for the market as the dollar’s downward trend brings mounting concern as does the shakiness of overseas cuuencies.. Strong trade deficits are not good for stock markets. (Note the 1987 stock market crash) The markets will likely trade more on technical factors this week as reports aren’t that important to trade off of.
MARKET CLOSES
Index |
Last Week |
This Week |
Change |
Percent |
Dow Jones |
9643.32 |
9340.55 |
-302.77 |
3.1 |
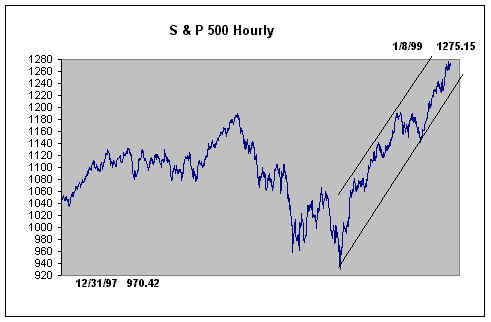
S & P 500 |
1275.15 |
1243.26 |
-31.89 |
2.5 |
S & P 500 Futures Dec. |
1287.00 |
1249.10 |
-37.90 |
2.9 |
S & P 100 |
636.11 |
616.46 |
-19.65 |
3.1 |
Nasdaq |
2344.95 |
2348.21 |
+3.26 |
0.1 |
Russell 2000 |
431.21 |
426.91 |
-4.30 |
0.9 |
30 Year bond |
5.27% |
5.11% |
S&P 100 Expiration Number: 616.46
S&P 500 Expiration Number: 1223.64
S&P 500 Futures January Options Expiration: 1248.60
We will continue to show the 1998 – 1999 year chart for a few weeks
until there is
more data to display just the 1999 chart.
Program Trades
This month was a quiet month for trades as the Christmas season normally sees most investors away for vacations but we still saw great profits, anyhow, for the start of the year. Although January expiration cycles are usually quiet, this one turned out to be quite exciting in the end. Unfortunately, this type of trading isn’t meant to be exciting, but boring, so we can do more interesting things like,,,, skiing!
All of our trades expired worthless this month except the Long OEX Call trade. Because
of the month being scattered there were many individual trades that were done for
subscribers that were not listed here so we are going to consider it neutral. It was only
a .12 cent loss anyhow. We have always said that our main Long trades come from the
S&P 500, of which, the 1250/1255 calls expired worthless.
The coming February cycle should also be exciting but will likely be a bit easier as the
market has realised that it really can go down!
Current Trades
Average Entry price |
Bid |
ask |
last |
|
Cash Trades: |
||||
1250 sold SPX Call $10.25 |
Long trade |
0 |
0 |
0 |
1255 bought SPX Put $8.93 |
$1.32 credit spread |
0 |
0 |
0 |
615 sold OEX Put $5.38 |
Long trade |
1.46 |
1.46 |
1.46 |
620 bought OEX Put $4.00 |
$1.38 credit spread |
0 |
0 |
0 |
1275 sold SPX Call $5.00 |
Ultra Call Trade |
0 |
0 |
0 |
1285 bought SPX Call $3.62 |
$1.38 credit spread |
0 |
0 |
0 |
1275 sold SPX Feb.Call $35.00 |
Short trade |
0 |
0 |
0 |
1300 bought SPX Feb.Call $22.50 |
Closed out for $4.18 PROFIT. |
0 |
0 |
0 |
Trades for February |
||||
1100 sold Feb. SPX Put $8.50 |
Short Sell |
8.50 |
8.75 |
8.50 |
1100 sold SPX Feb. Call $12.50 |
Ultra Call Trade |
8.50 |
8.75 |
8.50 |
1075 bought SPX Feb. Call $9.75 |
$2.75 credit spread |
6.75 |
7.50 |
8.00 |
S&P 500 Options Futures Trades |
Low |
High |
Close |
|
Sold 1250 Call $8.50 |
Long Trade |
0 |
0 |
0 |
Bought 1260 Calls $6.25 |
$2.25 Credit |
0 |
0 |
0 |
Sold 1275 Call $3.00 |
Ultra Trade |
0 |
0 |
0 |
Bought 1280 Call $2.00 |
$1.00 |
0 |
0 |
0 |
Trades for February |
||||
1100 sold Feb. SPX Put $8.00 |
Short Sell |
8.00 |
12.00 |
8.80 |
1100 sold Feb. SPX Put $14.00 |
Ultra Trade |
8.00 |
12.00 |
8.80 |
1090 sold Feb. SPX Put $12.50 |
11.00 |
8.00 |
8.00 |
|
Copyright © 1998. All rights reserved. The information contained in the AGORA OUTLOOK NEWSLETTER is based upon data that is believed to be accurate, but is not guaranteed, and subject to change without notice. All projections, forecasts, opinions, and track records cannot be guaranteed to equal our past performance. Persons reading this newsletter are responsible for their actions. Officers and employees of this publication may at times have a position in the securities mentioned, or related services.
Short Trades |
Long Trades |
Ultra Trades |
Outright Short Sales |
|||||
| 1999 Current | 17% |
1999 Current | 28% |
1999 Current | 14% |
1999 Current | ||
| 1998 | 66% |
1998 | 43% |
1998 | 79% |
1998 | 71% |
|
| 1997 | 108% |
1997 | 188% |
1997 | 82% |
|||
| 1996 | 163% |
1996 | 169% |
1996 | 99% |
|||
| 1995 | 93% |
1995 | 76% |
|||||
| 1994 | 79% |
1994 | 89% |
|||||
| 1993 | 177% |
1993 | long |
|||||
| 1992 | 112% |
1992 | long |
|||||
| 1991 | 162% |
1991 | long |
|||||
| 1990 | 166% |
1990 | long |
|||||
Futures Trades
Outright Sells & Strangles |
Long Trades |
Ultra Trades |
| 1999 Current | 1999 Current 23% | 1999 Current 16% |
| 1998 130% | 1998 93% | 1998 16% |
Agora Outlook
Publisher Ken Davidson
Fax 250-860-2051
e-mail davidson@silk.net
www.agoraoutlook.com
Davidson’s View
Seriously though, everyone knows that I don’t make outright yearly predictions because I think it is ludicrous to time the market for an entire year, as anything can happen to change the direction. What I really see is basically in line with most analysts who say the upside for the Dow is still only around 10,000 and the downside is susceptible to some volatile swings but the market will likely be flat with single digit gains this year.
The main thing, I believe, that will affect the market is the very thing that is driving it higher right now - liquidity! The market has been rising on a very few stocks as evidenced by the weak advance/decline line and some other interesting statistics. If you took out the strongest 8 stocks in the Dow last year it would have only been up 4%. The S&P 500 saw 289 stocks up for 1998 and 206 down with 5 being flat. The average increase for all stocks was 13% but if you just look at the top 50 stocks you see an average increase of 47%. If you take the top 10, the average increase was over 60%. As you can see, it wasn’t many stocks that moved the S&P 500 higher. Tech stocks are becoming more prevalent in the index as 19% of the index is now technology shares. Microsoft alone accounts for a 3.2% weighting in the index.
This is purely a liquidity driven market. There's very strong cash flow into deferred compensation and pension plans and the managers of that money don't want to hold cash very long. With all of the money coming into mutual funds right now the money has to go somewhere so they buy big-cap stocks, and despite their understanding that these companies are overvalued, investors fear missing out on rallies. There will be times though that even though there might be more of a market for big-cap names, investors will be looking for an out when the rally stops or valuations get to the highest extremes. Bill Fleckenstein commented that, when things start to fall apart there is no escape even for big caps and that is why he won’t have anything to do with them.
One thing to note is that when 1997 started there was a record amount of money going into mutual funds as well, but the market was moving down due to fears surrounding the Asia collapse. One can expect the same thing this year. The market may continue to rise as rumors come out because of all the cash floating around but when the actual news hits the front pages or something really tumultuous happens we’ll likely see some sharp moves downward as in 1998 though probably but short-lived and not as deep.
Another important factor is that the public gives the market its money and it has done a pretty good job in timing the market the past 5 years. They have pulled money out when the market looks toppy and then have put it back in when it has fallen.
If we look at what’s happening right now, the market has moved almost perpendicular to the up side since early October. When this rally ends, I think volatility will die down and we’re going to see a flatter market for the rest year as I noted above. The main reason being the frightening Y2K rumors and what the equity research team at Morgan Stanley Dean Witter has found. The near-vertical spikes in gauges of market turmoil in the August-September periods of both 1998 and 1997 were called "volatility storms." With valuations hitting 60.0. Looking at earlier patterns for insights into 1999, they expect a continued subsidence of market volatility toward its historical average of 13%. Currently, the indicator is around 24.0. That could mean a less treacherous environment for us credit spread and outright sellers. 1990 to 1995 saw a rising market with decent profits but the flatness of the market was perfect for us and that is what we're expecting this year. Upward volatility will be restrained by overseas worries, a possible economic slowdown in the U.S., slowing earnings and the highest valuations of all time.
Of course, at the moment, the market is not being rational and this week had to have been one of the most unbelievable weeks as we saw internet stocks once again make huge gains. A few of them saw 70% gains this week alone. The funny thing is that they don’t even make any money yet. They have driven the Nasdaq Composite almost straight up the past few weeks and that is not sustainable. When we do see a break it’s not going to be pretty, but it won’t end the upward stance of the market.
Final Note:
So, looking back on the profits of the past year and to those we hope to see in the new year, let’s remember that, "it is more blessed to give than to receive."
Technicals
There isn’t an indicator that I know of that is not overbought in the Short or Long term. This isn’t much of a surprise considering the move the market has made the past few weeks. The most important indicator to watch right now is momentum. It continues to recede even though prices have continually moved higher. This could create a huge break to the downside if it doesn’t start to move up. This doesn’t seem likely, though considering the height of the market.
The Mclellan Oscillator is overbought short term but with the Summation index now over 0 it makes the indicator neutral. Important to note is the fact that the summation index has been in a downslope since last year and if it breaks down, the market could be in bigger trouble for the long term.
The 5 day Arms index is overbought but the 10-day Arms is neutral. Once again, with the movement in the market, one needs to concentrate on the 5 day for more of a predictive value as there could be a break at anytime.
The Bull/Bear indicator continues to show that there is too much bullish optimism and the market needs to pull back. This is a contrary indicator.
Volatility has been surprisingly low considering the straight up move of the market. One could conclude that if the market falls we could exceed prior highs of last year’s +65.00 readings. The put/call ratio has remained under 1.00 for sometime now meaning that there is a lot of call buying going on and little put buying as everyone is confident the market will not fall. This is another contrary indicator. If we start to see readings over 1.00 the Vix indicator could start to shoot up.
Last week the Nasdaq Composite had a gap open higher missing the 2248 to 2260 level. Generally, whenever we see a gap open up like that an index will move back to that level to fill in the gap. The Nasdaq Composite closed at 2344.95 on Friday almost one hundred points above that level. If the tech sector led the market up it will likely pull it back down about the same amount. The internet stocks just may give that catalyst. The reason: premiums are expensive. The 20-stock index, trading at the Philadelphia Stock Exchange, closed up 24.67, or 5.2%, at 499.77 on Friday. To buy an at-the-money call for this month, the January 500 calls (DOT AT), an investor has to pay 71 15/16. In other words, the index has to jump above 572, a 14% gain, in the next five trading sessions to make any money.
Mclellan Oscillator: +98 -100 oversold +100 overbought
Summation Index: +1507
Five day arms: .80 .80 and below, overbought 1.00 and above, oversold
Ten day arms: .88 .80 and below, overbought 1.00 and above, oversold
Bulls: 58.3 previous week 57.1 50% plus overbought/bearish
Bears: 30.0 previous week 30.3 50% plus oversold /bullish
Correction: 11.7 previous week 12.6
Five day Qvix: 23.74
Economic Effects
Monday
Manufacturing activity slowed in December for the seventh straight month, declining at a faster rate than economists had expected, as global economic problems continued to hinder exports. The National Association of Purchasing Management reported Monday its monthly index of business activity fell to 45.1% last month, down from 46.8% in November. Economists had predicted the index would rise slightly. Anything under 50% is a sign of contraction in the industrial sector. The report is compiled from a survey of corporate purchasing executives nationwide. I t is widely followed by economists because it is usually the first indicator of how the economy performed in the previous month. New orders continue to be weak as we proceed into 1999 prompting concerns about the manufacturing sector as we move into the first quarter. Exports continued to decline, although at a slower pace, as purchasing executives expressed concern about the steel industry in particular, the report said. Prices dropped at a faster rate, a trend that plagued the manufacturing sector through all of 1998. Production also declined at a faster clip. Despite the decline in manufacturing, the economy recorded its 92nd consecutive month of growth in December, the report said. If the economy’s expansion continues past this year, it would become the longest such period in U.S. history.
Tuesday
Construction spending rose in November for the sixth straight month, led by unyielding gains in single family home building and a jump in spending on public works projects.
November construction spending rose 0.9% to a seasonally adjusted annual rate of $677.8 billion after a less impressive gain of 0.3% in October, the department said.
The November increase exceeded the 0.5% gain that had been expected by U.S. economists surveyed by Reuters and marked the first time since the spring and summer of 1993 that construction spending rose for six months in a row.
The residential housing market, especially single-family homes led the gain, where spending rose 1.8%. Although construction starts on all types of housing declined in November, the pace of starts on single family homes was near a 15-year high.
Wednesday
New orders to factories rebounded in November, partially recovering from a sharp decline the month before, but analysts are watching a worrisome year-end spike in unemployment benefit applications.
Orders rose 0.6% to a seasonally adjusted $337 billion, following a 1.7% plunge in October, the sharpest in five months. It was the fifth increase in six months, suggesting the economy was trying to close 1998 on a strong note. For the first 11 months of the year, factory orders were 2% higher than the same period of 1997. For much of the year, healthy gains for computers, communications equipment and autos have helped offset a drop in orders to steel mills and a lackluster increase at aircraft plants, reflecting the world economic slump that began in Asia in the summer of 1997.
Jobless Claims dropped -22,000 this past week moving to 350,000. Claims had hit an eight-month low of 289,000 during the week ended Dec. 19 before posting the largest increase in six years during Christmas week. Economists cautioned against reading too much into the volatile weekly figures until a clear trend has been established.
A four-week moving average of claims rose by 5,500 to 327,500 last week, the most since July when the GM strikes swelled unemployment numbers.
Major retail chains said deep discounts just before Christmas and right after the
holiday lifted retail sales in December to respectable levels following a disappointing
start. Retail stocks fell after the release as it was mixed and not what economists had
expected to see.
A burst of year-end hiring returned the nation’s unemployment rate to 4.3% last
month and helped produce in 1998 the strongest peacetime labour market in four decades.
The seasonally adjusted rate, down from 4.4% percent in November, returned to the level
reached in April and May and, before that, in 1970. For the year, unemployment averaged
4.5%, the lowest since 3.5% in 1969 during the Vietnam War. The 1998 mark was the lowest
peacetime rate since 1957, when it averaged 4.3%. Employers added 378,000 jobs to their
payrolls, the most in 15 months and nearly double what analysts anticipated. Some of the
gain reflected unseasonably warm weather, which produced a huge 104,000 gain in
construction but much of it reflected the U.S. economy’s resilience in the face of
the global economic slump that began in Asia a year and a half ago.
Next week’s Economic Indicators
The first report comes out on Wednesday as the Producer Price Index is released. The commodity index has seemed to bottomed the past week and we could see some reaction to the report if wholesale inflation appears to be picking up. On Thursday we get Jobless Claims, the Consumer Price Index and Retail Sales. These reports are mostly minor but the CPI number could move the market if there was a reaction to the PPI Wednesday. Friday is an expiration day so the market will likely move more on that more than the reports which are, Business Inventories Industrial Production and Import/Export Prices. Industrial Production could be an important report if productivity continues to fall.
MARKET CLOSES
Index |
Last Week |
This Week |
Change |
Percent |
Dow Jones |
9181.43 |
9643.32 |
+461.89 |
5.0 |
S & P 500 |
1229.23 |
1275.15 |
+45.92 |
3.7 |
S & P 500 Futures Dec. |
1245.50 |
1287.00 |
+41.50 |
3.3 |
S & P 100 |
604.21 |
636.11 |
+31.90 |
5.3 |
Nasdaq |
2192.55 |
2344.95 |
+152.40 |
7.0 |
Russell 2000 |
421.98 |
431.21 |
+9.23 |
2.2 |
30 Year bond |
5.09% |
5.27% |
For a few weeks we will continue to combine the the 1998 chart with 1999 statistics.
Program Trades
With the cash S&P 500 sitting at our Ultra Conservative level, we’re a little bit nervous for this expiration and are looking at closing our positions to protect them from losses. For both the cash and futures Ultra trades, the Program has registered a still strong 79% likelihood for full profits. However, when we move under 80% we like to protect ourselves just in case. The Long trade’s number fell strongly this week with only a 74% probability of full profits. We still expect the market to come down this week but maybe not enough for the 1250 level to be reached.
The market, overall, is in a blow-off mode with the Dow having been up 5% for the first week of the New Year alone. If this were to happen every week of the year, the Dow would be up 260% at the end of the year.
We do expect a break sometime sooner than later so we are going to apply heavy Short positions this coming week. Last week the Nasdaq Composite had a gap open higher at the 2248 level. Generally, whenever we see a gap open up like that an index will move back to that level to fill in the gap. The Nasdaq Composite closed at 2344.95 on Friday, almost one hundred points above that level. If the tech sector led the market up it will likely pull it back down about the same amount.
Current Trades
Average Entry price |
Bid |
ask |
last |
|
Cash Trades: |
||||
1250 sold SPX Call $10.25 |
Long trade |
32.32 |
34.32 |
30.00 |
1255 bought SPX Put $8.93 |
$1.32 credit spread |
26.32 |
28.32 |
27.00 |
615 sold OEX Put $5.38 |
Long trade |
23.25 |
24.25 |
22.93 |
620 bought OEX Put $4.00 |
$1.38 credit spread |
18.88 |
19.63 |
16.00 |
1275 sold SPX Call $5.00 |
Ultra Call Trade |
13.63 |
14.93 |
14.00 |
1285 bought SPX Call $3.62 |
$1.38 credit spread |
8.32 |
9.32 |
8.75 |
1275 sold SPX Feb.Call $35.00 |
Short trade |
39.50 |
41.00 |
40.25 |
1300 bought SPX Feb.Call $22.50 |
$12.50 credit spread |
26.13 |
28.13 |
26.75 |
S&P 500 Options Futures Trades |
Low |
High |
Close |
|
Sold 1250 Call $8.50 |
Long Trade |
44.00 |
30.00 |
39.90 |
Bought 1260 Calls $6.25 |
$2.25 Credit |
33.00 |
22.50 |
31.20 |
Sold 1275 Call $3.00 |
Ultra Trade |
19.80 |
13.00 |
19.00 |
Bought 1280 Call $2.00 |
$1.00 |
17.50 |
9070 |
16.40 |
Copyright © 1998. All rights reserved. The information contained in the AGORA OUTLOOK NEWSLETTER is based upon data that is believed to be accurate, but is not guaranteed, and subject to change without notice. All projections, forecasts, opinions, and track records cannot be guaranteed to equal our past performance. Persons reading this newsletter are responsible for their actions. Officers and employees of this publication may at times have a position in the securities mentioned, or related services.
Short Trades |
Long Trades |
Ultra Trades |
Outright Short Sales |
|||||
| 1999 Current | 1999 Current | 1999 Current | 1999 Current | |||||
| 1998 | 66% |
1998 | 43% |
1998 | 79% |
1998 | 71% |
|
| 1997 | 108% |
1997 | 188% |
1997 | 82% |
|||
| 1996 | 163% |
1996 | 169% |
1996 | 99% |
|||
| 1995 | 93% |
1995 | 76% |
|||||
| 1994 | 79% |
1994 | 89% |
|||||
| 1993 | 177% |
1993 | long |
|||||
| 1992 | 112% |
1992 | long |
|||||
| 1991 | 162% |
1991 | long |
|||||
| 1990 | 166% |
1990 | long |
|||||
Futures Trades
3rd
month of tradingOutright Sells & Strangles |
Long Trades |
Ultra Trades |
| 1999 Current | 1999 Current | 1999 Current |
| 1998 130% | 1998 93% | 1998 16% |